HTML Dashboard

The optional dashboard gives operators a live browser view of lobby health, player counts, routing activity, affinity, and the active configuration summary. It uses its own port and can be changed in navigator.toml.
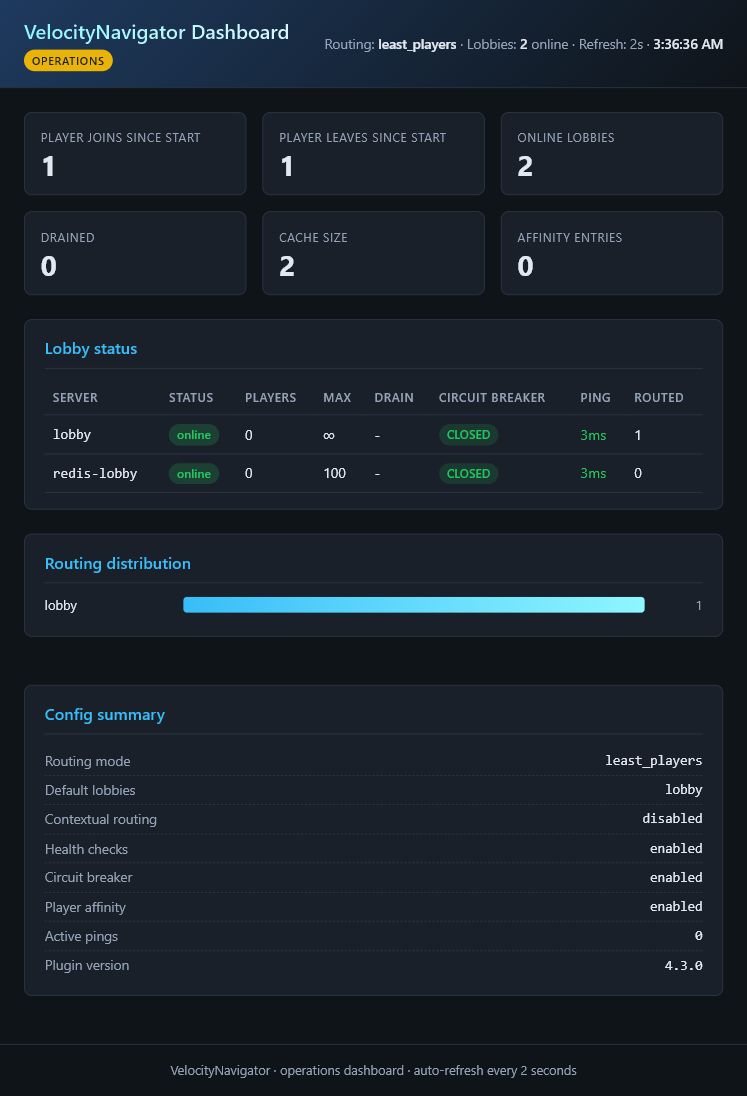
This capture comes from a running proxy with one configured lobby and one Redis-discovered lobby. Dynamic servers appear alongside configured servers and keep their advertised capacity.
[dashboard]
enabled = true
port = 9226
bind_host = "127.0.0.1"
bearer_token = "choose-a-long-random-token"
refresh_seconds = 5
Open http://127.0.0.1:9226/ on the proxy machine. When a token is configured, the page asks for it before loading live data.
- current lobby health, state, latency, and player count;
- routing distribution and live counters since the proxy started;
- the current number of saved affinity records;
- routing mode and important feature settings;
The dashboard reads live proxy data. It is an operations view, not a historical analytics database, so counters reset when the proxy restarts.
| Field | Meaning |
|---|---|
| Player joins / leaves | Connections and disconnections observed since this proxy started; these are not the current online-player count. |
| Online lobbies | Tracked lobbies with a current online health sample. |
| Drained | Lobbies intentionally excluded from new routing. |
| Cache size | Health records currently held by the proxy. |
| Affinity entries | Players with a remembered lobby assignment. |
| Field | Meaning |
|---|---|
| Players | Player count from the latest health sample. |
| Capacity | The lobby's configured or dynamically advertised max_players; uncapped servers show no fixed limit. |
| Latency | Latest measured backend ping time; an unavailable value means no usable sample has been recorded yet. |
| Routed | Successful routing decisions sent to that lobby since the proxy started. |
| Drained | Whether operators have paused new routing to the lobby. |
| Circuit |
CLOSED is normal, OPEN blocks routing after repeated failures, and HALF_OPEN is a recovery probe. |
The routing distribution counts decisions made by VelocityNavigator. It is not a billing or long-term traffic report and should not be treated as one.
Yes, both the port and bind address are configurable. 127.0.0.1 is the safest default because only the proxy machine can connect. Use 0.0.0.0 only when another machine must reach the dashboard, and protect it with a strong bearer_token plus a firewall.
The built-in listener serves HTTP. For a public hostname or HTTPS, keep it on a private address and place a trusted reverse proxy in front of it.
| Problem | Check |
|---|---|
| Page does not open | Confirm enabled, the port, bind address, and firewall rule |
| Address already in use | Choose another unused port and reload |
| Token is rejected | Copy the value exactly; tokens are case-sensitive |
| Another computer cannot connect | Do not use 127.0.0.1 for remote access; bind to a private interface and add a firewall rule |
| Values look empty | Join through the proxy and wait for a health-check cycle |
After a change, run /vn reload and check the proxy log for the dashboard address.

Getting Started
Routing
- Routing Algorithms
- Algorithm Visualizations
- Initial Join Balancing
- Contextual Routing Guide
- Player Affinity
- Health & Circuit Breakers
- Retries & Fallbacks
Player Experience
Configuration
Network & Operations
- Advanced Proxy Systems
- Redis & Multi-Proxy
- Storage & Databases
- Server Management
- Backend Lifecycle States
- HTML Dashboard
- Operations Runbook
- Prometheus & Grafana Setup
- Troubleshooting Guide
- FAQ
VelocityNavigator 4.3.0