Repository navigation
Panels and reports
A panel is the front panel of a measuring station: buttons, sliders and displays bound to the ports of a flow. A report is the document a flow writes about its run: sections, tables, diagrams and checks that pass or fail. This page covers both, and how a flow with checks becomes a test on the command line.
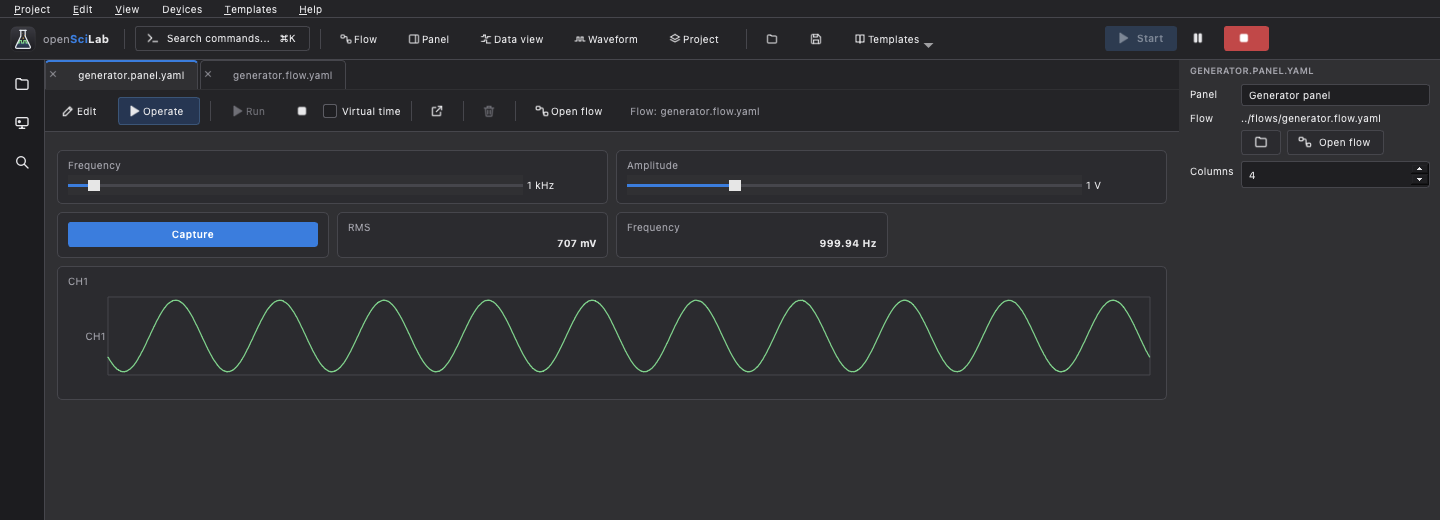
A panel (*.panel.yaml) holds widgets placed freely on its surface, optionally on several tabs and
in framed groups. Each widget is bound to a port of its flow:
- Controls (switch, push button, slider, input, choice) send a value into the flow, as if a wire brought it to that input. Bound to an output instead, they send to the inputs wired to it. An input a control is bound to counts as wired.
- Displays (number, LED, chart, scope) show the values of an output.
- A label is text.
The flow does the work; the panel only operates it. The same flow still runs without the panel.
- From a flow: Panel in the flow's tool bar (also in the Flow menu, and New panel for this flow in the flow's inspector). The new panel starts with suggested widgets: a start button for a sweep, a slider for a PWM duty cycle, inputs the flow needs, numbers and LEDs for measurements and checks, scopes and charts for what the flow shows. The arrow beside Panel lists the panels that already use the flow.
- Empty: Panel in the header or Project → New → Panel; then choose its flow in the inspector (the folder button beside Flow).
- From an example: Templates → Panels has a control panel, a measurement panel and a generator panel.
Save writes the panel file, which names the file of its flow (relative to the panel). If the flow
is not saved yet, saving the panel offers Save the flow first. In a project, panels belong in
panels/.
| Widget | In the palette | Bound to | Options |
|---|---|---|---|
switch |
Switch | sends true/false | value |
button |
Push button | sends an event per press | – |
slider |
Slider | sends the value |
min, max, step, unit, value
|
input |
Input | sends the number typed |
unit, value
|
choice |
Choice | sends the chosen option |
options, value
|
number |
Number | shows a value |
unit, digits
|
led |
LED | on for true or above threshold
|
color, threshold
|
chart |
Chart | values over time (or x/y pairs) |
points, unit
|
scope |
Scope | a capture or signal as traces | – |
label |
Label | text | text |
The panel document has two views in its tool bar: Edit (arrange and bind) and Operate (use it). Edit works like a GUI editor:
- Drag a widget from the palette on the left onto the panel - a dashed frame shows where it lands - or double-click it to add it on the first free place.
- Drag a widget to move it; a selected widget has eight handles, at its corners and edges, to resize it. While you drag, its edges and its middle snap to the edges and middles of the other widgets and of the panel when they come within 6 pixels, and red guides show what lines up; otherwise it lands on a raster of 8 pixels (the dots). Hold Alt to place it freely.
-
Several widgets: Shift or Ctrl and a click add a widget to the selection (or take it out); a
frame drawn on the free surface selects every widget it touches;
Ctrl+Aselects all of the tab. Dragging one of them moves them all. - The arrow keys move the selection by a pixel, with Shift by 8. Remove widget (Delete) removes it.
- Arrange (in the tool bar, or a right click) aligns the left edges, centres, right edges, top edges, middles or bottom edges of the selected widgets, distributes three or more evenly side by side or one above the other, and brings widgets to the front or sends them to the back.
- Drag the corner of the panel (lower right) to make it larger or smaller - never smaller than its widgets need; adding a widget below the others makes it larger by itself.
- In the inspector choose the Port a widget is bound to. The list offers only ports of a type the
widget can show or send (an LED a truth value, a scope a capture, ...). X, Y, Width and
Height place it exactly; Title, Tab and Group - a new name in Tab or Group makes a
new tab or group, framed around its widgets. Options takes
key: valuepairs, e.g.min: 0, max: 1, step: 0.05.
With no widget selected, the inspector shows the panel's name, its Flow (with Open flow) and its Width and Height. A widget bound to a port the flow does not have is marked with ⚠, and the tool bar counts the problems. Every change can be undone.
- Run in the panel's tool bar (or Start in the header) starts the flow and switches to Operate. The flow runs until Stop. The current settings of the switches, sliders, inputs and choices are sent once at the start; after that every change is sent at once.
- The panel runs its flow as it is: if the flow is open in a tab, with its unsaved changes; otherwise the file, read again when it changed.
- Virtual time runs simulated instruments in the flow's own time (as fast as possible, the same result every run). Leave it off for real devices and for panels you operate by hand.
- The panel grows or shrinks with its window as a whole, keeping its proportions (down to half its size; a smaller window scrolls).
- Full screen (F11) shows the panel alone, like an application of its own; F11 or Esc goes back.
- Charts zoom with the wheel or a pinch (with Shift only the values) and move with two fingers or by dragging; a double-click goes back to the automatic range.
- Open flow shows the flow the panel works with.
panel: Control panel
flow: ../flows/control.flow.yaml
width: 960
height: 304
tabs: ['', Chart]
widgets:
  title: {kind: label, x: 16, y: 16, width: 928, height: 80, text: Arduino Uno}
  duty: {kind: slider, bind: pwm.duty, title: PWM of D9, x: 16, y: 112, width: 456, height: 80, min: 0, max: 1, step: 0.05, value: 0.5}
  led: {kind: switch, bind: led.value, title: LED D13, x: 488, y: 112, width: 224, height: 80}
  volts: {kind: number, bind: monitor.A0, title: A0, x: 16, y: 208, width: 224, height: 80, unit: V, digits: 3}
  chart: {kind: chart, bind: monitor.A0, title: A0 over time, x: 16, y: 16, width: 928, height: 272, tab: Chart, unit: V}
bind is node.port of the flow; width and height at the top are the size of the panel, x,
y, width and height of a widget its place and size, in pixels from the top left corner;
tab and group are names (the first tab has none). This is Templates → Panels → Control panel: the slider drives the input
duty of a gpio.pwm node, the switch the input value of a gpio.write node, and the displays
show the outputs of a device.monitor node.
| Node | What it adds |
|---|---|
report.section |
a heading (title) and a text; values arriving at in are added below it |
report.table |
the last table (or the values) arriving at in
|
report.image |
a diagram: an XY chart of two table columns (x, y) or of (x, y) values, or the traces of a capture or signal |
report.check |
a check of the values at in: limits (low, high) or an expected value with a tolerance, with a name and unit; its pass output says the result |
report.write |
writes the report to path
|
report.write writes when the flow ends, or on every value at its write input. A path ending
in .pdf gives a PDF, anything else HTML. A plain file name goes into the data folder of the flow
(in a project its data/ folder). Its outputs say when it has written and whether all checks
passed. The report is written also when the flow was stopped or failed, and then says what
failed.
The report starts with its title, the date and the verdict (PASSED, FAILED or no
checks), then the sections, tables and diagrams in the order the nodes first added them (a node that
adds its part again replaces it), then a table of all checks. Besides report.check, every
control.compare counts as a check. Diagrams are embedded as SVG.
From Templates → Measurement → Test report: a capture of three channels, measurements, checks, and the report.
  clock: {type: measure.frequency}
  clock_check: {type: report.check, name: Clock D8, low: 990000, high: 1010000, unit: Hz}
  slow: {type: measure.period}
  slow_check: {type: report.check, name: Period D15, expected: 0.001, tolerance: 1.0e-05, unit: s}
  uart: {type: decode.uart, channels: {rx: D9}, baudrate: 115200, format: ascii}
  uart_check: {type: control.compare, op: contains, value: openSciLab}
  intro: {type: report.section, title: Device under test, text: 'The simulated device: clock on D8, UART on D9, 1 kHz on D15.'}
  report: {type: report.write, path: test-report.html, title: Test report}
The report lands in the project's data/ folder; the Project sidebar lists it, and it opens in
the application your system uses for HTML or PDF.
More examples: Templates → Data and reports → Report with a diagram (a table and a diagram) and Templates → Measurement → Statistics (a table, a diagram and a check of every value).
A flow with checks is a test of a device. On the command line:
openscilab run flows/test.flow.yaml --report out.html- The exit code is 0 when the flow finished and every check passed (
report.checkandcontrol.compare), 1 otherwise. A script or a CI job can rely on it. -
--report FILE.htmlwrites a report of the run: the parts of thereport.*nodes and the checks, then the run itself (the state of every node, the last value of every output, the log).report.writenodes in the flow write their own files as well. - With simulators: add
--sim(every device node becomes its simulator) and--fast(virtual time), e.g. to test the flow itself in CI before it meets the hardware. -
--device NAME=ADDRESSruns the same flow against another device.
Templates → Measurement → Test bench is built for this: a panel runs it with a button, the command line runs it as a test. All options are on the Scripting page.
- Flows – the editor and running flows
- Nodes – what the other nodes do
- docs/lab.md – panels and reports in the reference