feature agentic
-
🔐 AI
-
⚙️ Sub-Features
- 1. 🔧 Security – Easy Onboarding and Visual Action Priority Map
- 2. 🔧 History – AI Actions and Vulnerability Findings
- 3. 🔧 OWASP – GenAI Top 10 Scorecard
-
4. 🔧 Alignment – Divergence Monitor with Easy / Advanced Views
- Easy View – Source Quadrants, Forecast Branches, and Live Activity
- Easy View Rewind – Historical Snapshot Scrubber
- Easy View Selection Card – Source, Process, Forecast, Activity
- Behavioral Model – Declared Intent Window
- Divergence Verdict – Correlated Evidence Review
- Contributing Agents – Per-Source Intent Breakdown
- Injection History – Published Intent Snapshots
- Verdict History – Correlated Outcome Timeline
- 5. 🔧 Alignment – Advanced View (Declared Intent vs Live Telemetry)
-
6. 🔧 Settings – Provider, Delivery, and MCP Configuration
- Cloud LLM – EDAMAME Portal AI Service
- Use Your Own LLM – BYOLLM
- Refresh Frequency – Engine Cadence Control
- Slack Delivery – Team Notifications
- Telegram Delivery – Interactive Predefined Replies
- Capture Detail – Agent Context Privacy Tiers
- Dismissal Rules – Recurrence-Aware Suppressions
- Server Controls – Start/Stop MCP
- MCP Authentication – Pairing and PSK
- Available Tools – 19 Security APIs
- Integration Guide – Cursor, OpenClaw, Claude Desktop
- Agent Plugins – Install and Per-Agent Observer Control
- 📋 Contents
-
⚙️ Sub-Features
Overview Use this tab to automate security triage and remediation with AI. Start in Security to choose Watchdog or Assistant mode and visualize priorities alongside vulnerability findings, continue in History for unified action and per-finding vulnerability review with read-status tracking, open OWASP to read the GenAI Top 10 scorecard mapping live agent risks onto each OWASP category as covered, at-risk, or not-applicable, open Alignment to see the Divergence monitor in either Easy view (source-centric quadrant map with timeline rewind) or Advanced view (behavioral-model hero card, verdict panel, and history sections) via the Easy / Advanced pill toggle with flip animation, and manage portal sign-in, engine cadence, delivery channels, custom LLMs, and MCP access from Settings. The security guarantee comes from EDAMAME's host-side transcript observer, which monitors any agent the moment it is discovered on disk, with no plugin installed, and that a compromised agent cannot pause or silence; the per-agent plugins are cooperative add-ons that extend coverage off-host (remote, SSH, container, CI, VM) and streamline onboarding, but never adjudicate verdicts.
Description: Start here for the quickest AI onboarding flow. Choose Watchdog or Assistant mode, set the loop cadence directly on the radar, sign in if needed, then visually prioritize actions from inner rings (critical) to outer rings (low). Filter by type/status and open highest-priority points first.
| List View | Detail View |
|---|---|
 |
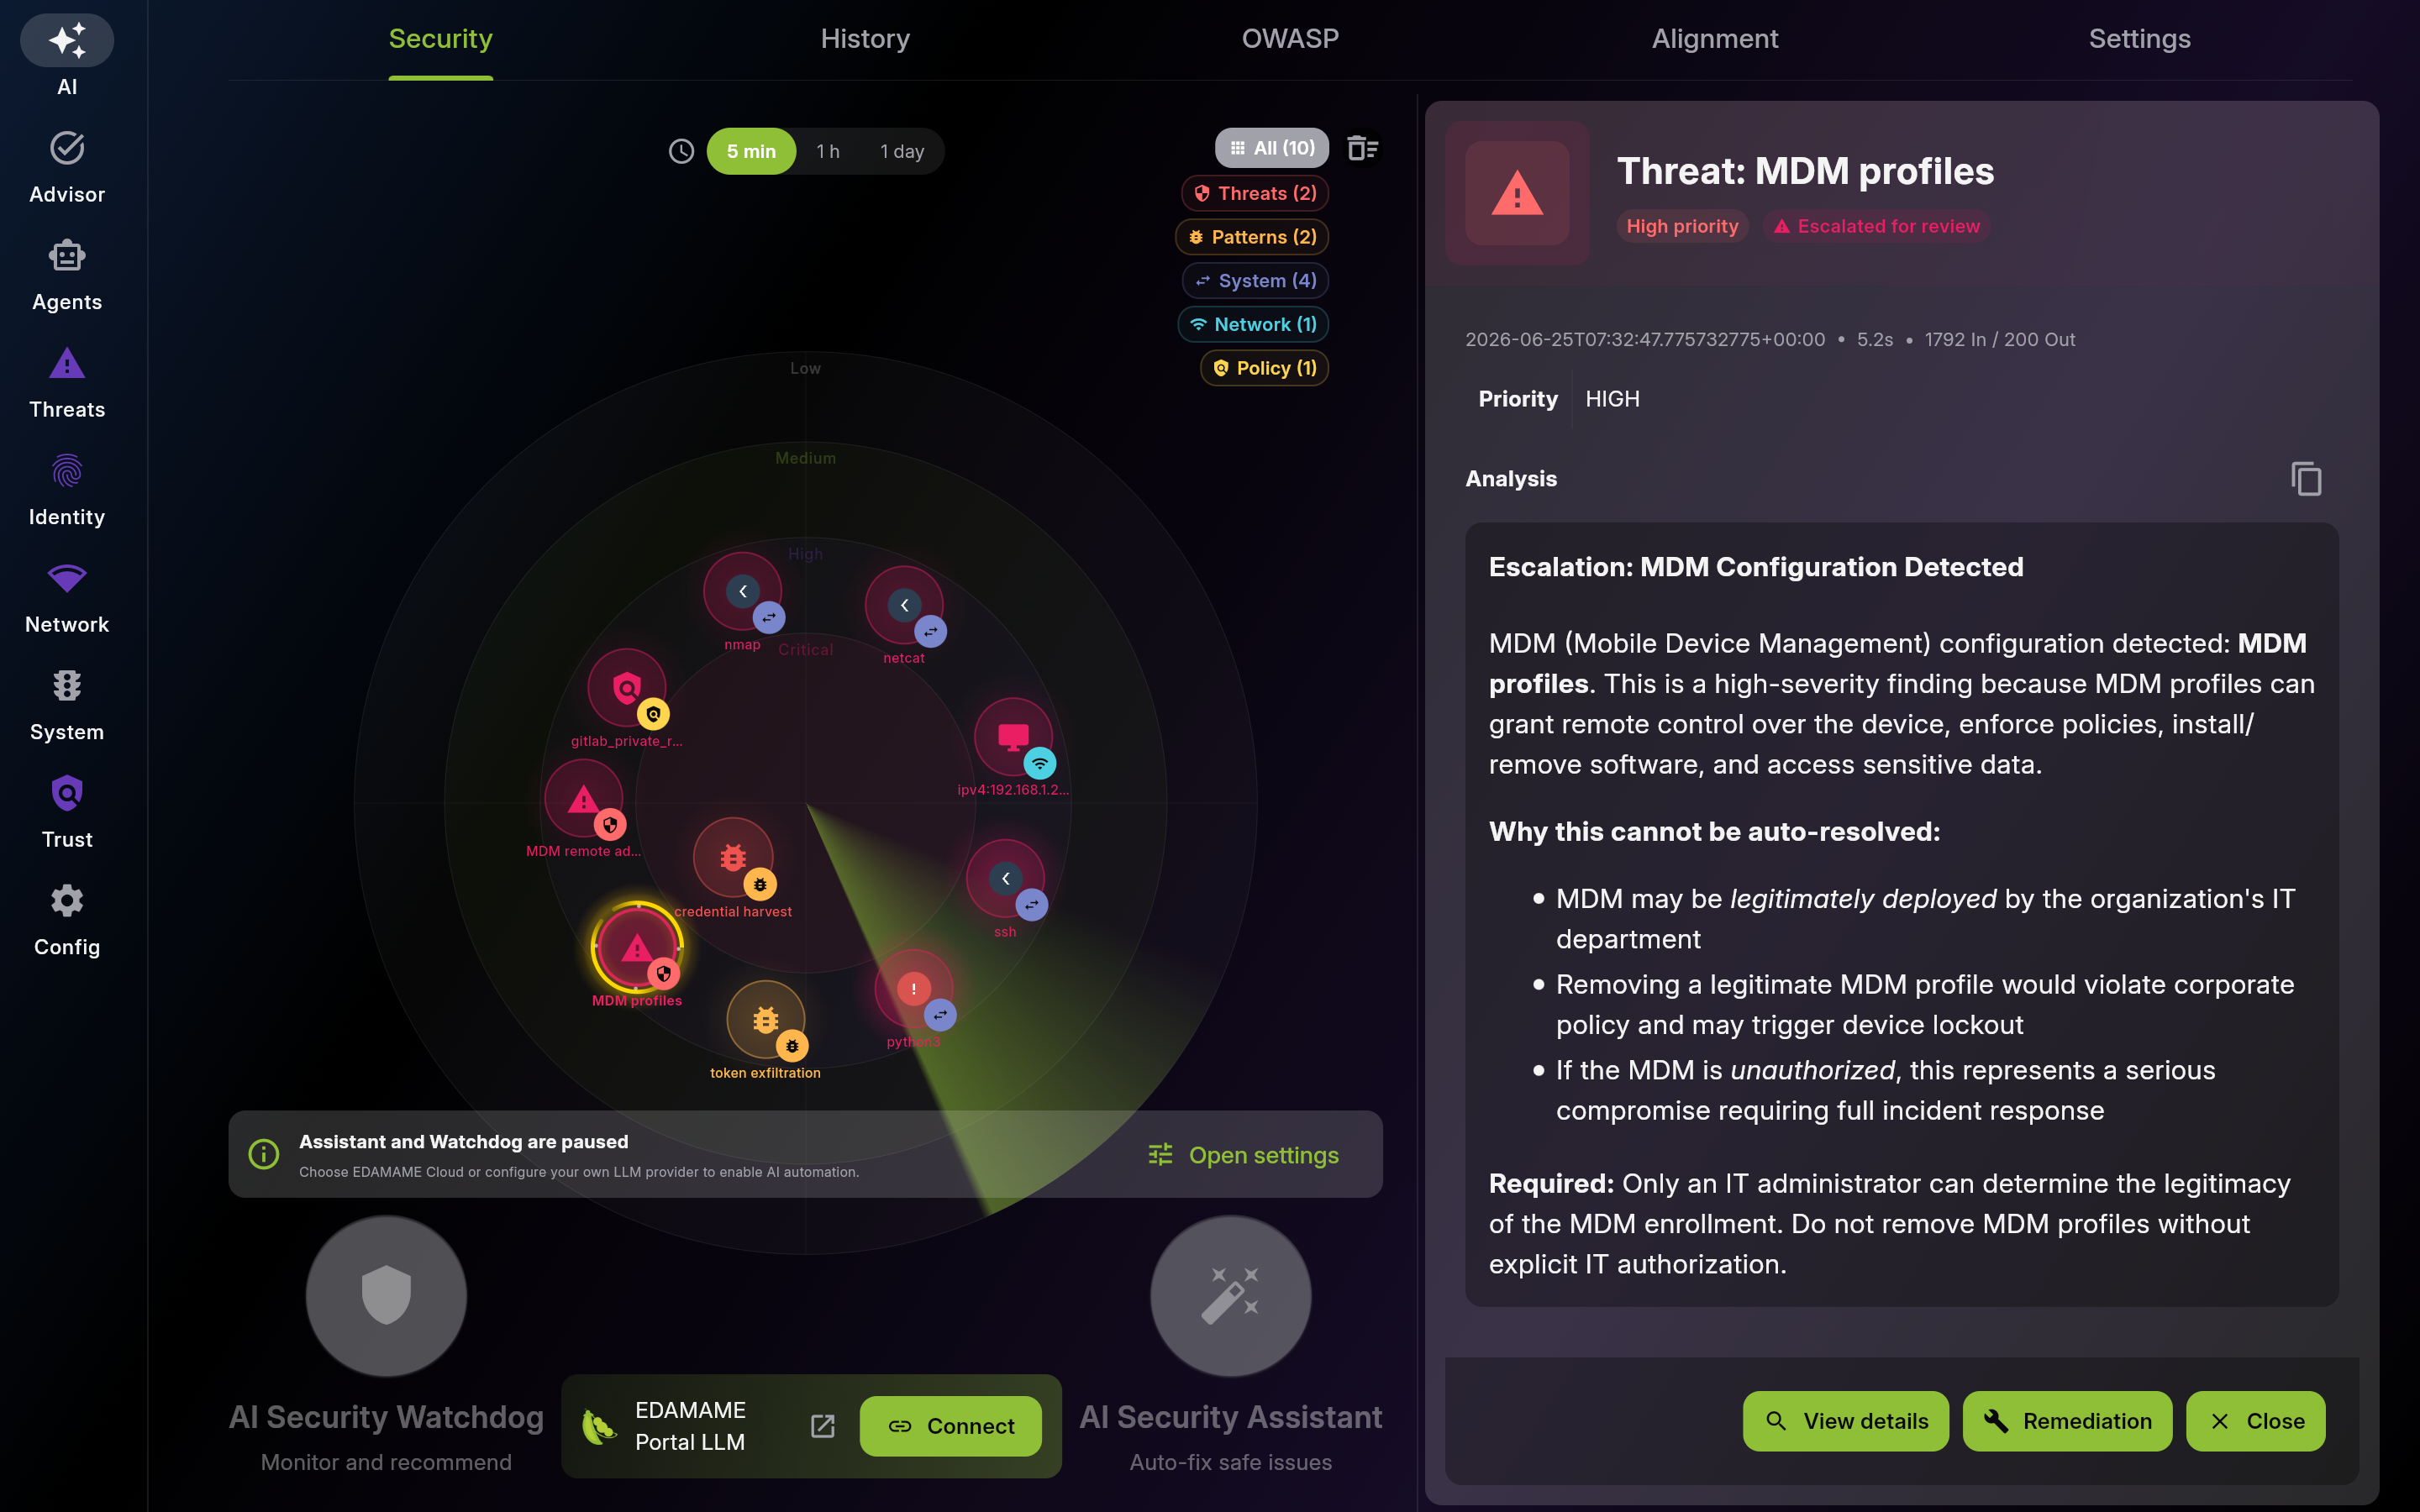 |
Screenshot of Security – Easy Onboarding and Visual Action Priority Map - Multi-pane layout showing list and detail views
Resolve inner-ring items first to reduce critical risk fastest. Then work outward by decreasing priority.
Use filters to isolate one workload type at a time. This keeps triage focused and avoids missing urgent items.
Activate or switch automation mode directly from the radar and tune cadence in place. Confirm sign-in state before launching cloud-backed runs.
Description: Use History as the single review surface for AI decisions and vulnerability findings. Triage actions by status, type, and read state; review vulnerability findings by severity and dismissed state; use Mark all as read for large batches.
| List View | Detail View |
|---|---|
 |
 |
Screenshot of History – AI Actions and Vulnerability Findings - Multi-pane layout showing list and detail views
Use this section as your audit trail of AI decisions. Filter by status, type, or read state and apply confirm, undo, or mark-as-read actions safely.
Track token usage to control cost and detect spikes. Tune schedule or provider when consumption drifts.
Scan findings in the same list rhythm as actions. Use type and dismissed filters to separate active triage from cleared noise.
Use one detail pattern for every history entry so operators never switch mental models between actions and findings.
Description: Use OWASP to read agent posture against an industry-standard taxonomy at a glance. The scorecard is fully deterministic, so a grade reflects observed structural facts (MCP exposure, capability sprawl, recursive delegation, blast radius, critical subprocess usage), not a model opinion. Start with the at-risk categories, expand a card to read the contributing findings with their severity and alertable status, follow the OWASP reference link for the authoritative category definition, and pivot to the Agents tab for the underlying detail.

Scan the grid for at-risk categories first; the grade is computed deterministically with no LLM in the loop.
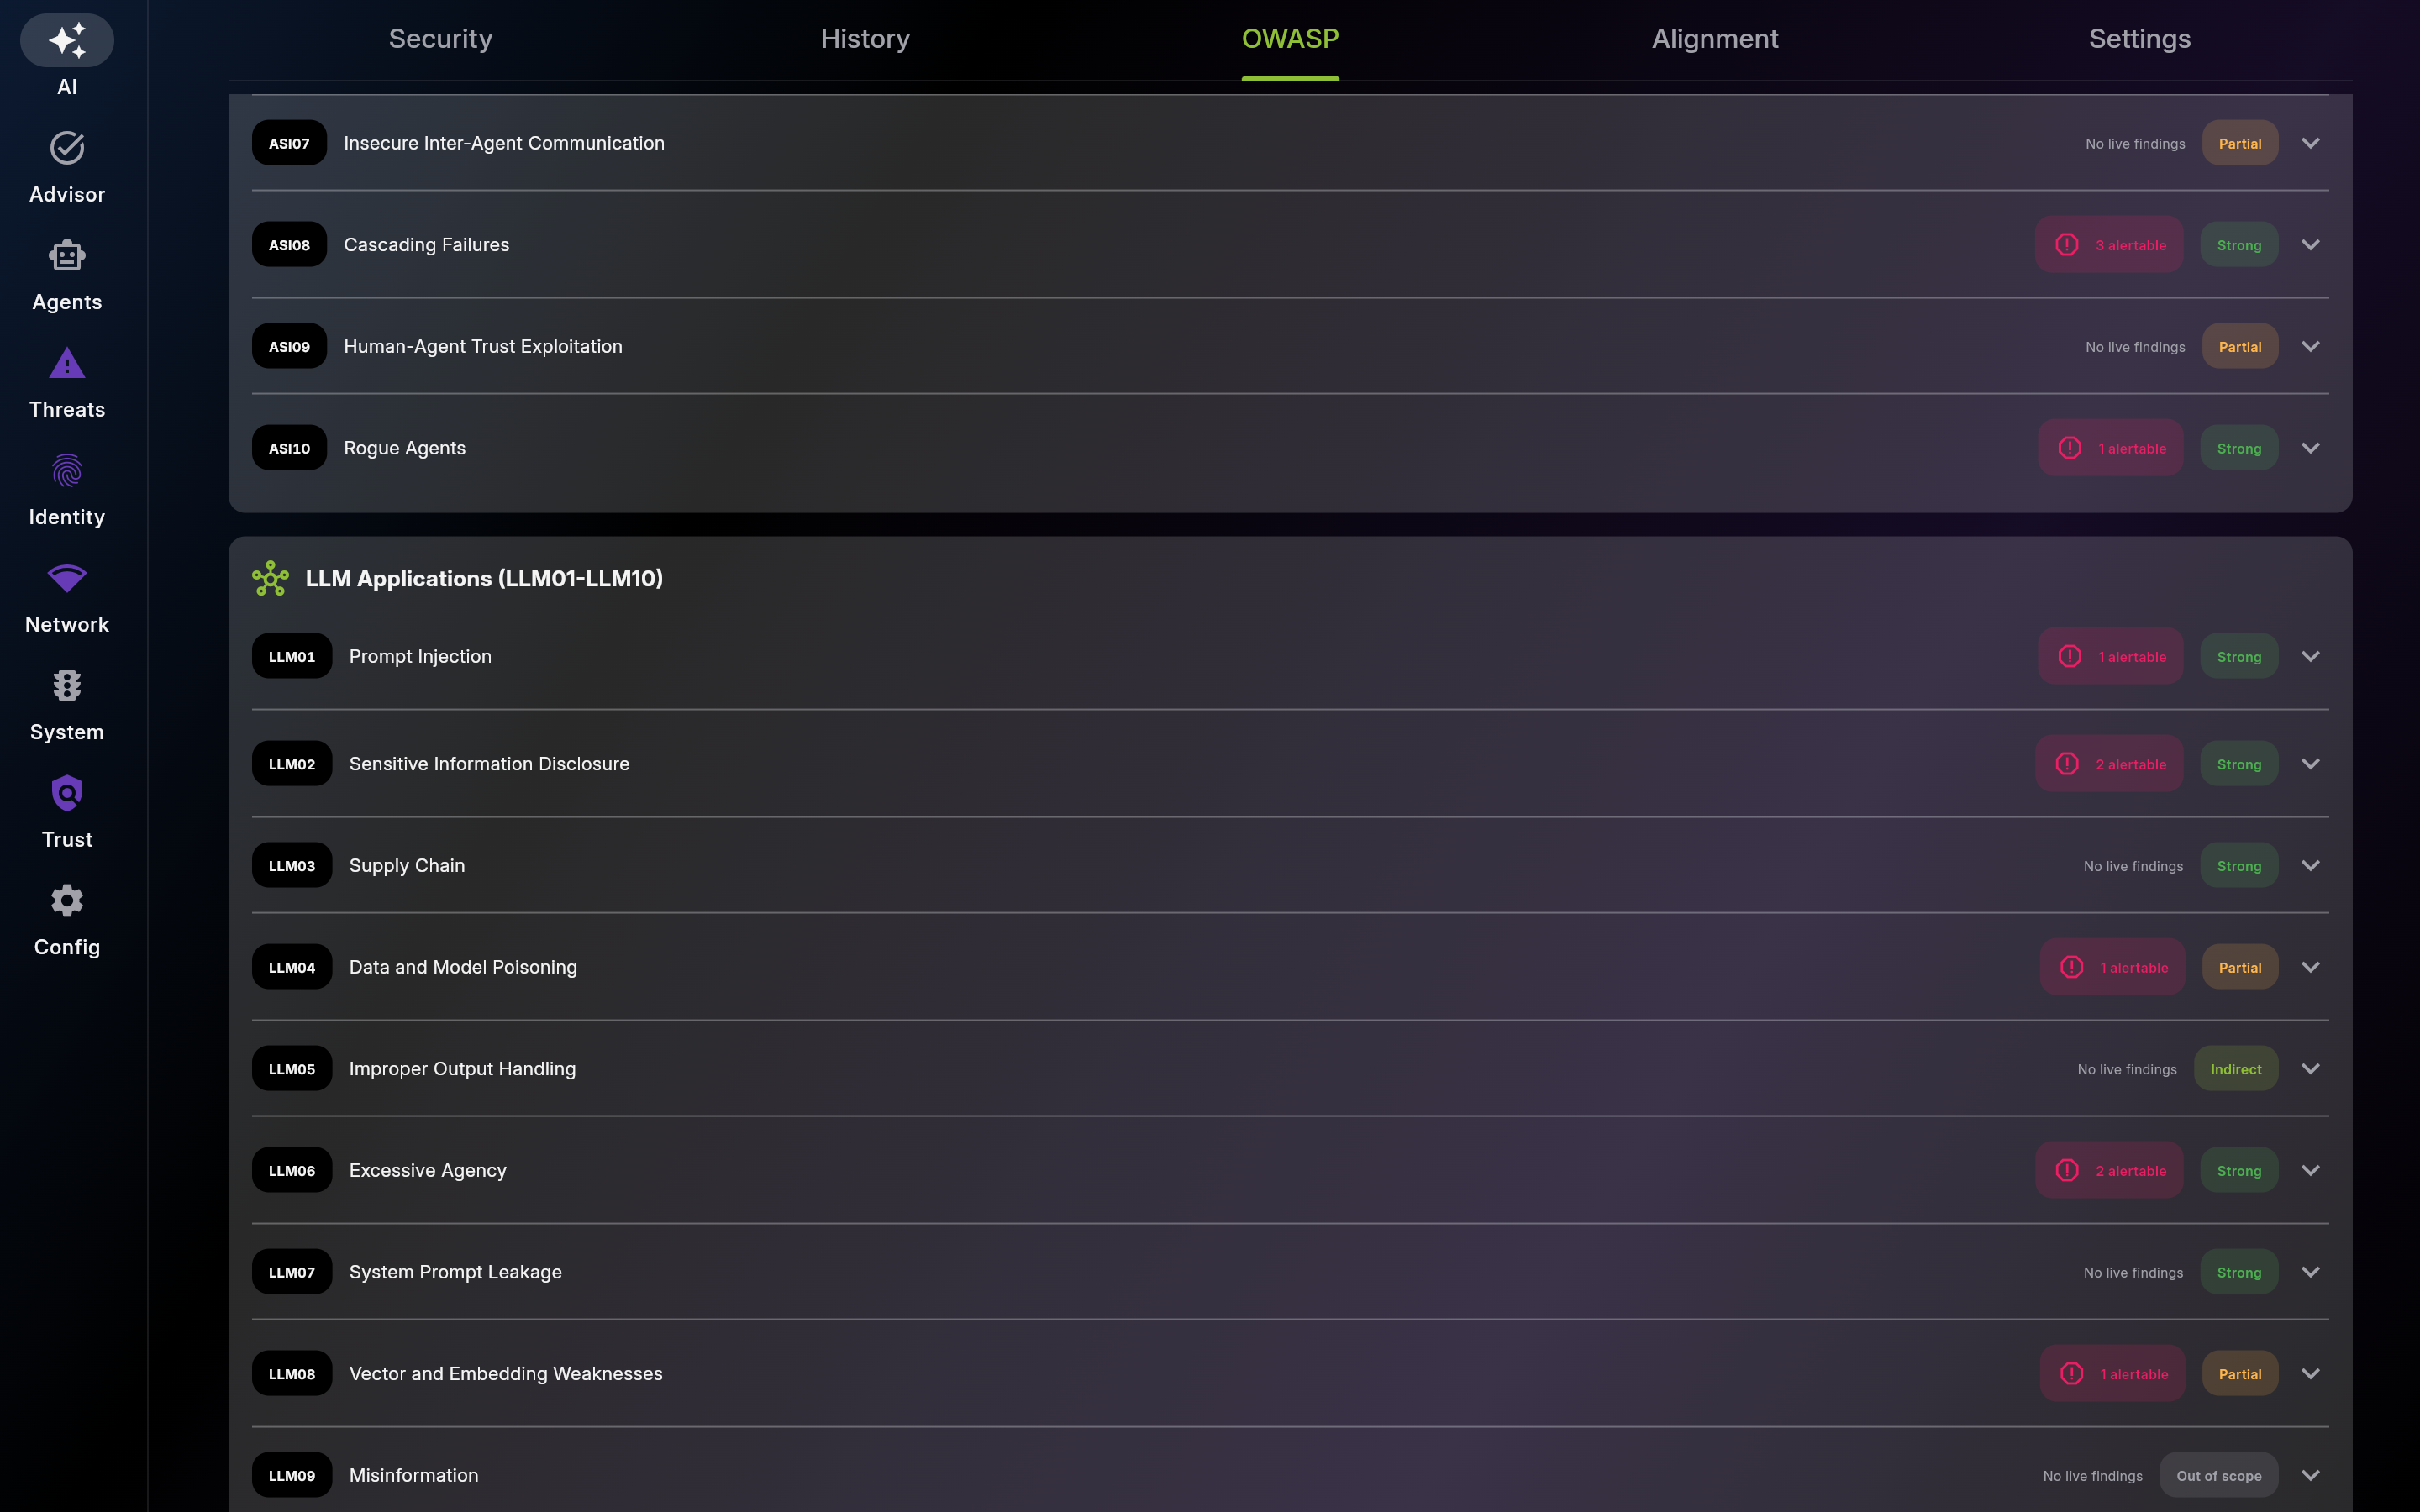
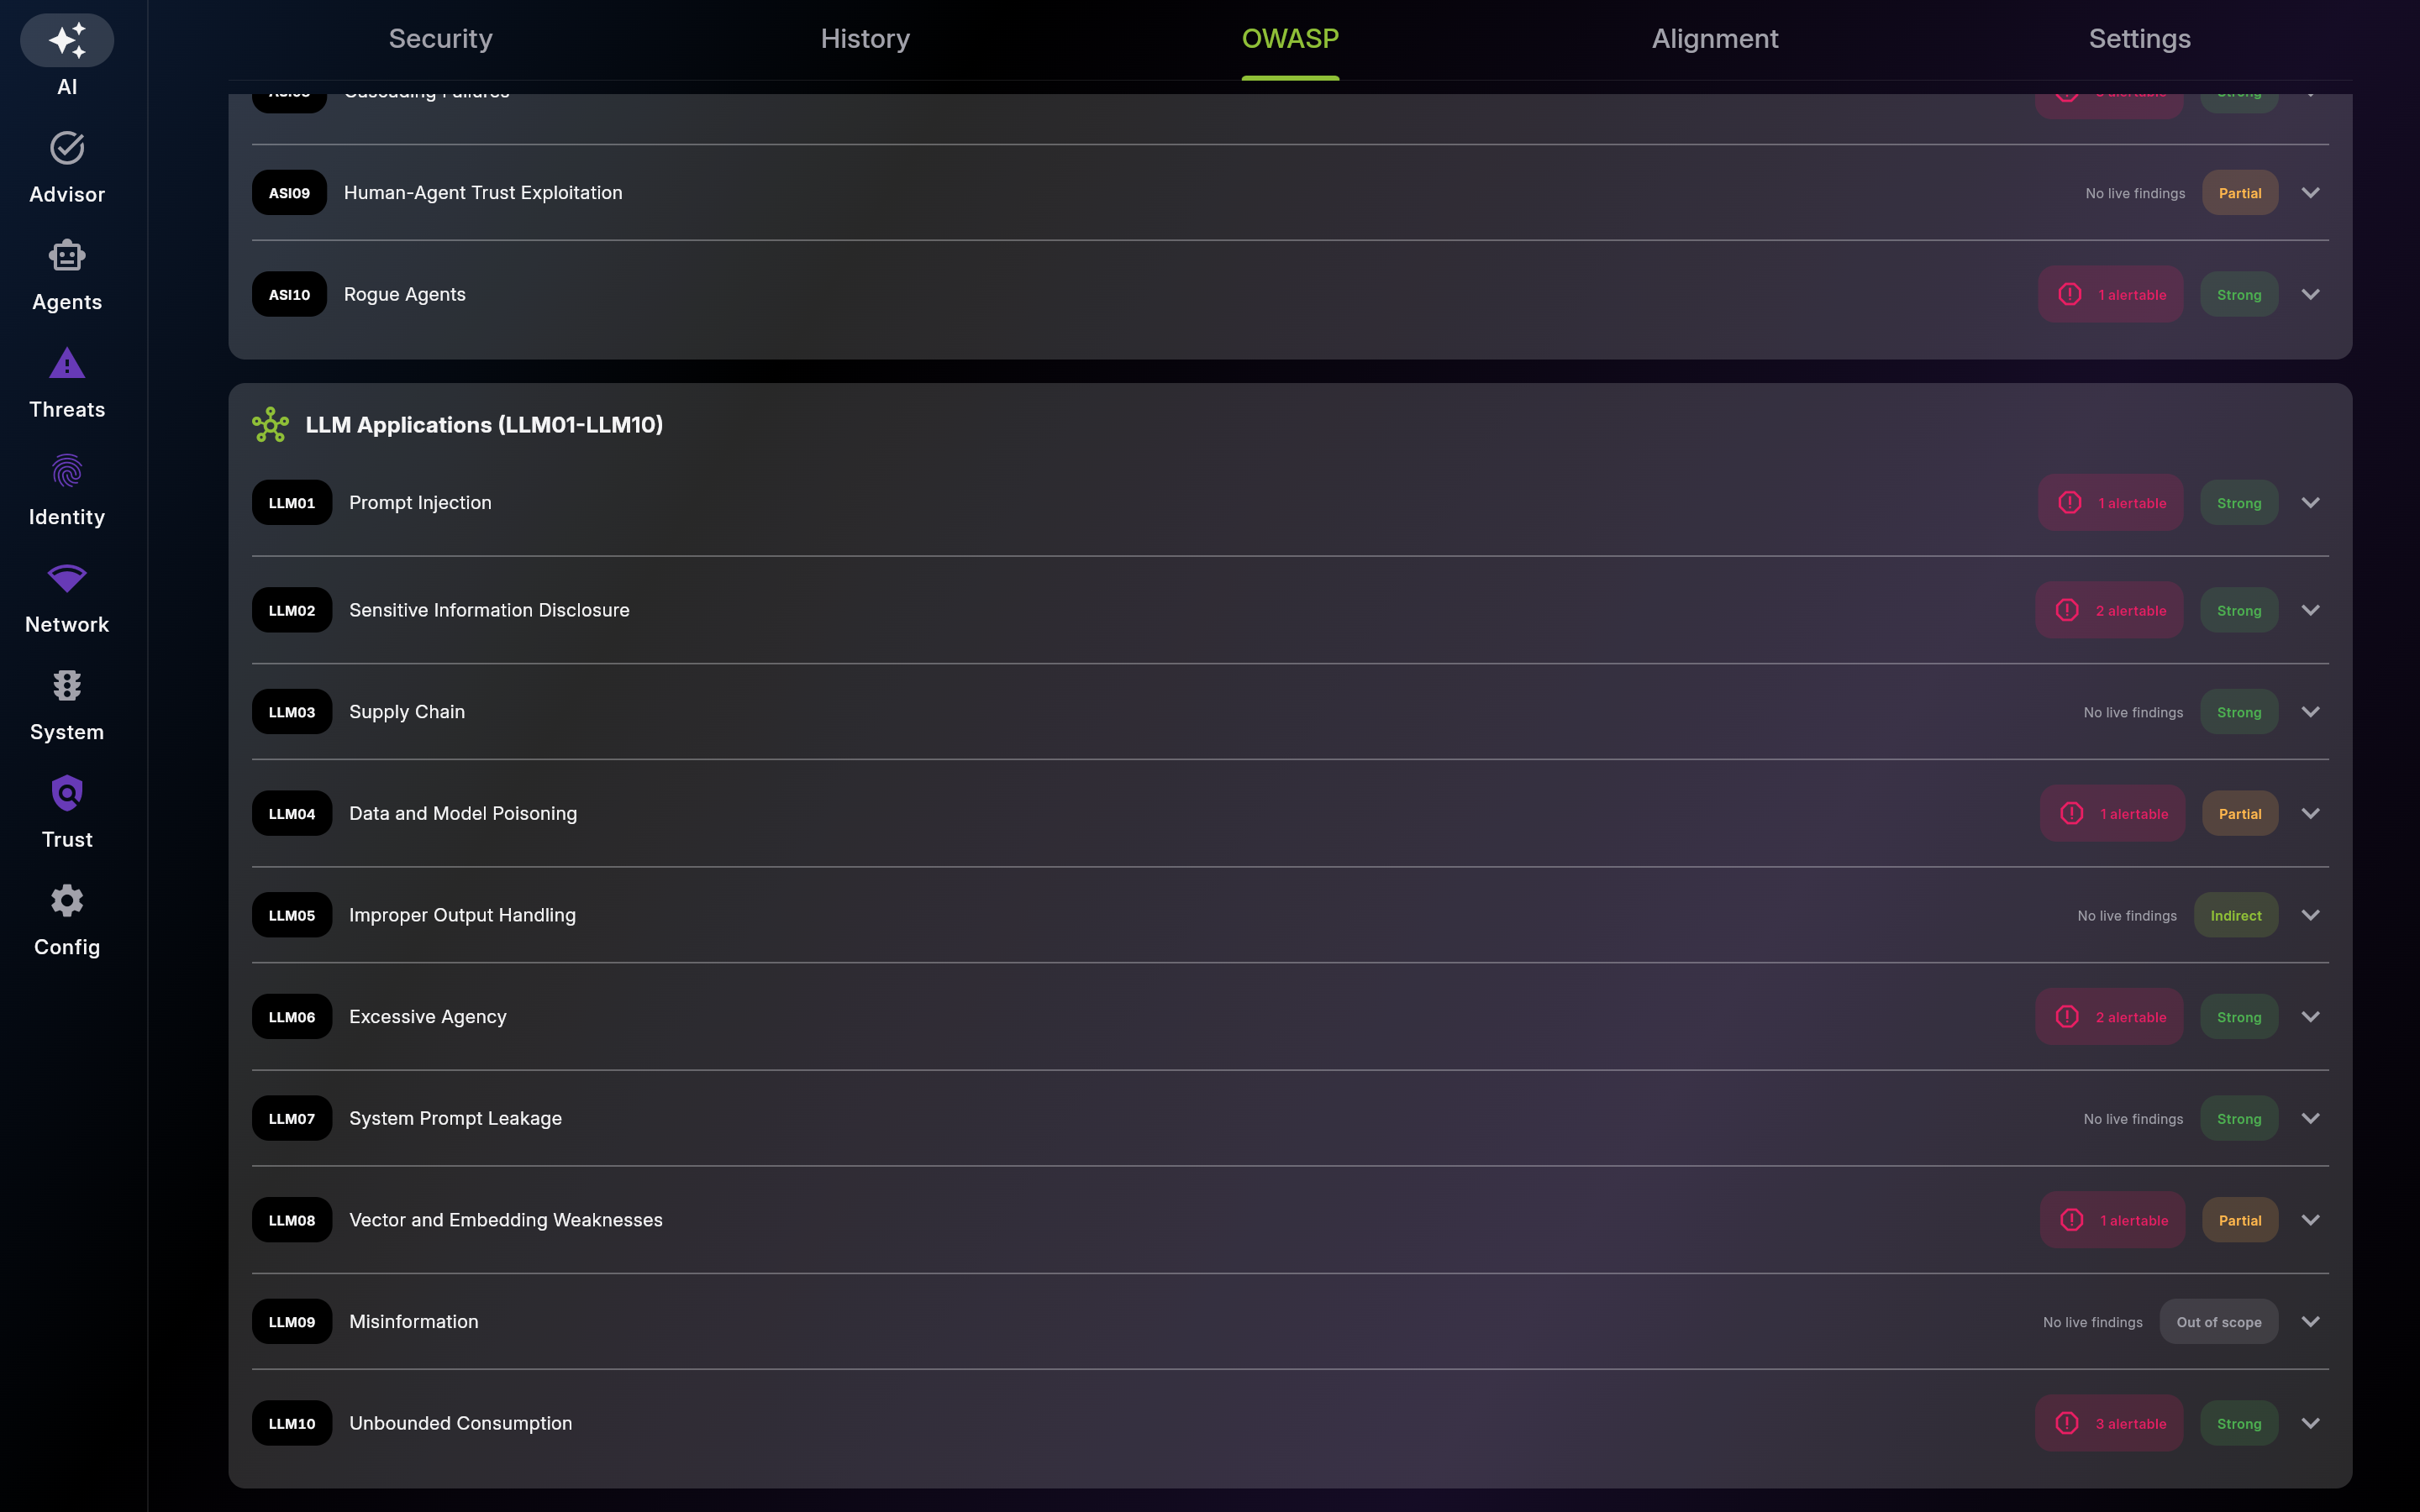
Open a card to see exactly which findings drove the grade -- their severity and whether they are alertable -- follow the reference link to the authoritative OWASP category definition, and pivot to the named Agents-tab panel for the underlying detail.
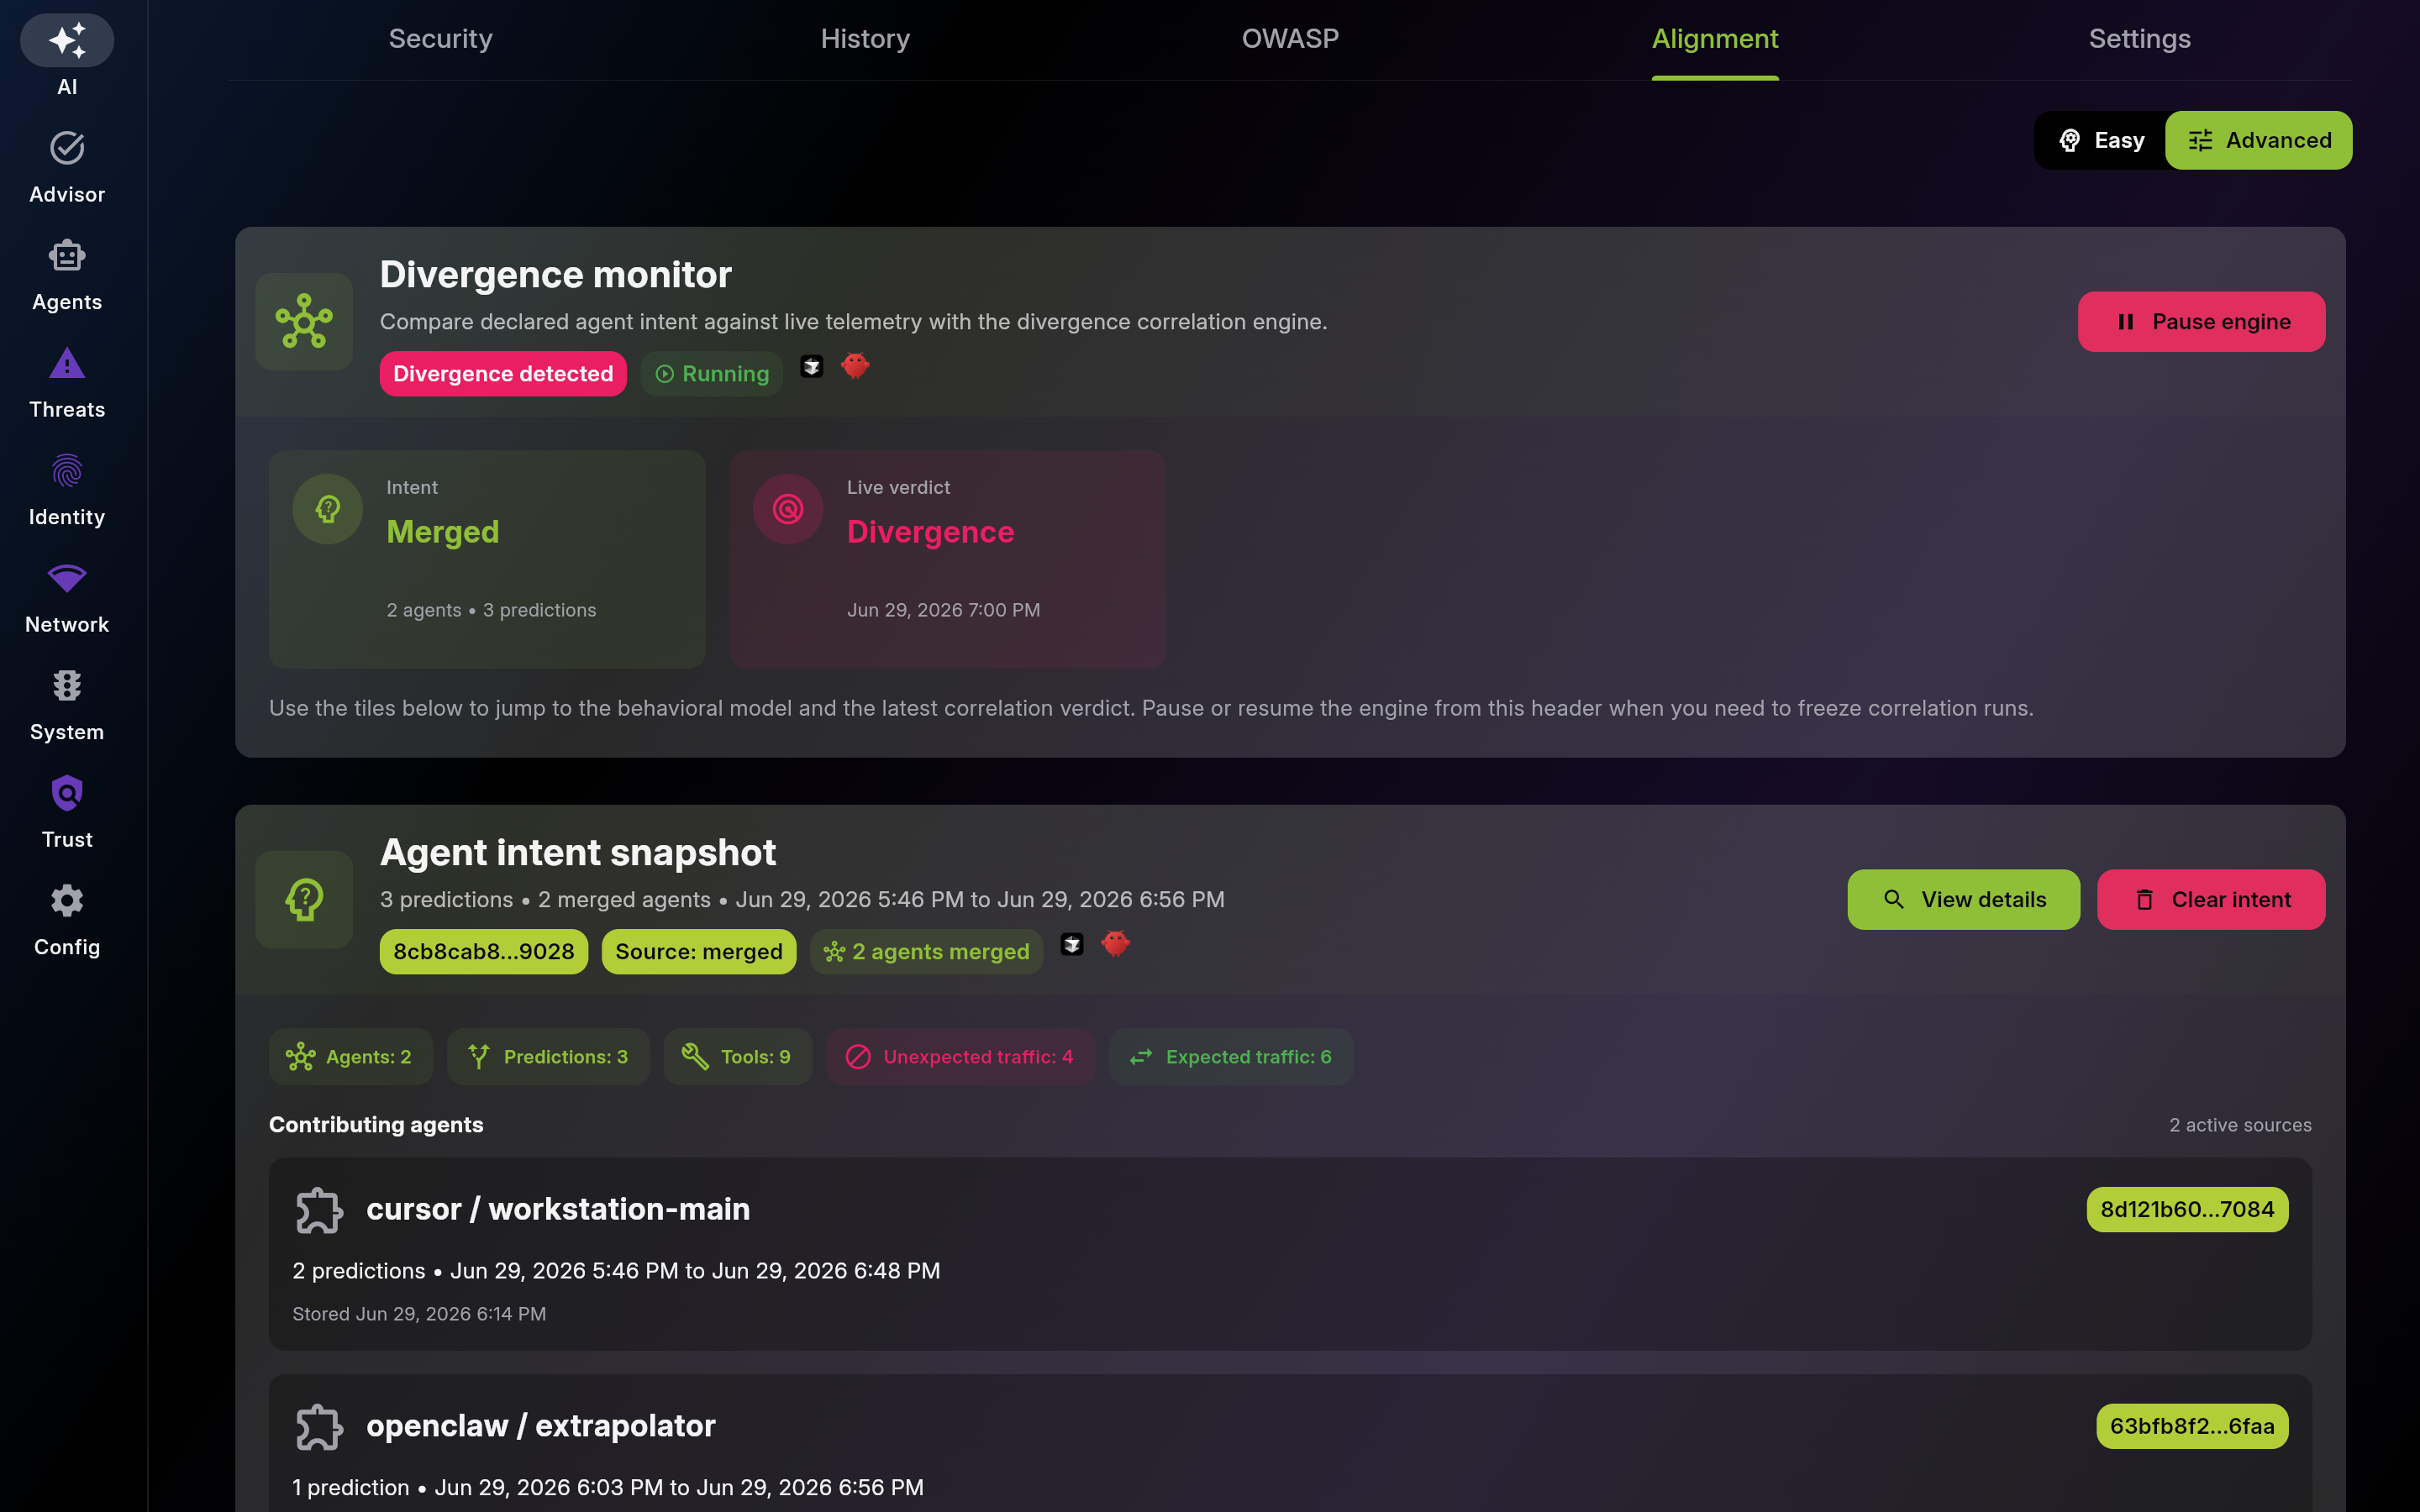
Description: Use Alignment to watch the Divergence monitor in the view that best fits the question. Start in Easy to see, at a glance, which source predicted which process branch, what that branch actually touched, and how far real activity stayed inside the forecast; rewind through recent detector snapshots on the timeline when one moment is not enough. Flip to Advanced to compare declared agent intent against live system telemetry, review behavioral injection and verdict history, confirm via the MCP status badge that external agents can inject intent, and expand the history sections to inspect past injections and verdict outcomes. Both views share the same 'Divergence monitor' headline and the same actions (View session, View process, Mark process safe, Dismiss, Restore). Model-independent vulnerability findings appear in the Security radar; vulnerability findings timeline lives in the History subtab. The security guarantee here comes from EDAMAME's host-side transcript observer, which monitors any agent discovered on disk even with no plugin installed; the agent plugins are cooperative contributors that add off-host coverage and onboarding, and never adjudicate verdicts.
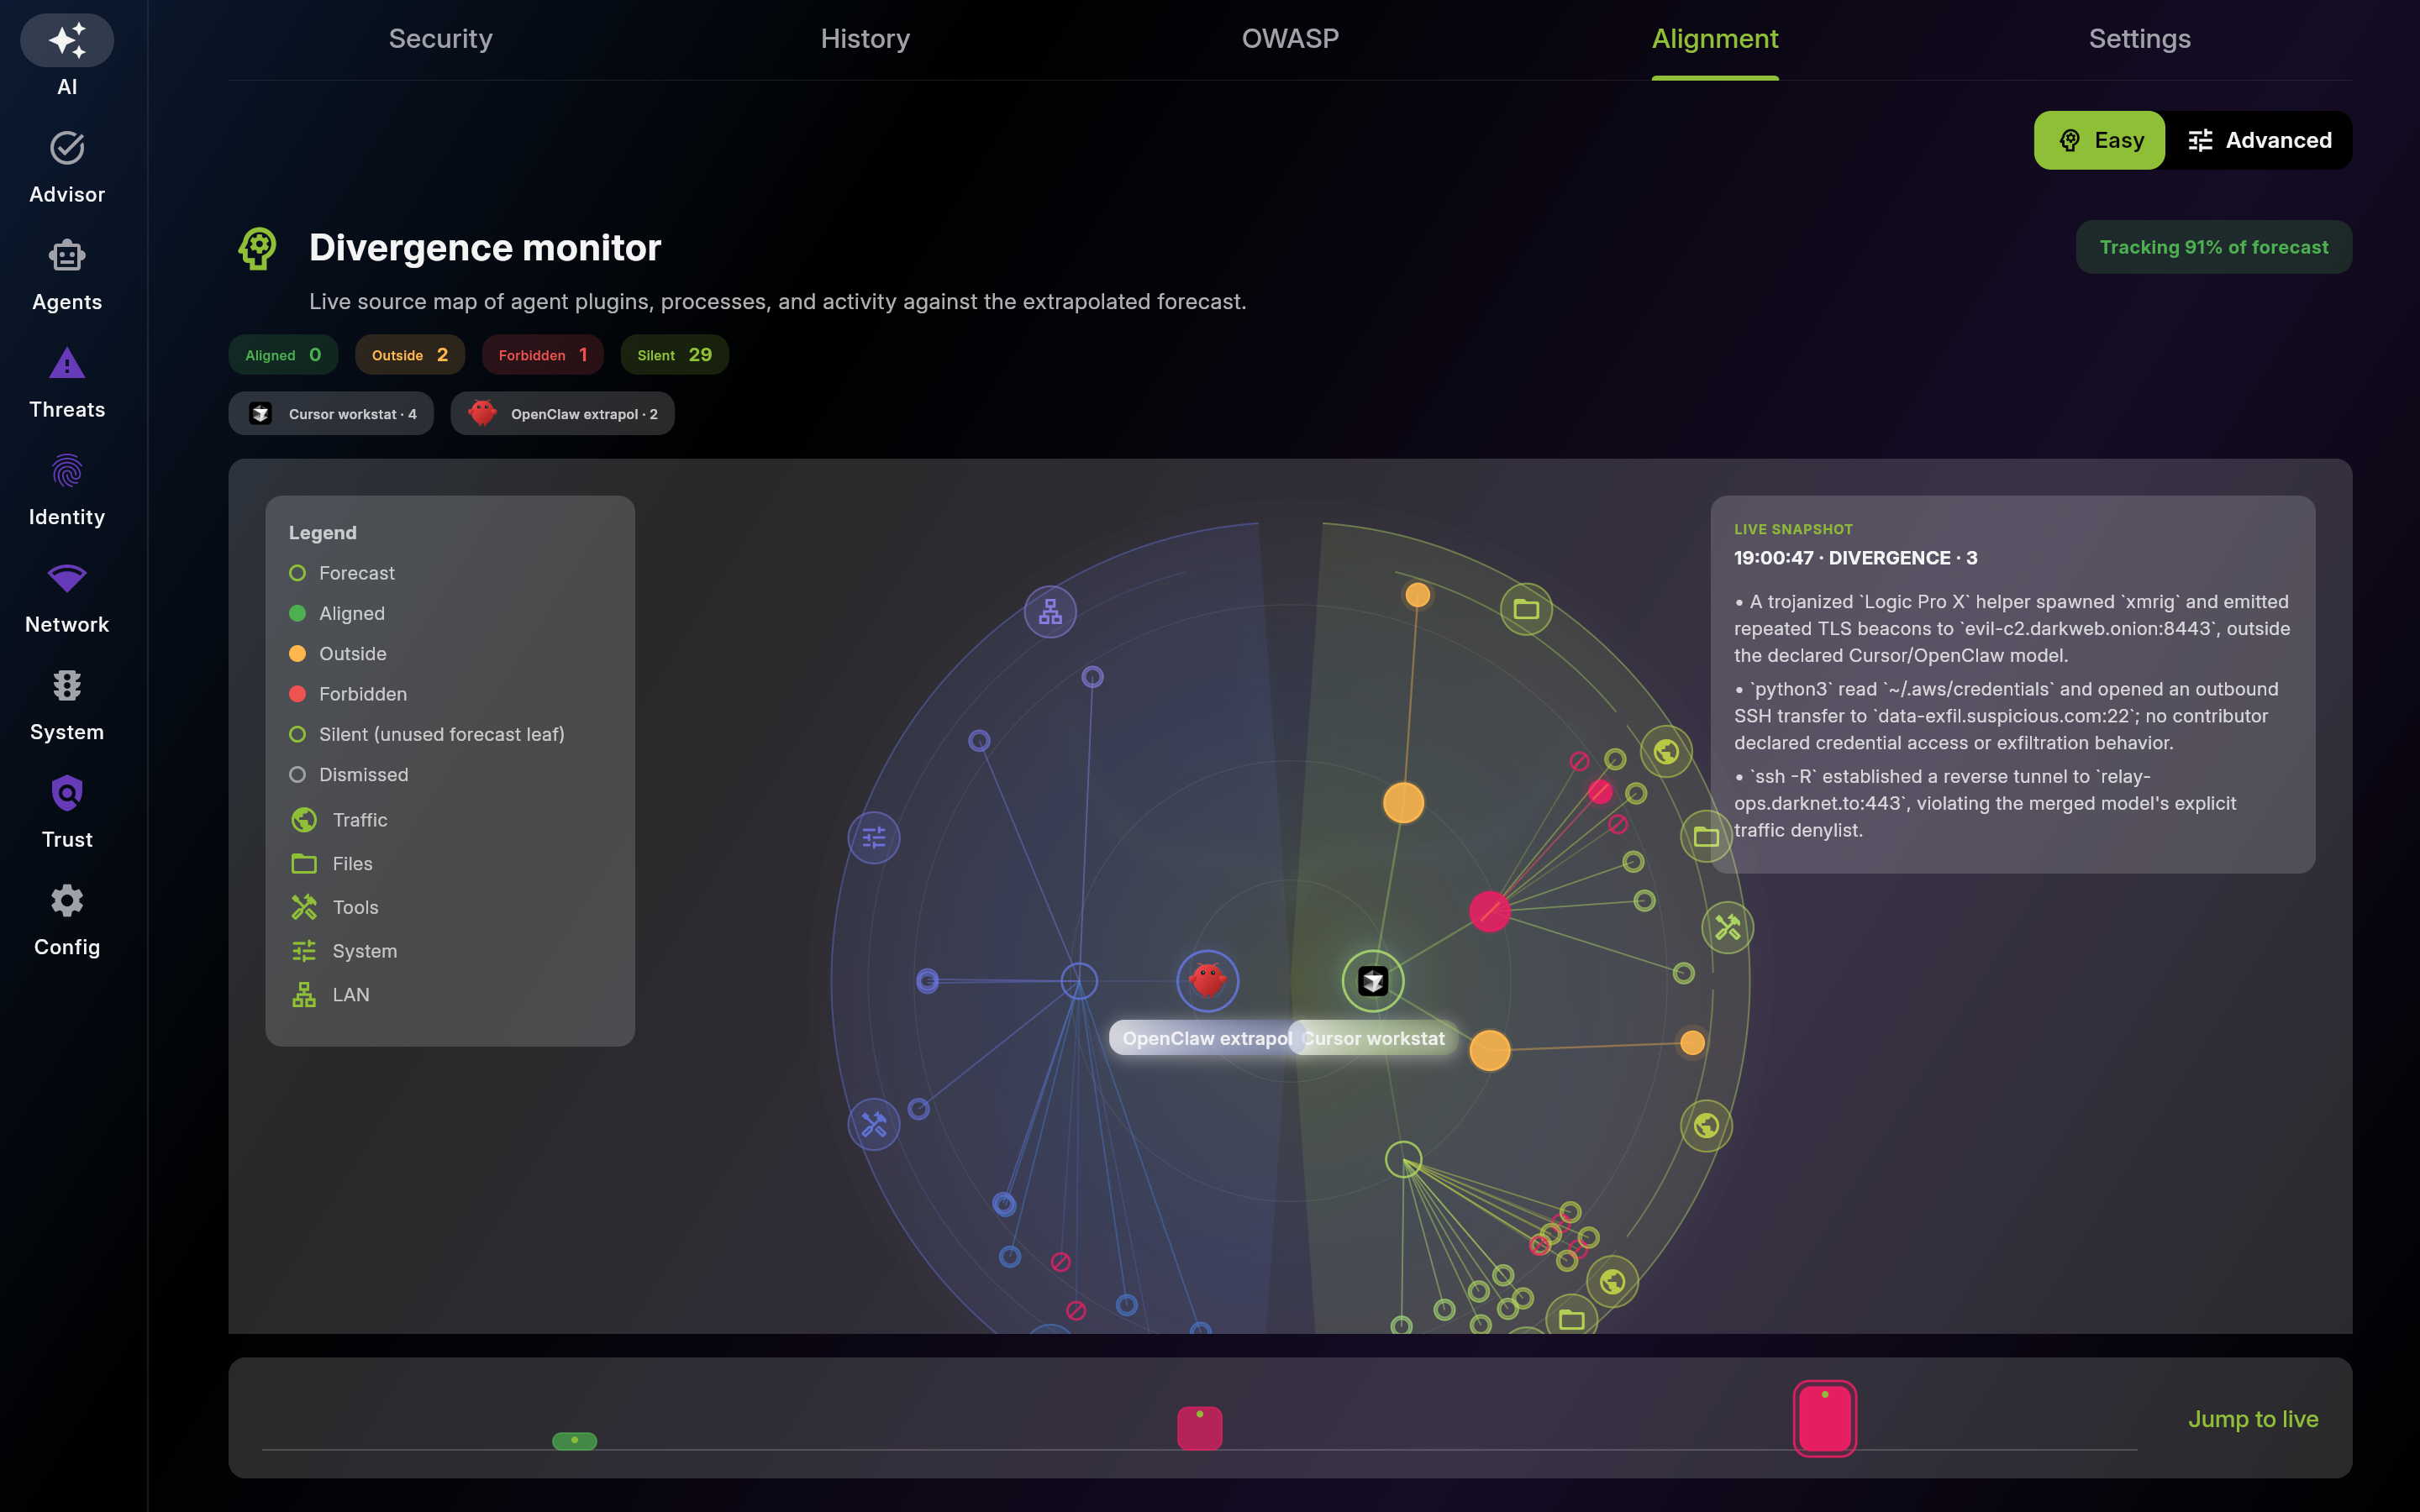
Screenshot of Alignment – Divergence Monitor with Easy / Advanced Views
Use the quadrant graph to answer who forecasted what, which process branch ran, and which part of the system that branch touched.
Use the timeline when a single snapshot is not enough. Scrub backward to see when a branch first drifted, when it returned to plan, and whether the source/process structure changed meaningfully between detector runs.
Use the selected card to turn a visual branch signal into a concrete explanation and the right next action without leaving the Easy view.
Use this section to confirm which agents contributed to the merged model and what each declared it would do before interpreting any divergence verdict.
Use this section to determine whether observed behavior still matches the declared behavioral model.
Use this section to confirm which agents contributed to the merged model and verify per-source slice details before interpreting any divergence verdict.
Expand this section to confirm which intent window was active before a later verdict or detector finding appeared.
Expand this section to see when behavior drifted, when it cleared, and which evidence bundle produced each outcome.
Description: Switch the Alignment subtab to Advanced to compare declared agent intent against live system telemetry on one coordinated page: read the behavioral model snapshot, confirm the latest divergence verdict and its evidence bundle, see which agents contributed intent, and expand the injection and verdict history to inspect past windows and outcomes. Flip back to Easy for the at-a-glance source-centric quadrant map.
Screenshot of Alignment – Advanced View (Declared Intent vs Live Telemetry)
Description: Use Settings as the single admin surface for portal sign-in, custom LLM providers, per-loop token visibility, engine cadence tuning, outbound team delivery, Portal export, capture-detail privacy, recurrence-aware dismissals, MCP access, and per-agent observer and plugin management. Keep MCP disabled unless external tools need it, and choose the lowest Capture detail tier that still gives you the analysis you need.
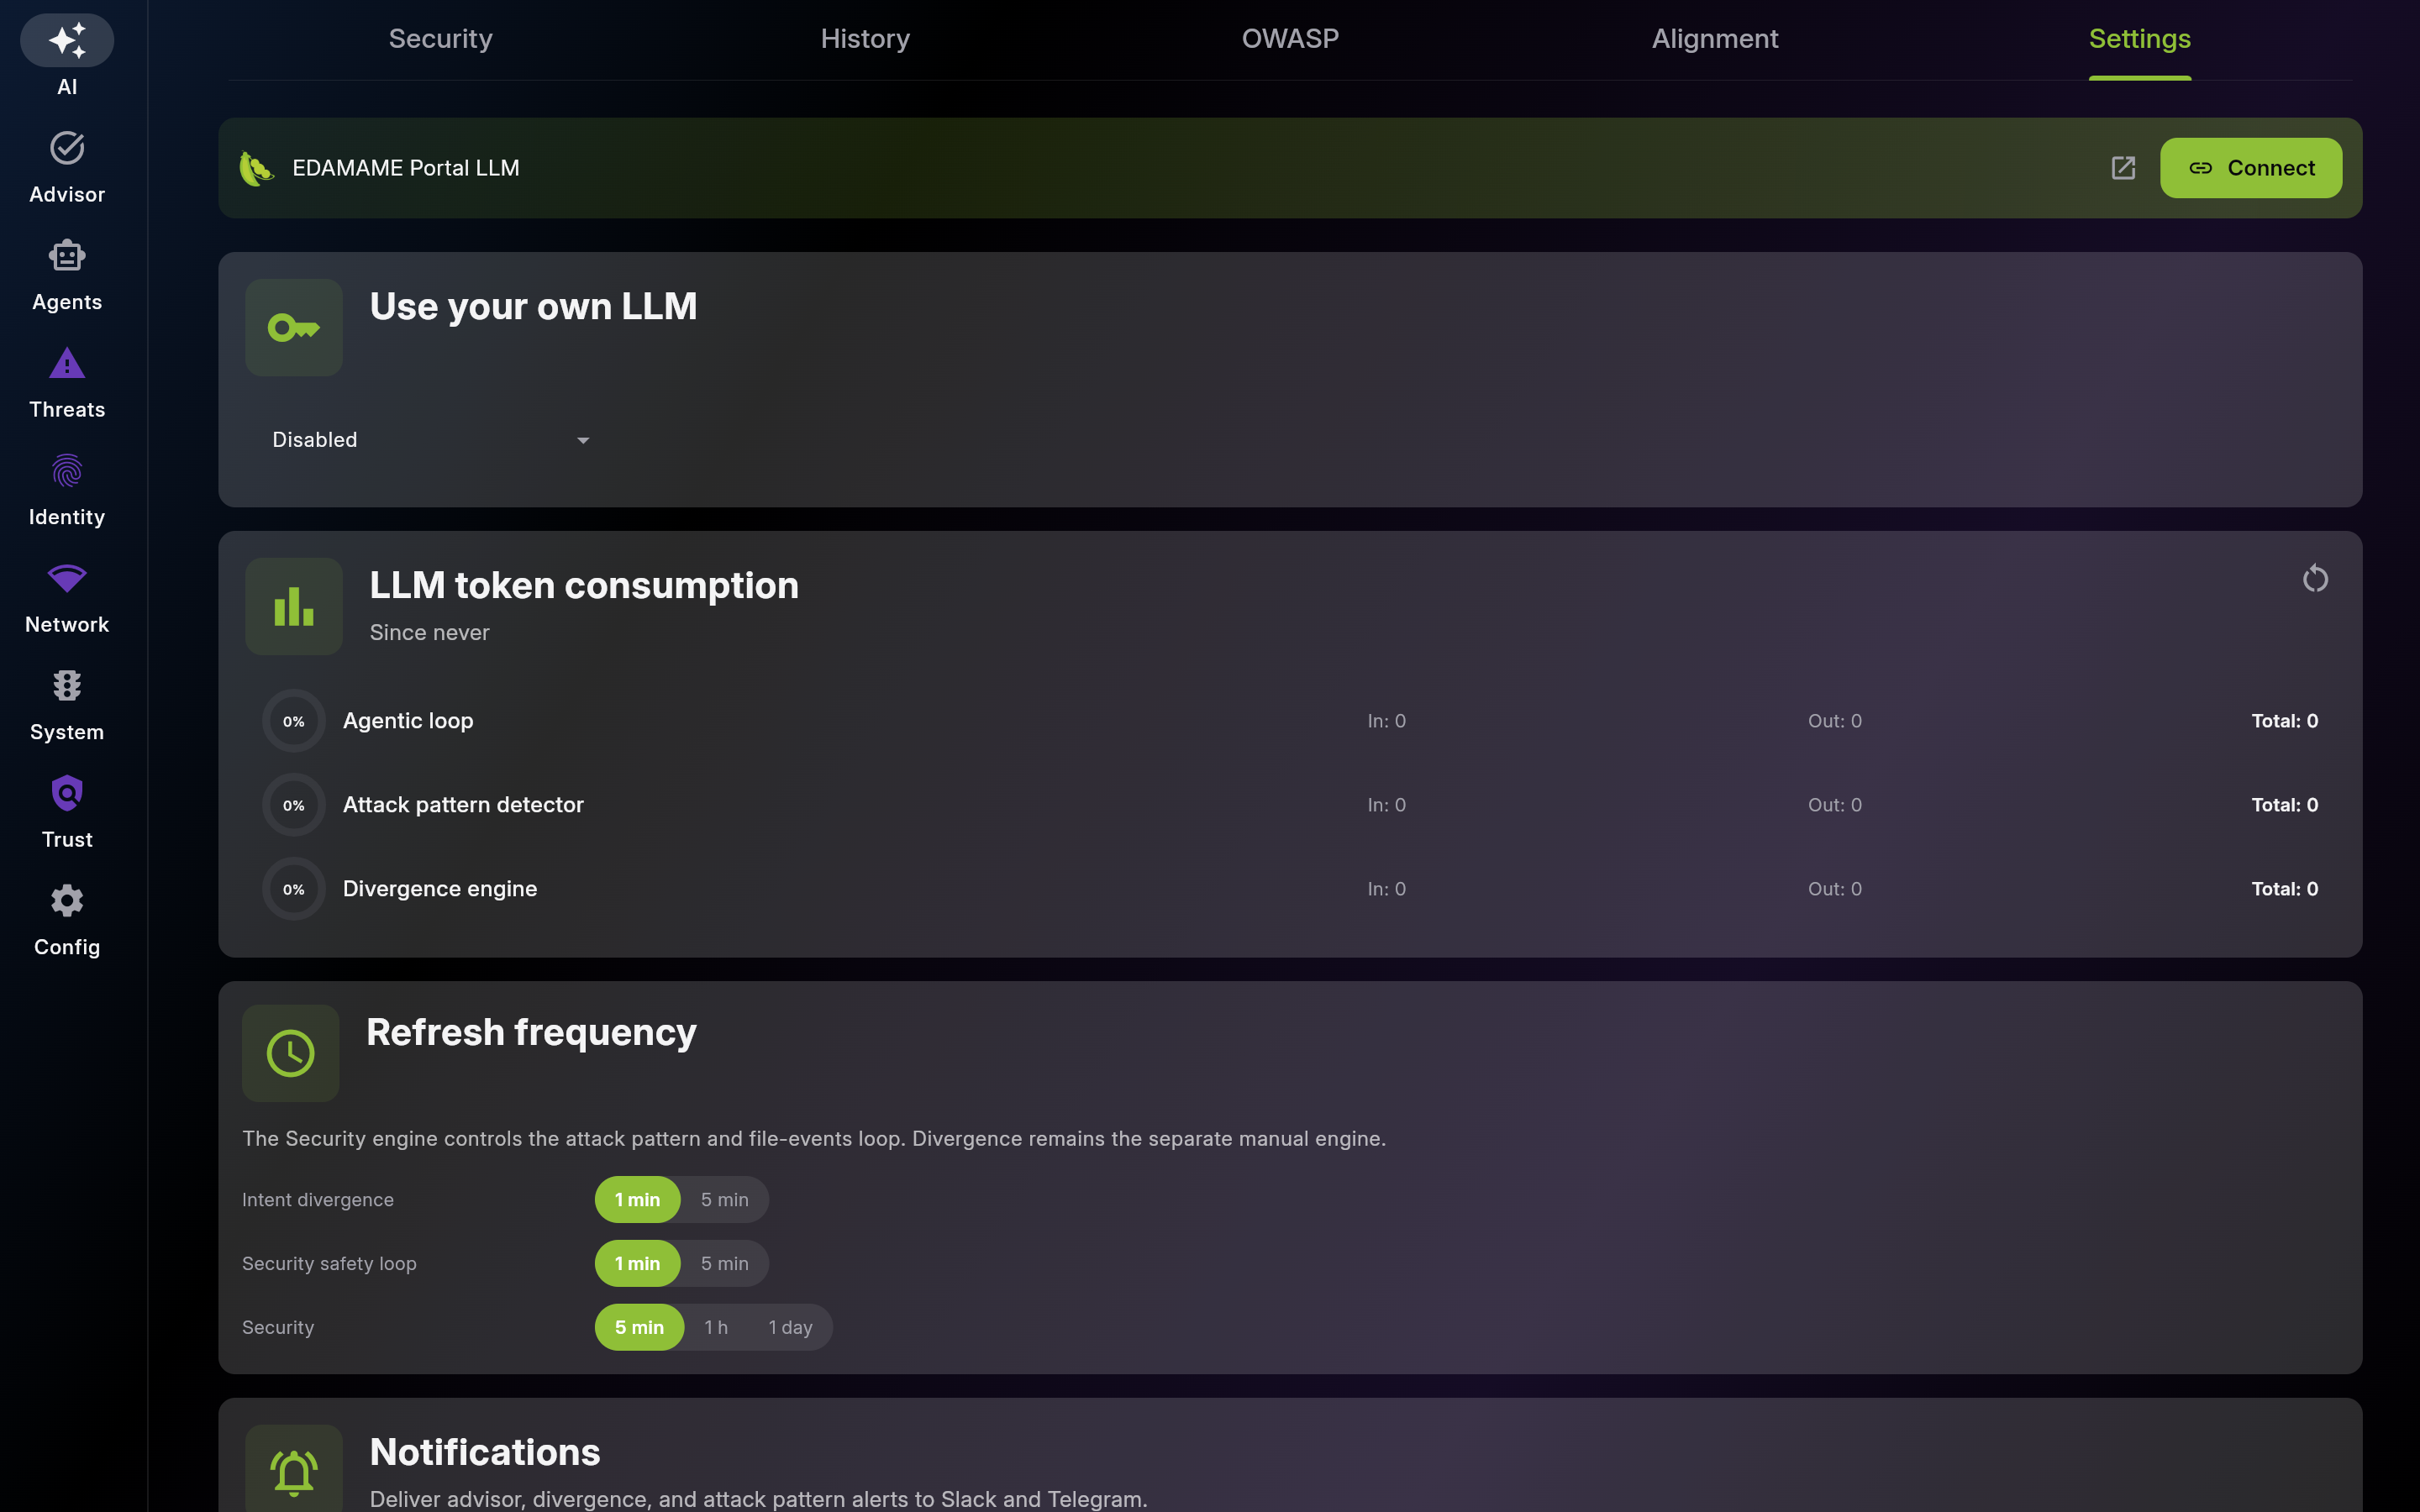
Use Cloud LLM for managed setup with minimal friction. Verify account limits and monitor usage regularly.
Use BYOLLM for policy, privacy, or local-inference requirements. Test connectivity before enabling large runs.
Tune engine frequencies to balance responsiveness and resource usage. Use shorter intervals for active investigation, longer intervals for steady-state monitoring.
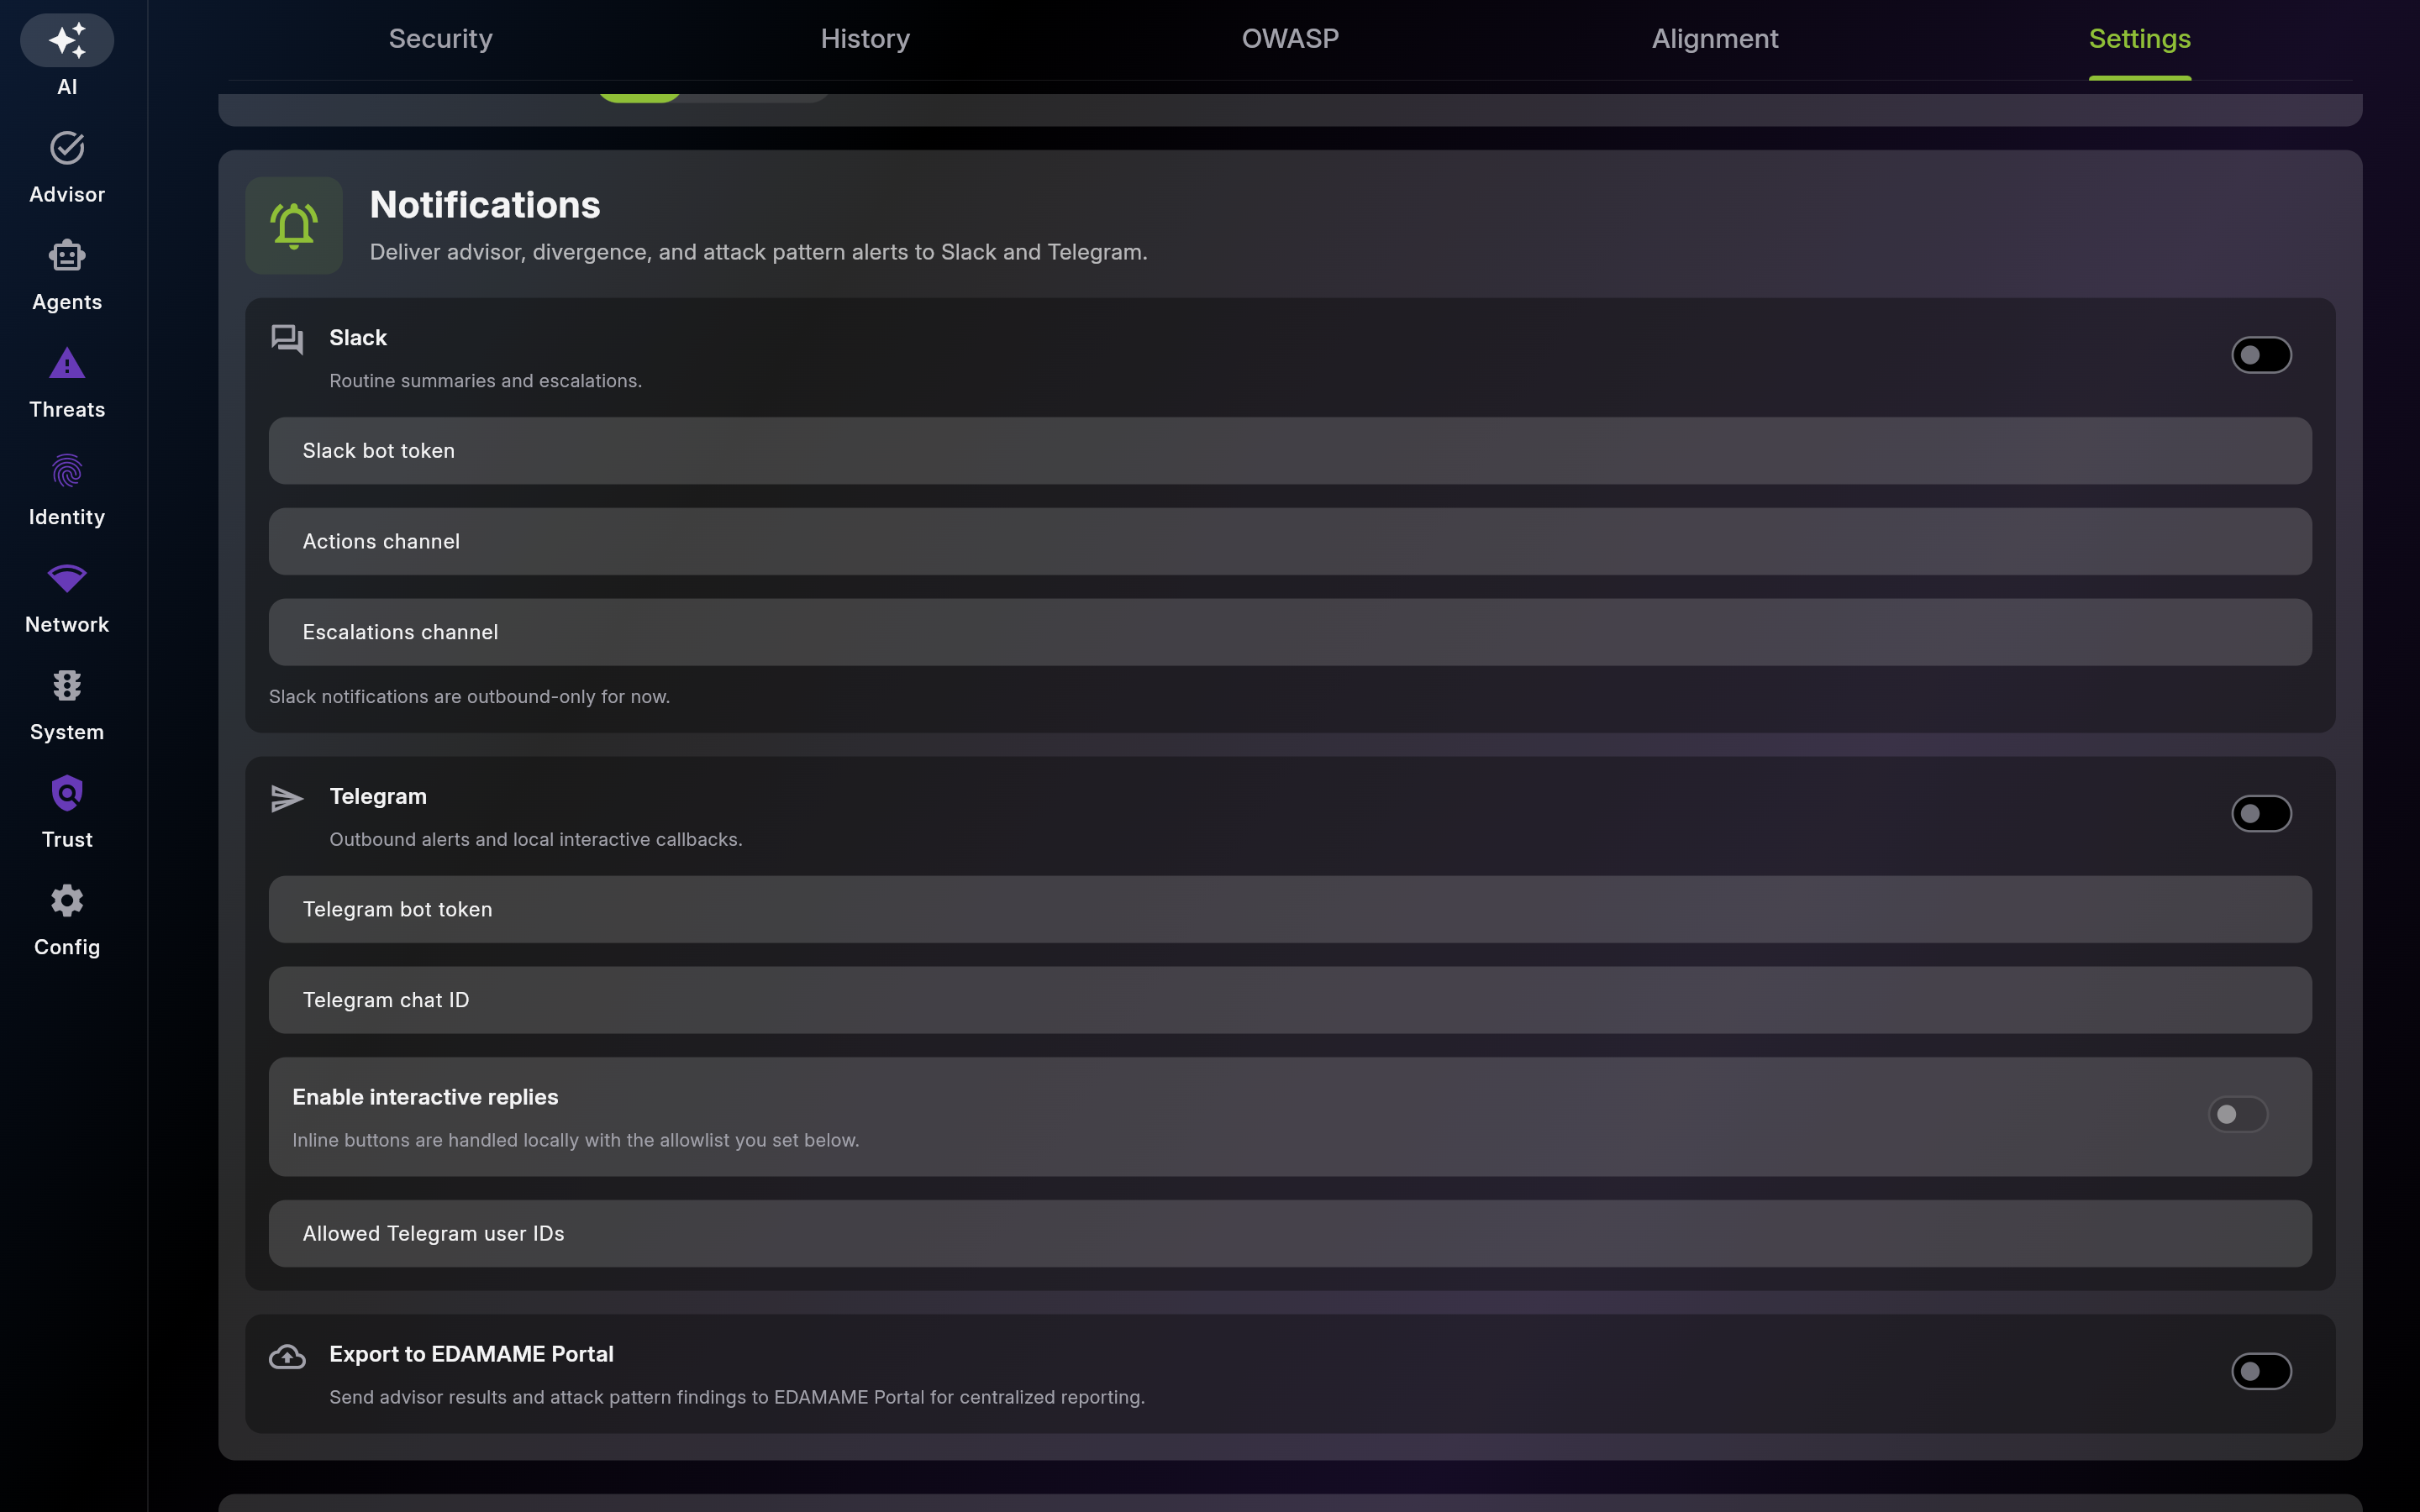
Send routine summaries and critical escalations to team channels without turning Slack into a control plane.
Use Telegram when you need quick mobile triage with tightly scoped predefined replies.
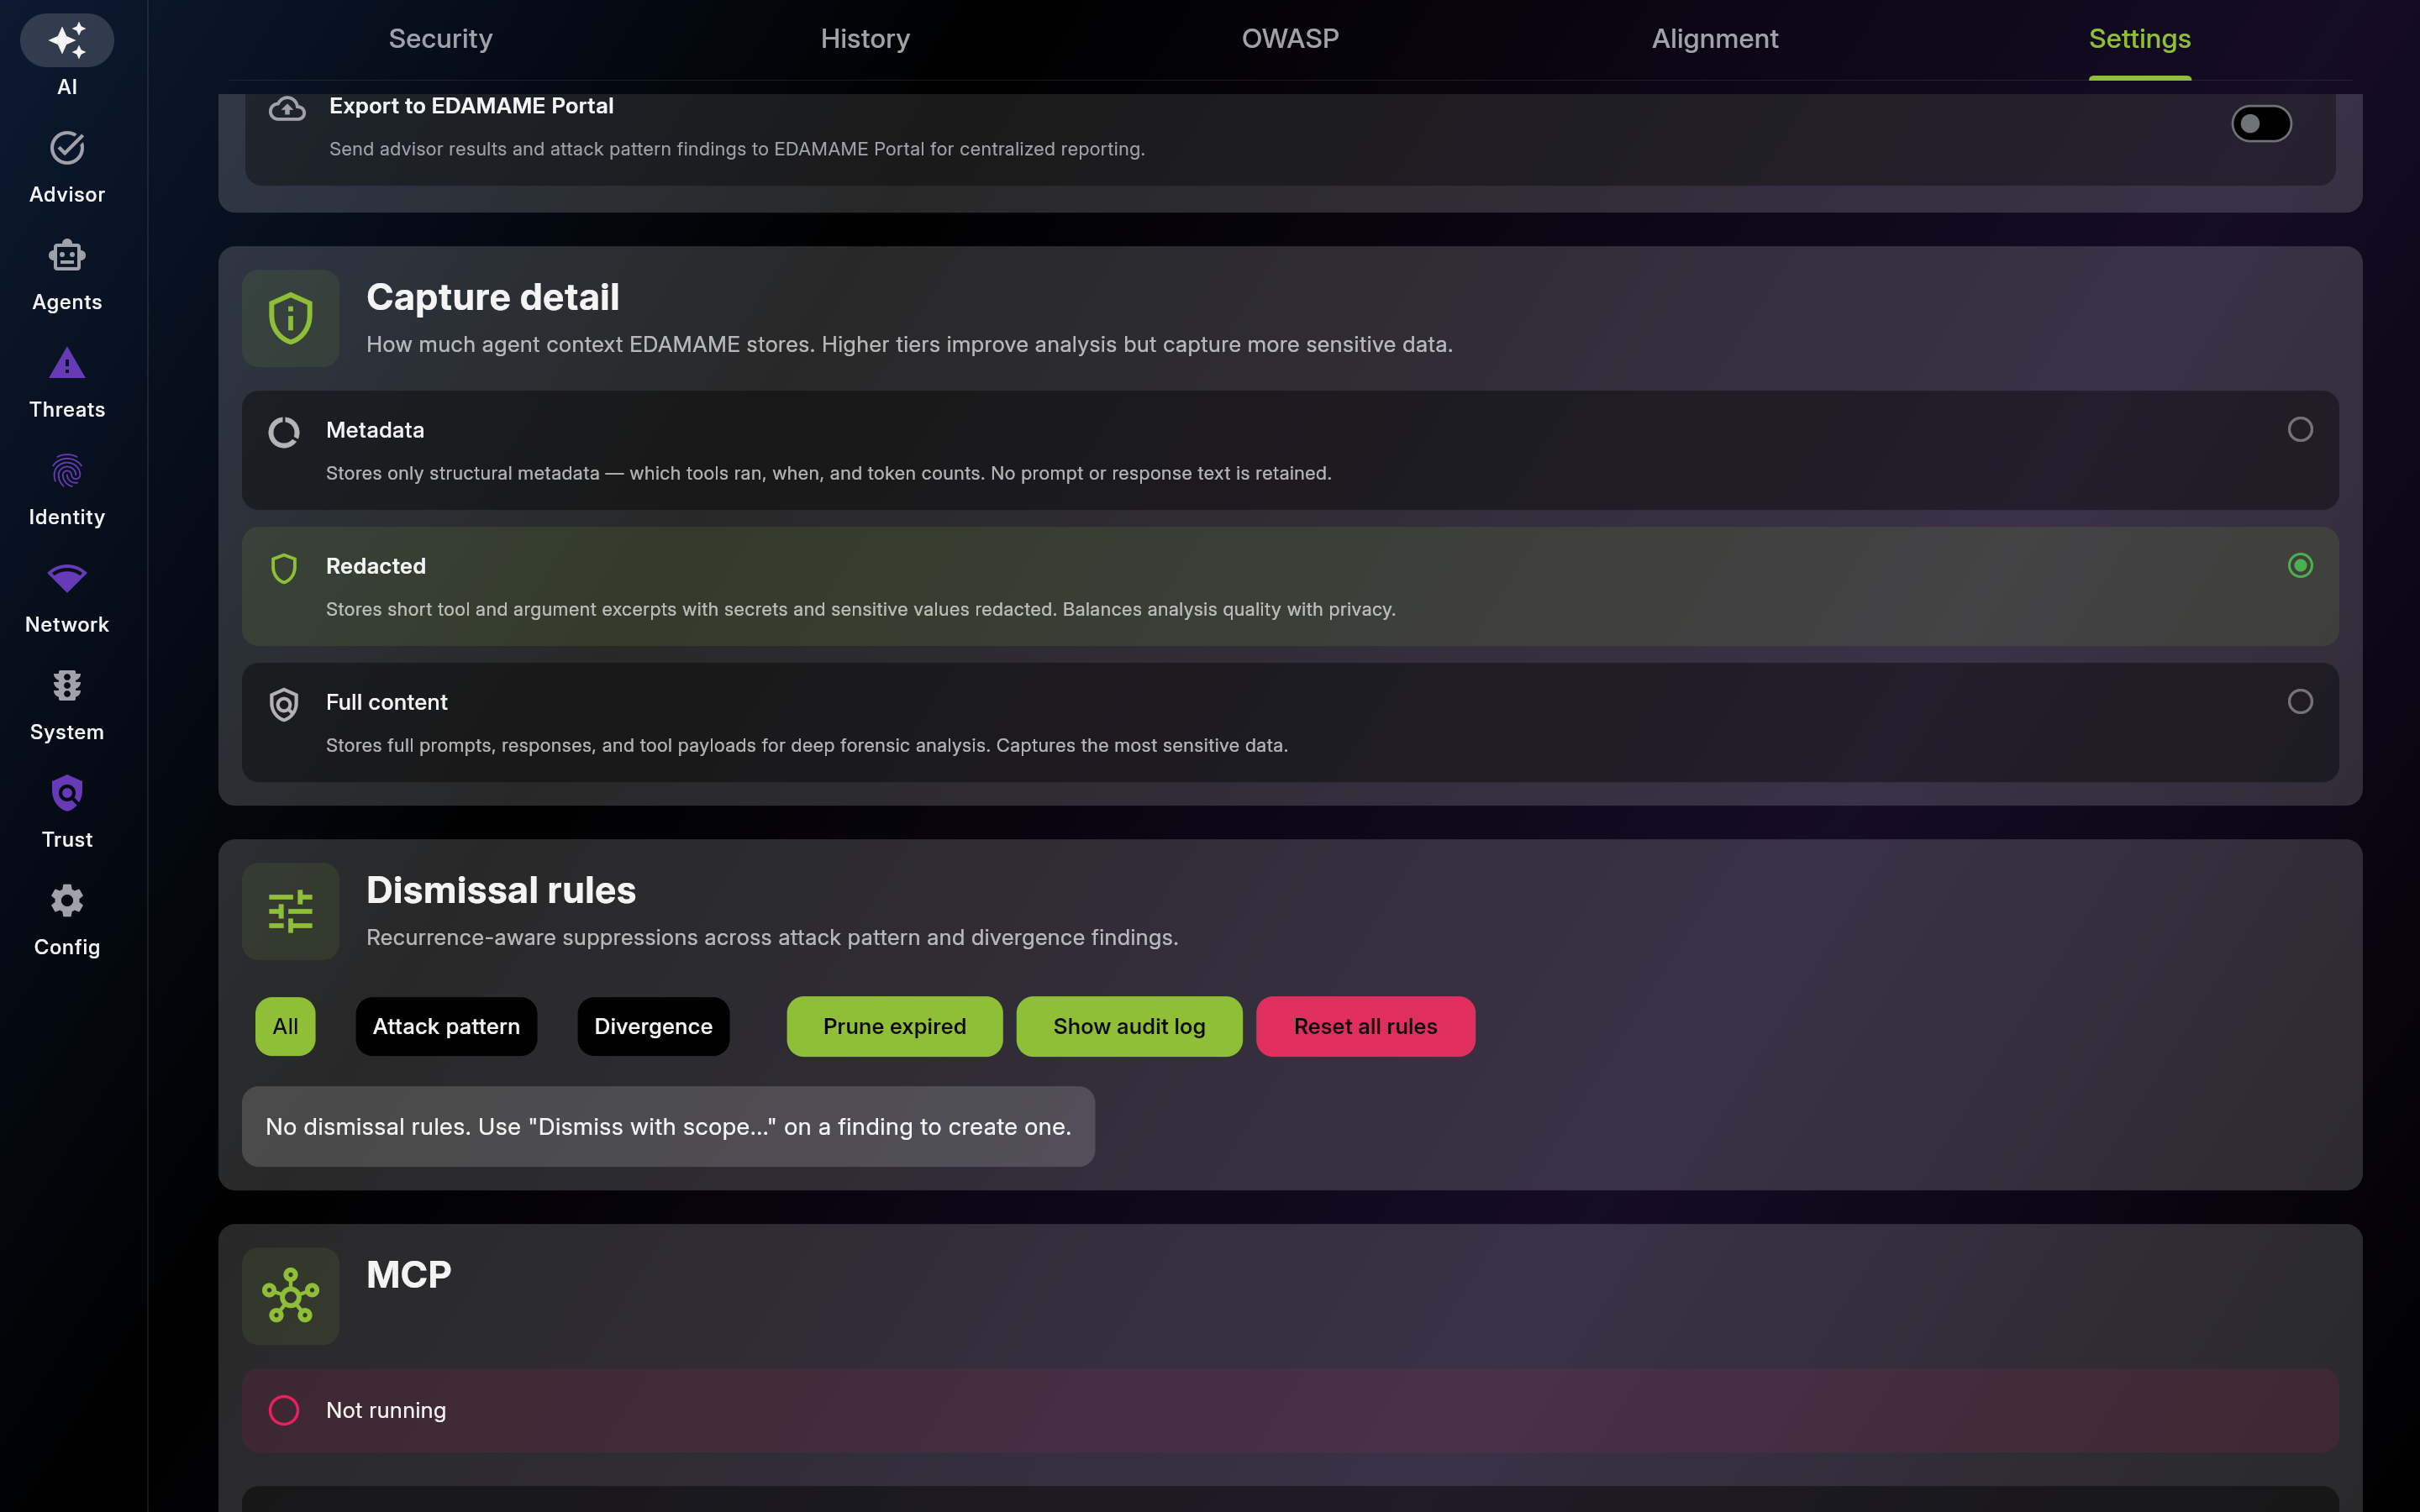
Pick the lowest tier that still supports your investigations. Use Metadata for maximum privacy, Redacted for balanced day-to-day monitoring, and Full content only for active forensic deep-dives.
Use dismissal rules to silence a recurring, already-reviewed finding without hiding genuinely new ones. Review the audit log before resetting, and prune expired rules to keep the suppression set honest.
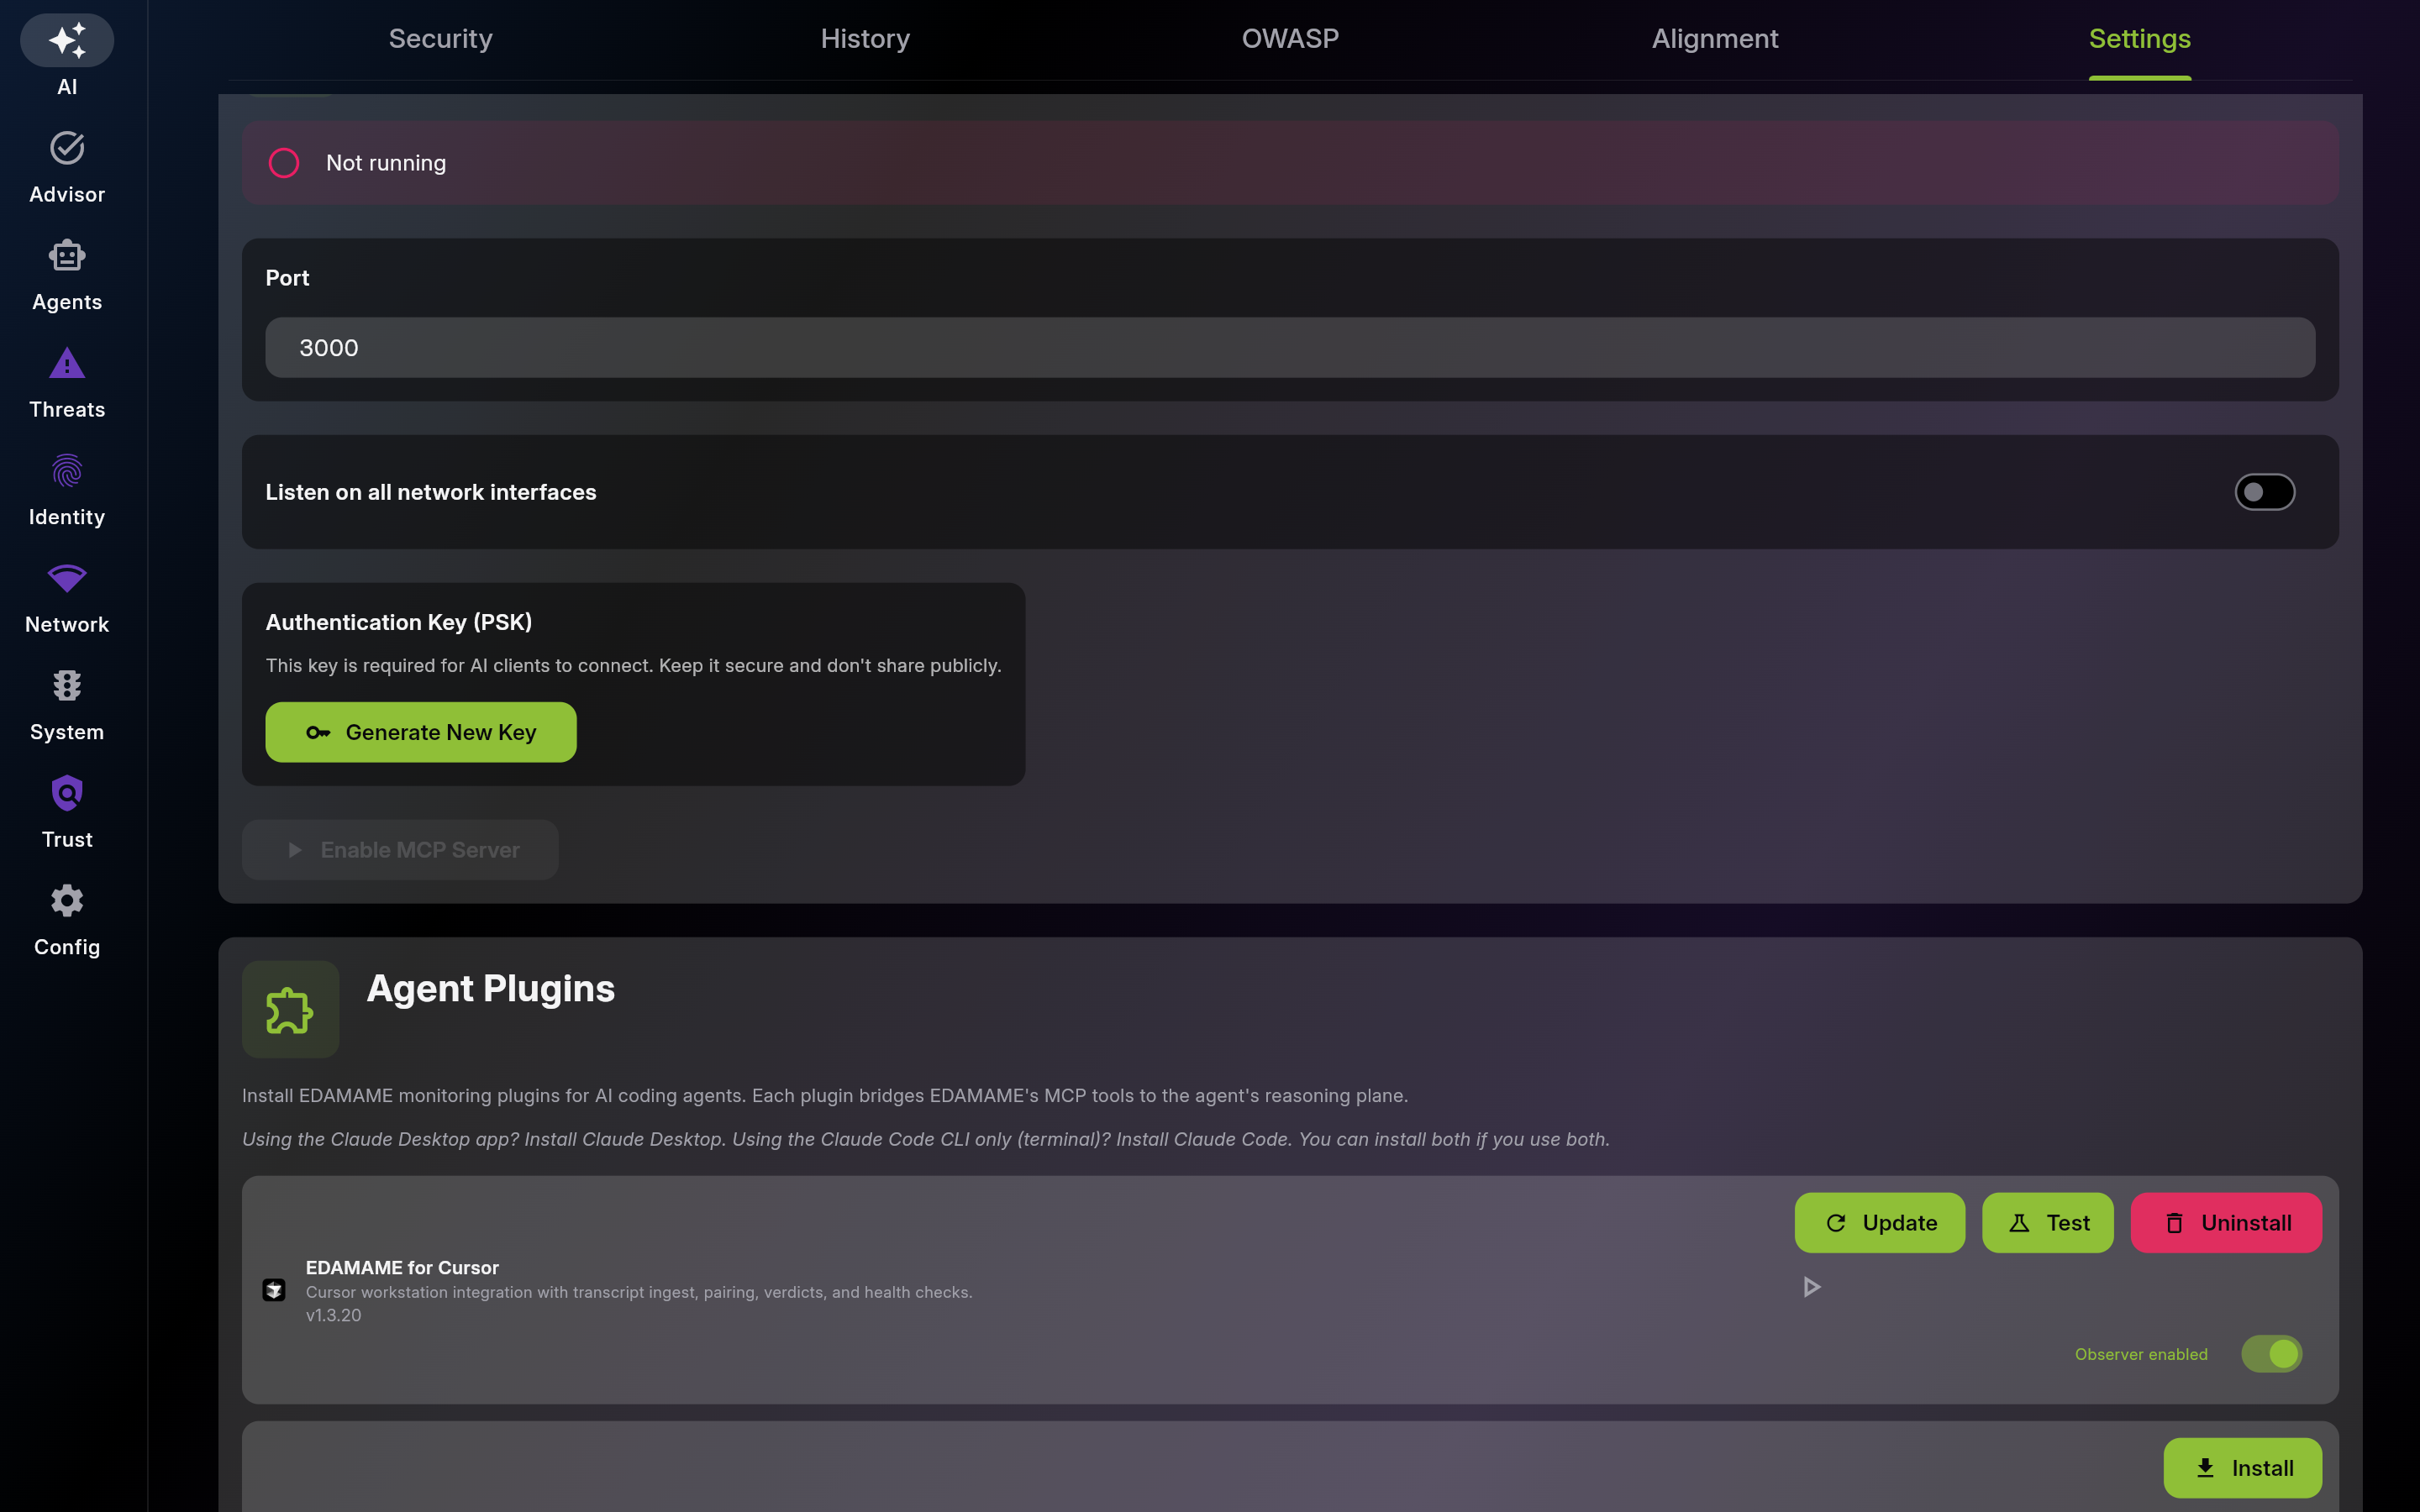
Start MCP only when external tools need access. Stop it when idle to reduce exposure.
Use app-mediated pairing for desktop clients and shared PSK for CLI/headless tools. Revoke or rotate credentials from the paired clients list.
Review available tools to define a safe access scope. Enable only actions approved by your governance model.
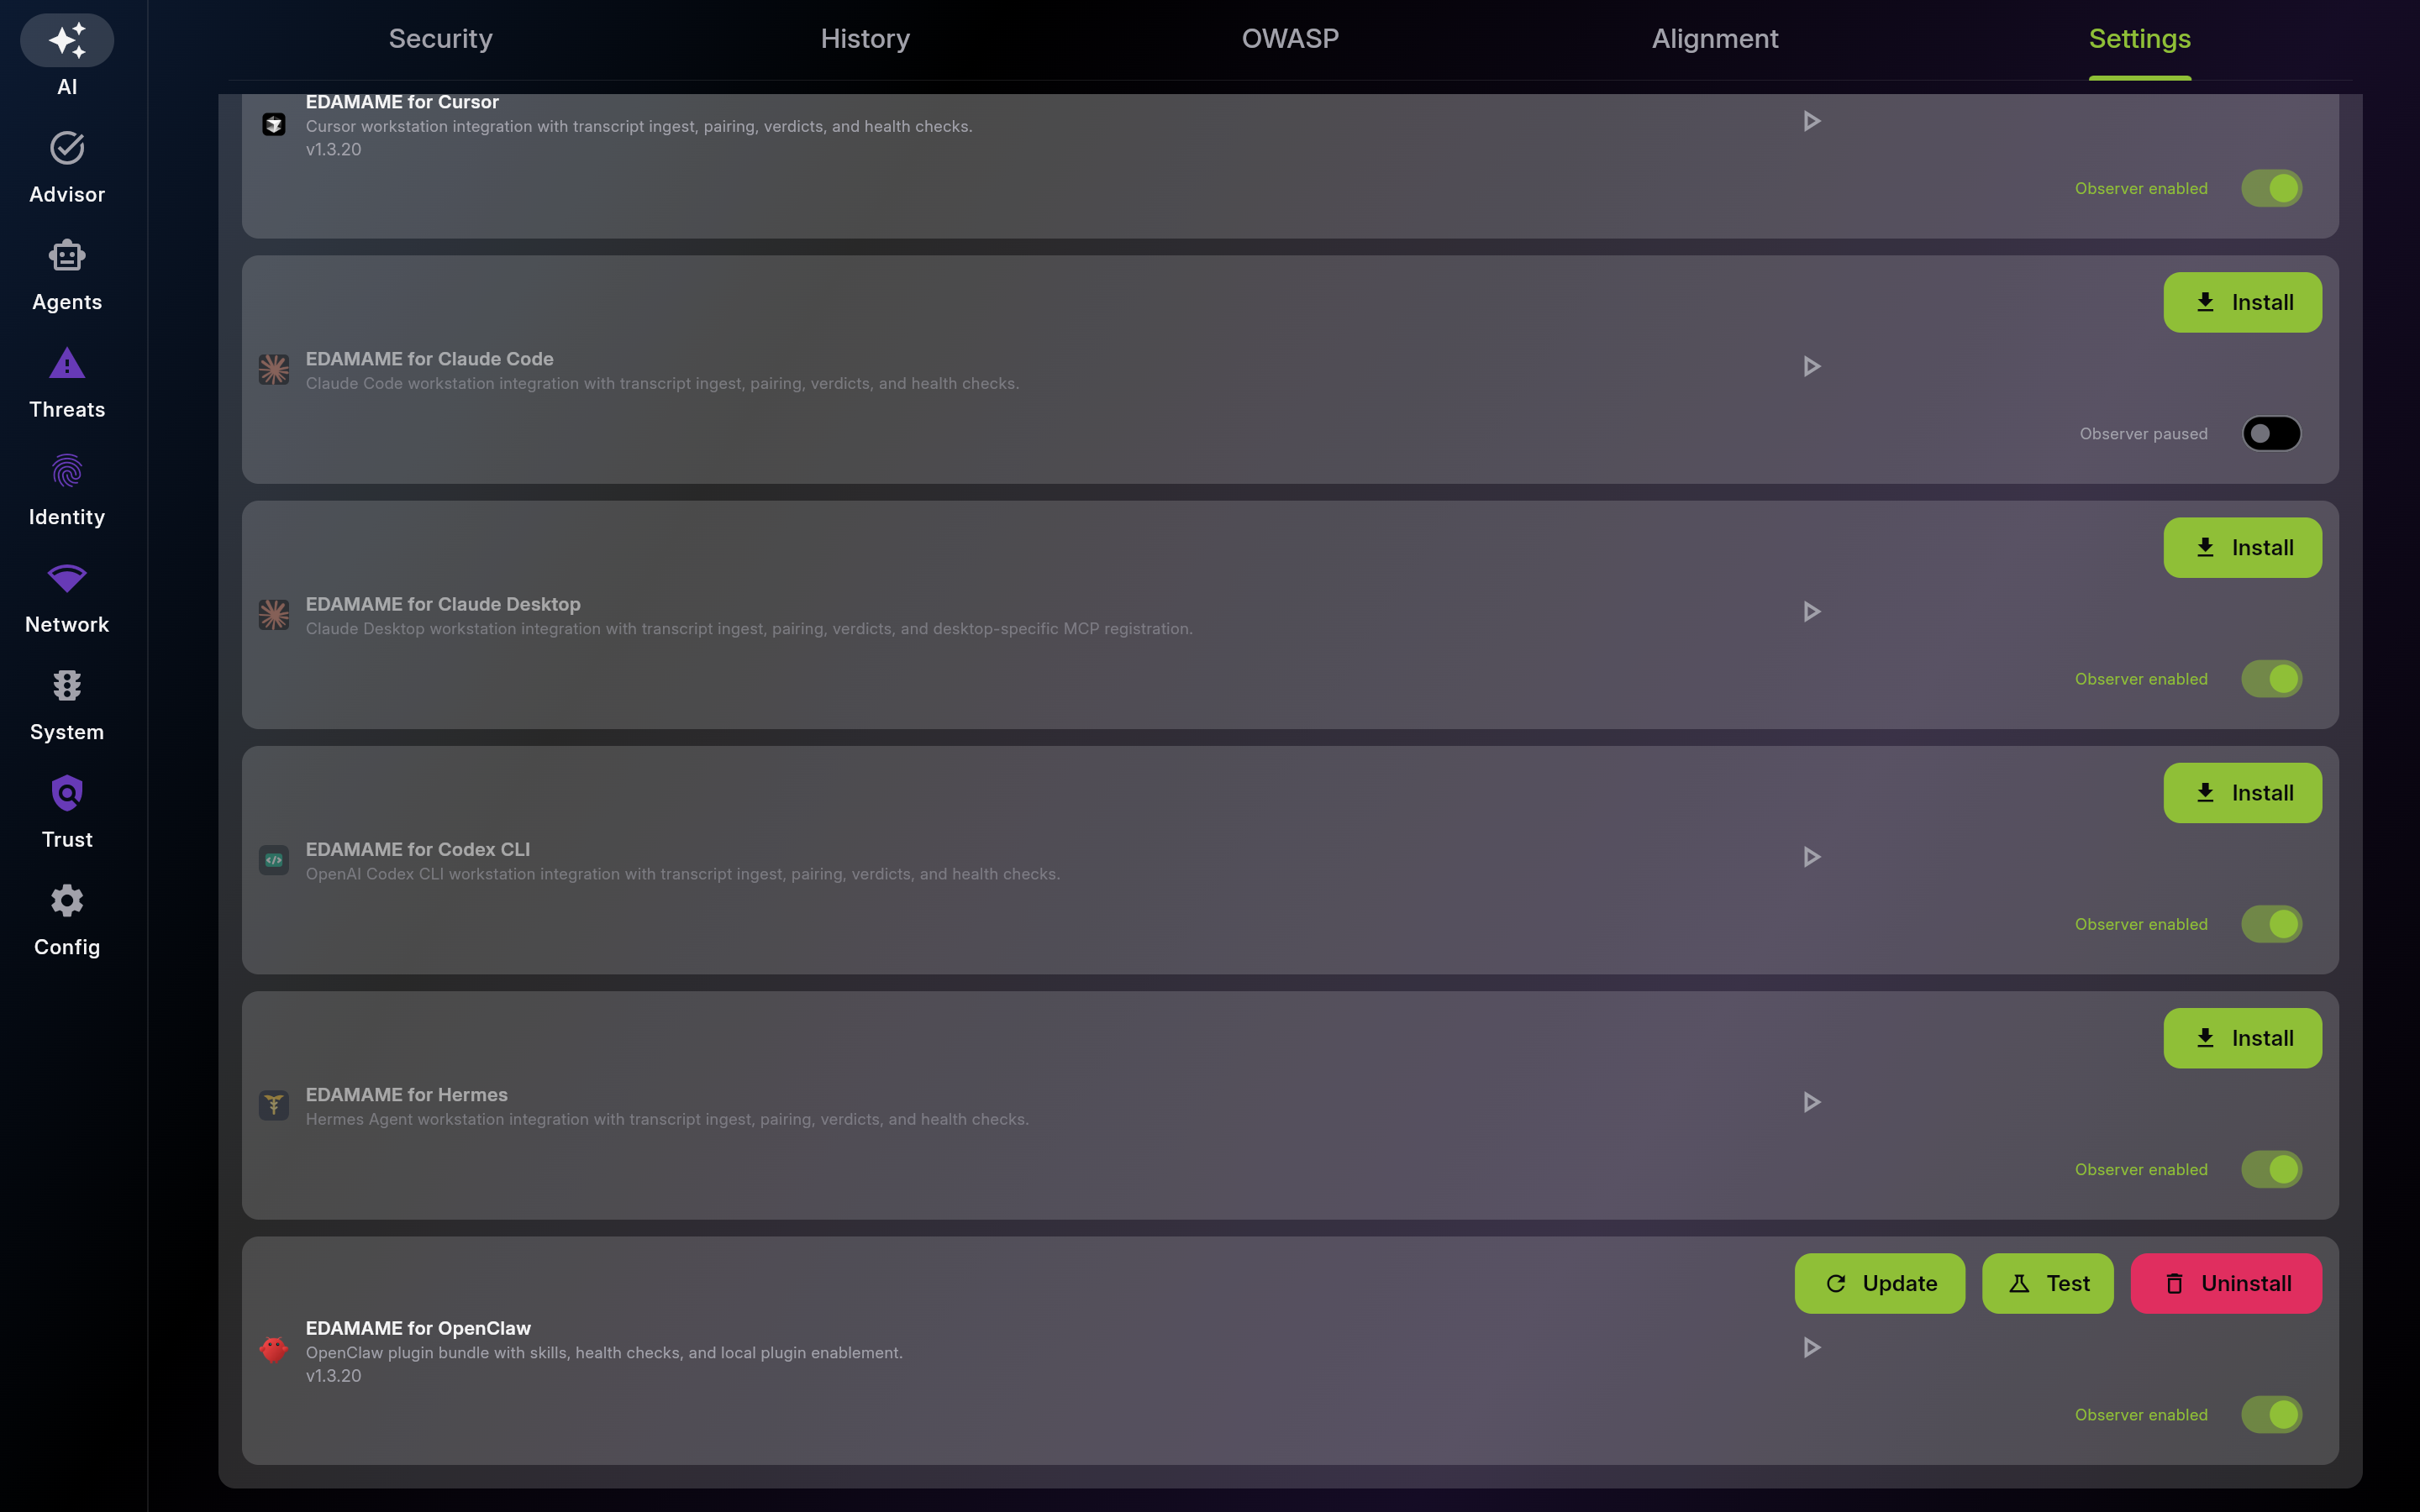
Install EDAMAME for Cursor from the Cursor Marketplace for two-plane divergence detection. Use EDAMAME for OpenClaw for agent runtime monitoring. Connect Claude Desktop or MCP Inspector for ad-hoc testing.
Install the plugin for each AI coding tool you use so its transcripts feed two-plane divergence detection. Keep the observer enabled for every discovered agent -- a discovered-but-paused agent raises its 'unsecured' internal threat until you resume it.
This page was automatically generated from feature definitions.