feature config
- 🔐 Config
Overview Use Config to verify runtime status, permissions, alerts, and diagnostics. Check helper/elevation readiness, tune notification noise, and consult debug tools when troubleshooting.
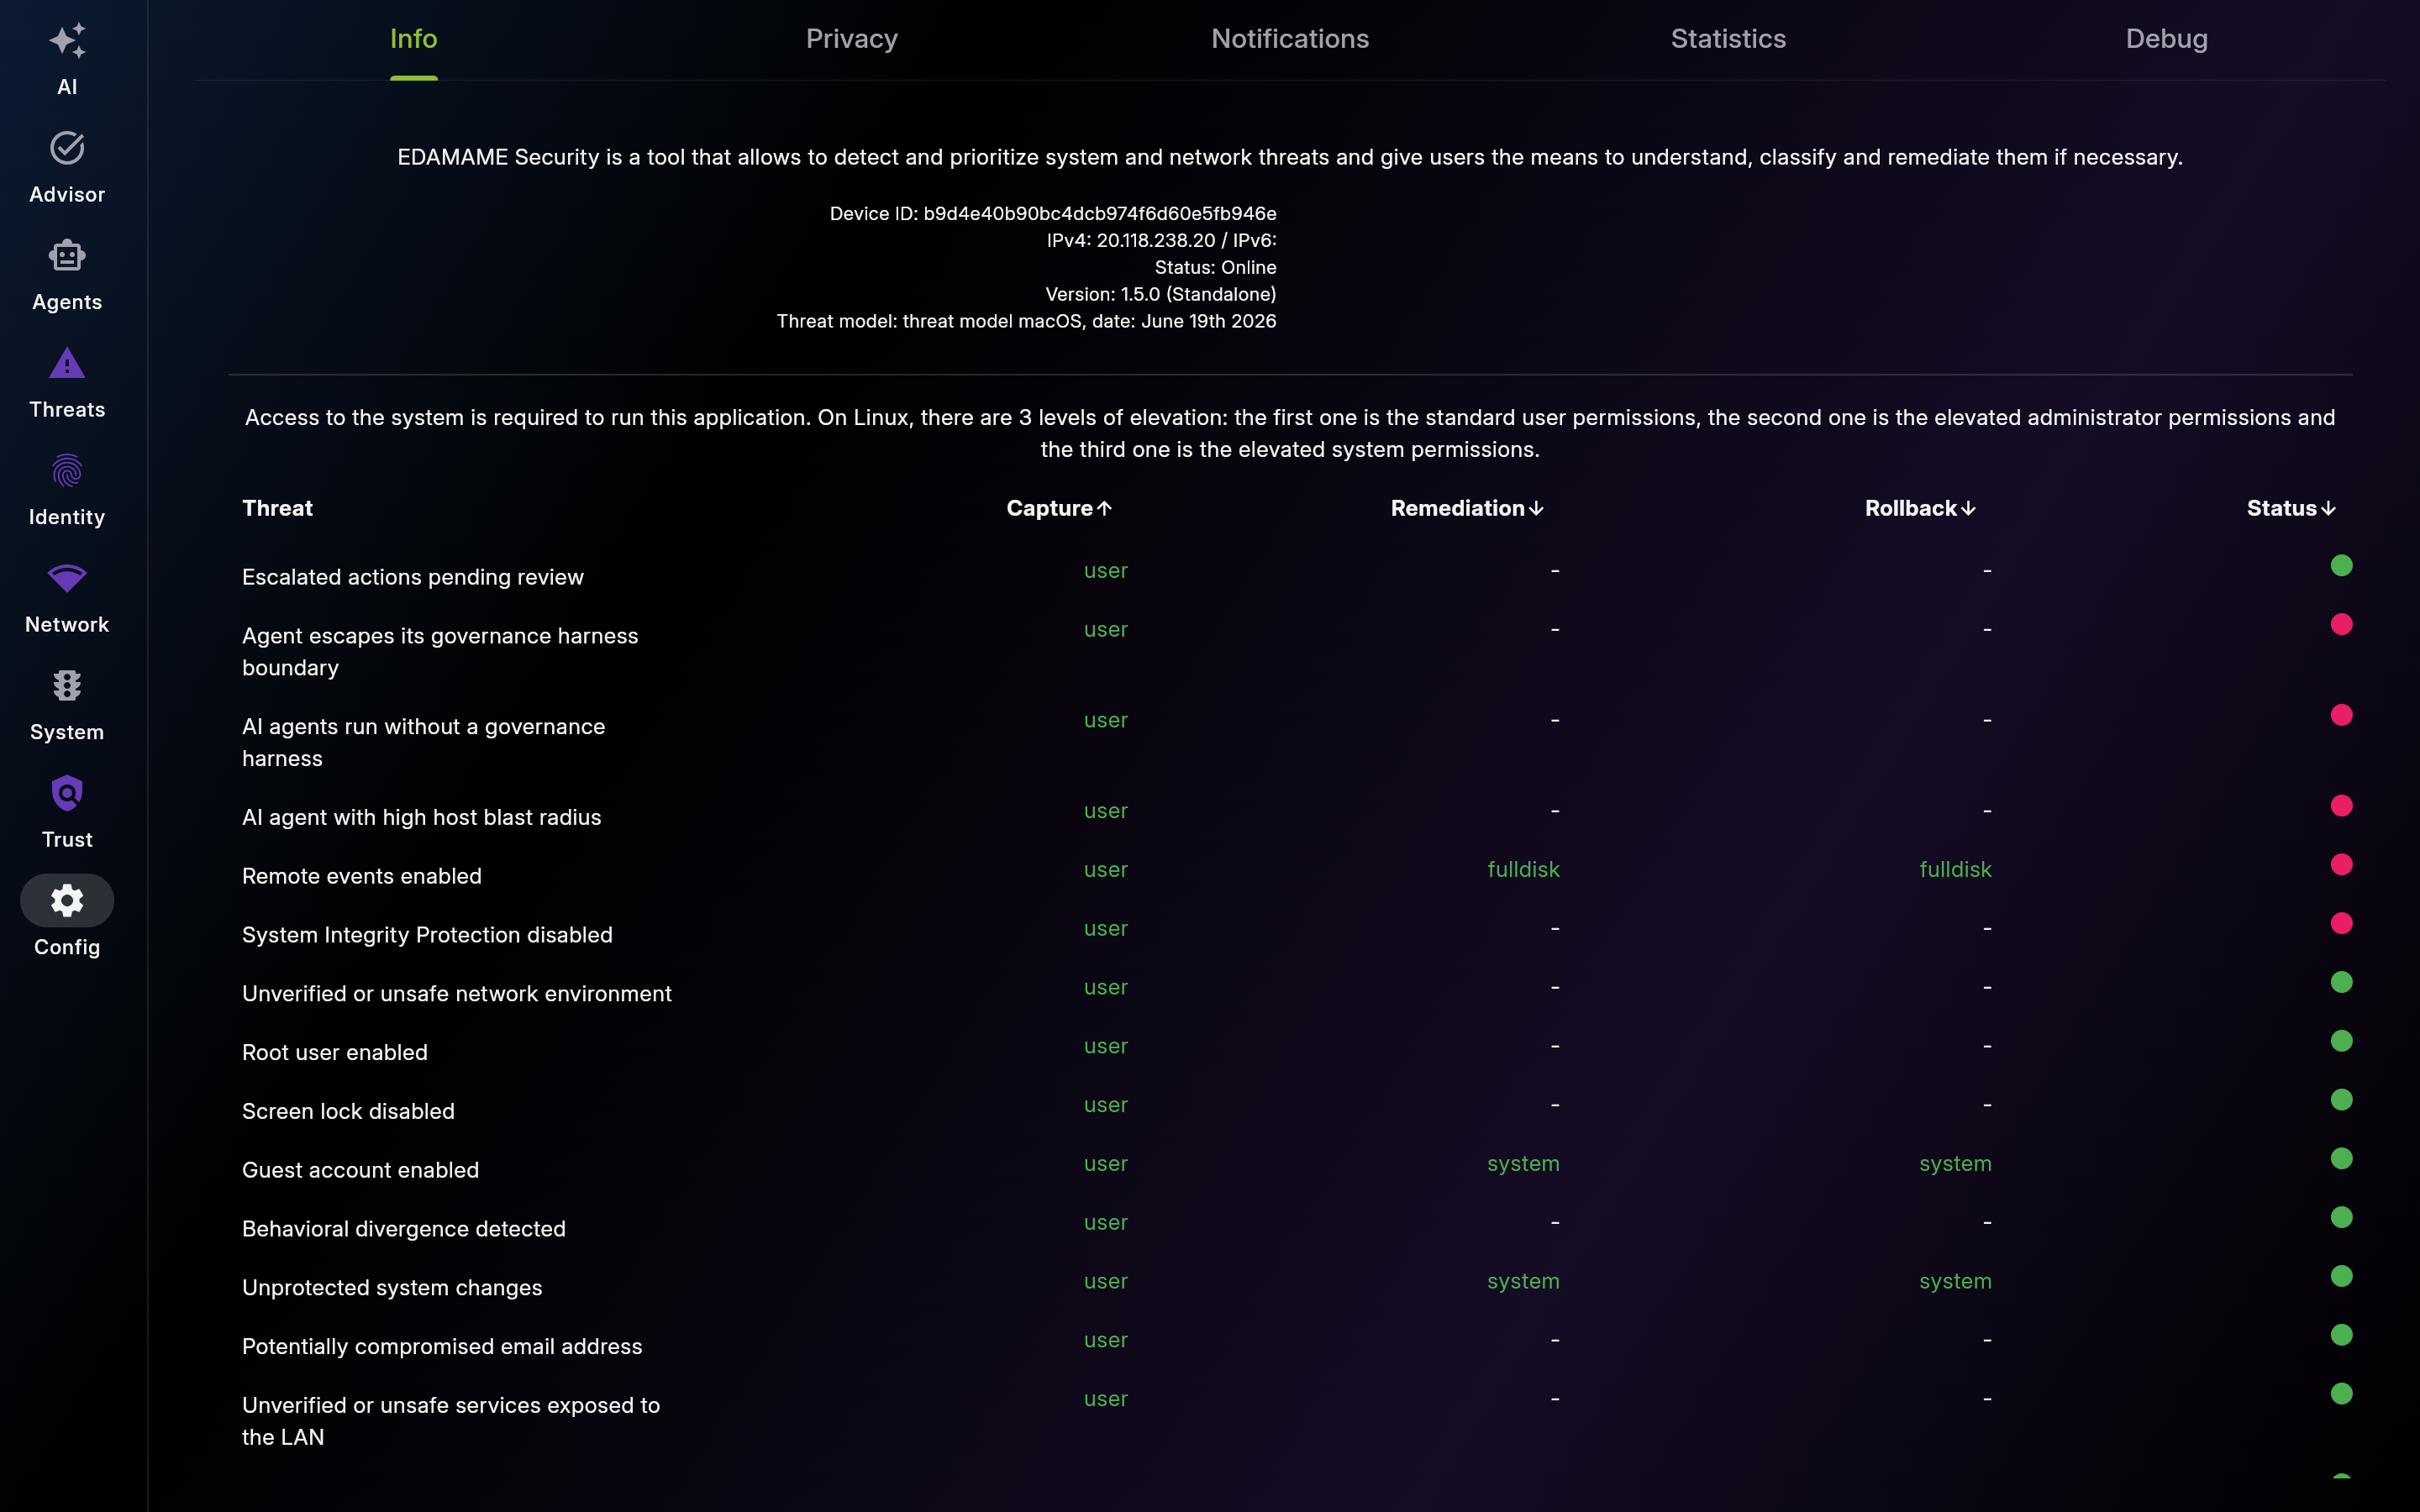
Description: Use Info to confirm environment readiness before deeper troubleshooting. Check version/build metadata and privilege requirements.
| List View | Detail View |
|---|---|
 |
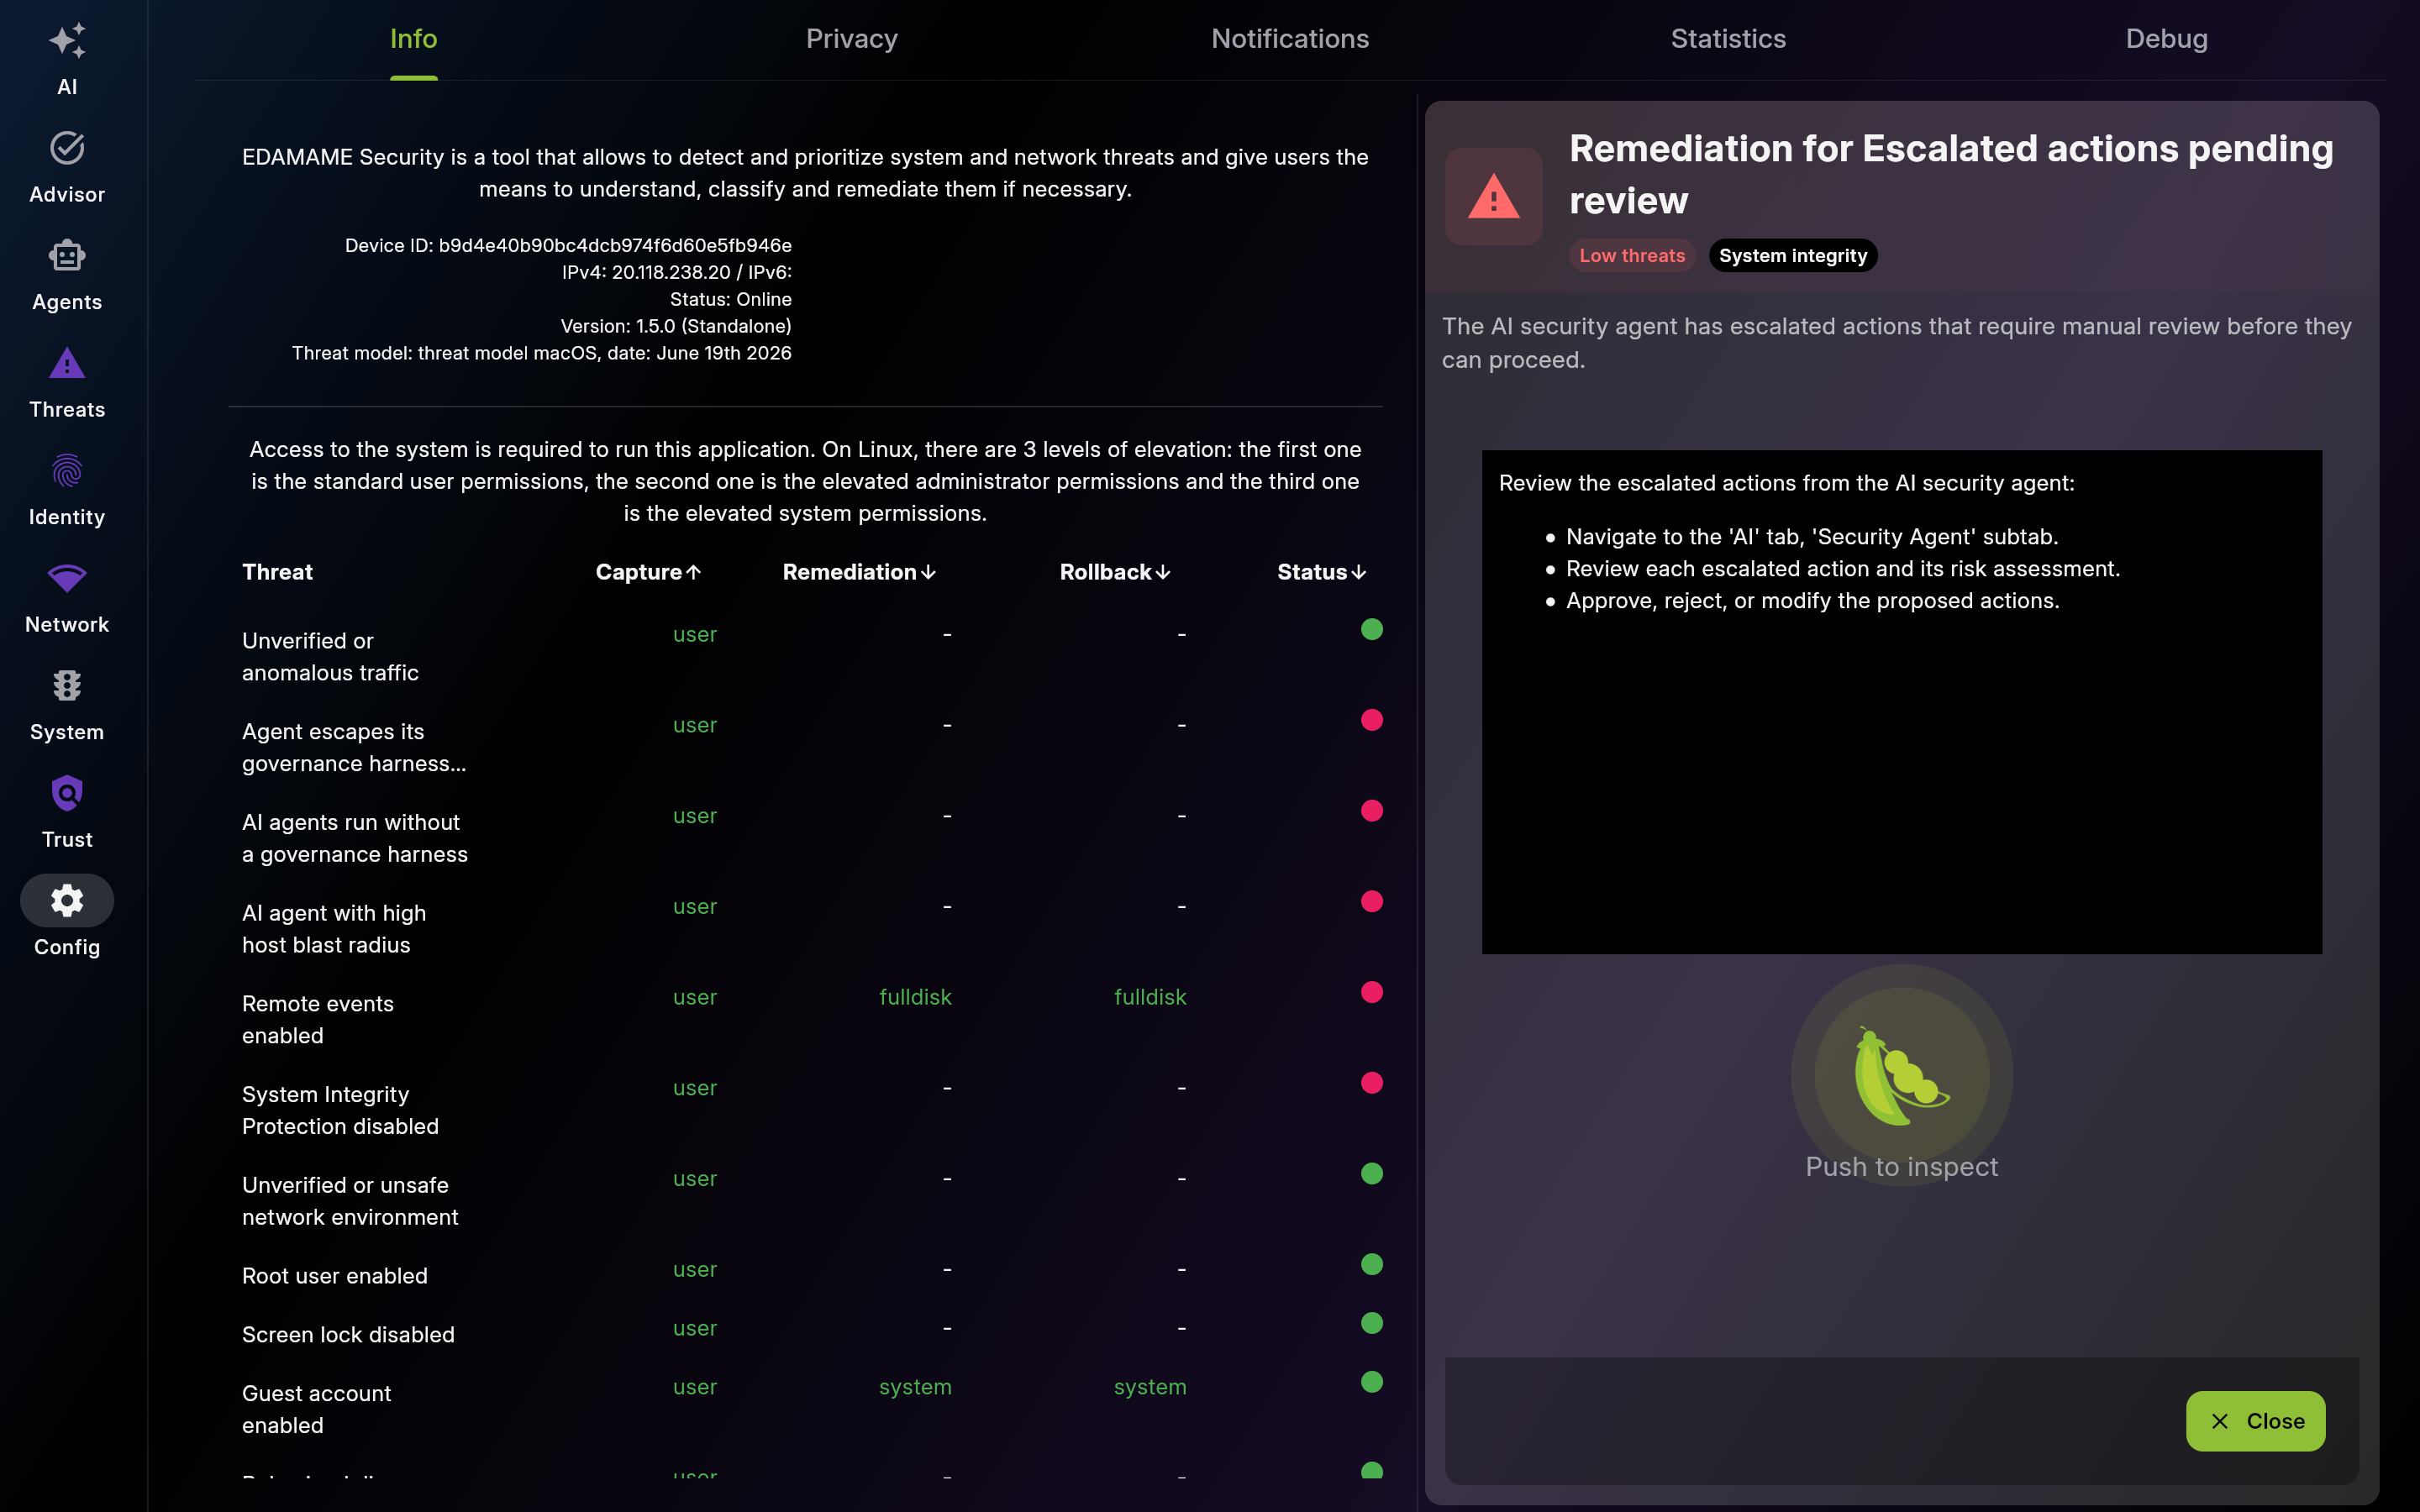 |
Screenshot of Info – App & System Status - Multi-pane layout showing list and detail views
Use this table to understand unavailable checks/fixes and grant only minimum required privileges.
Check helper and permission state before deeper troubleshooting. Resolve prerequisites in order.
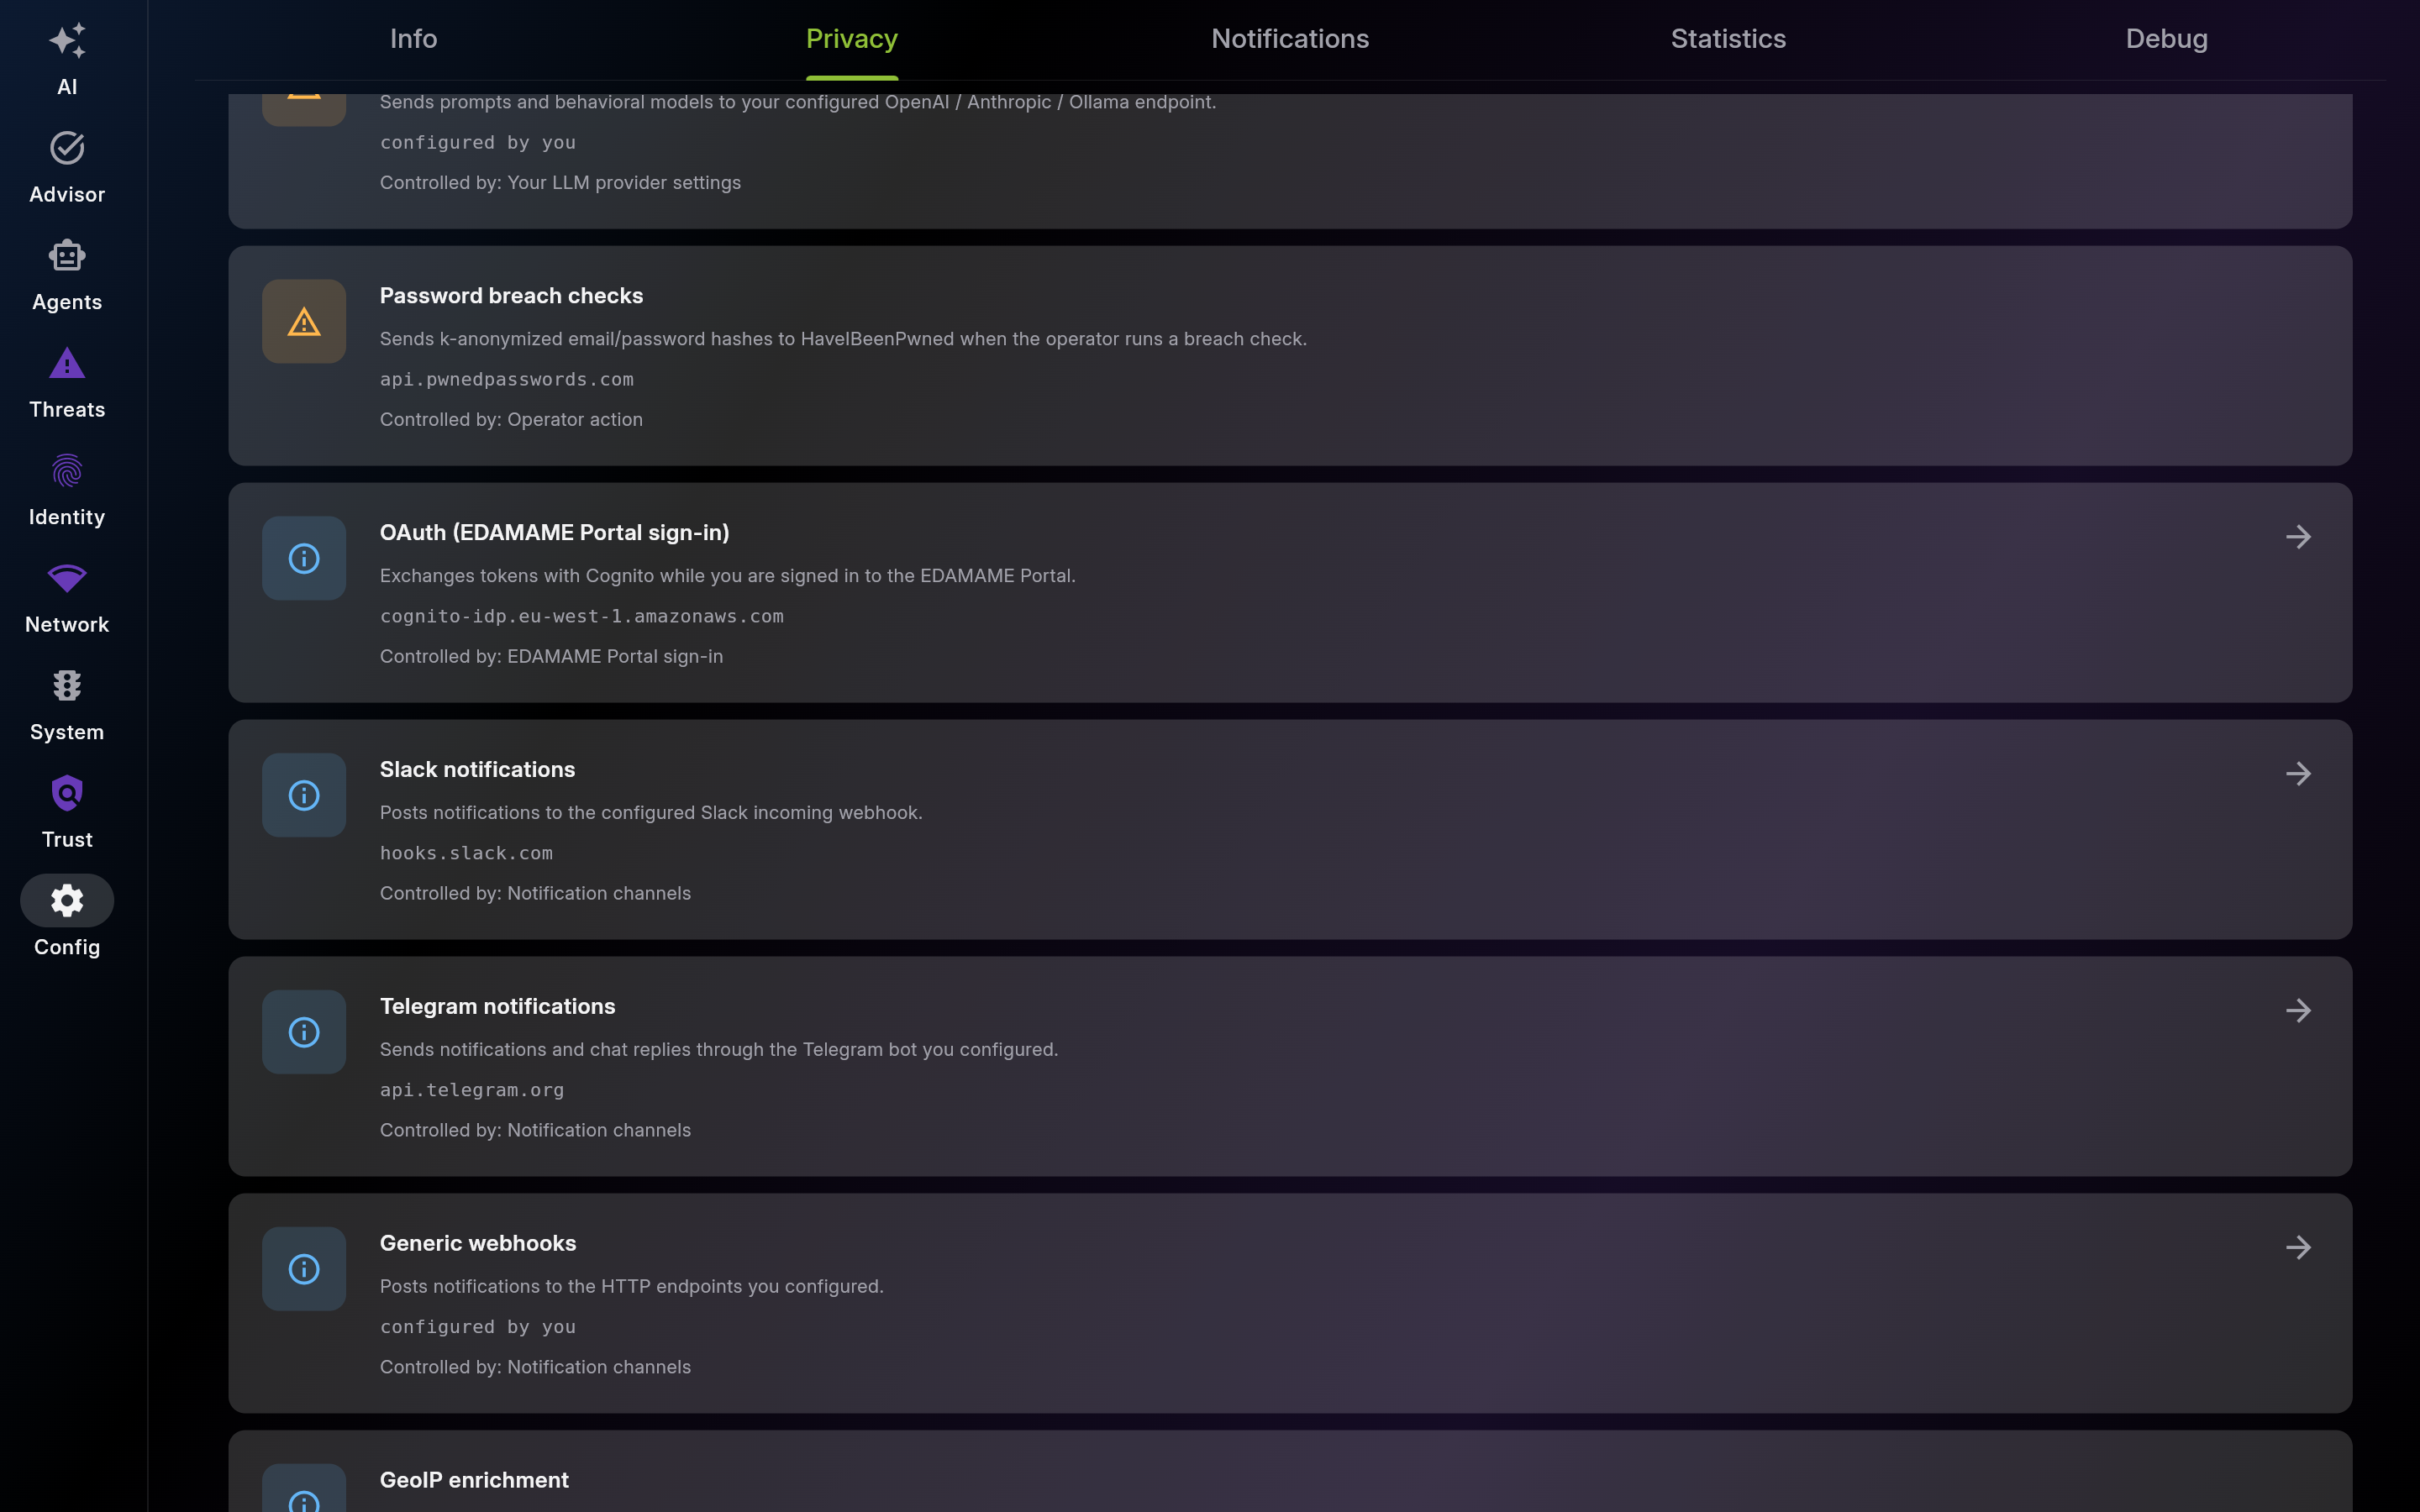
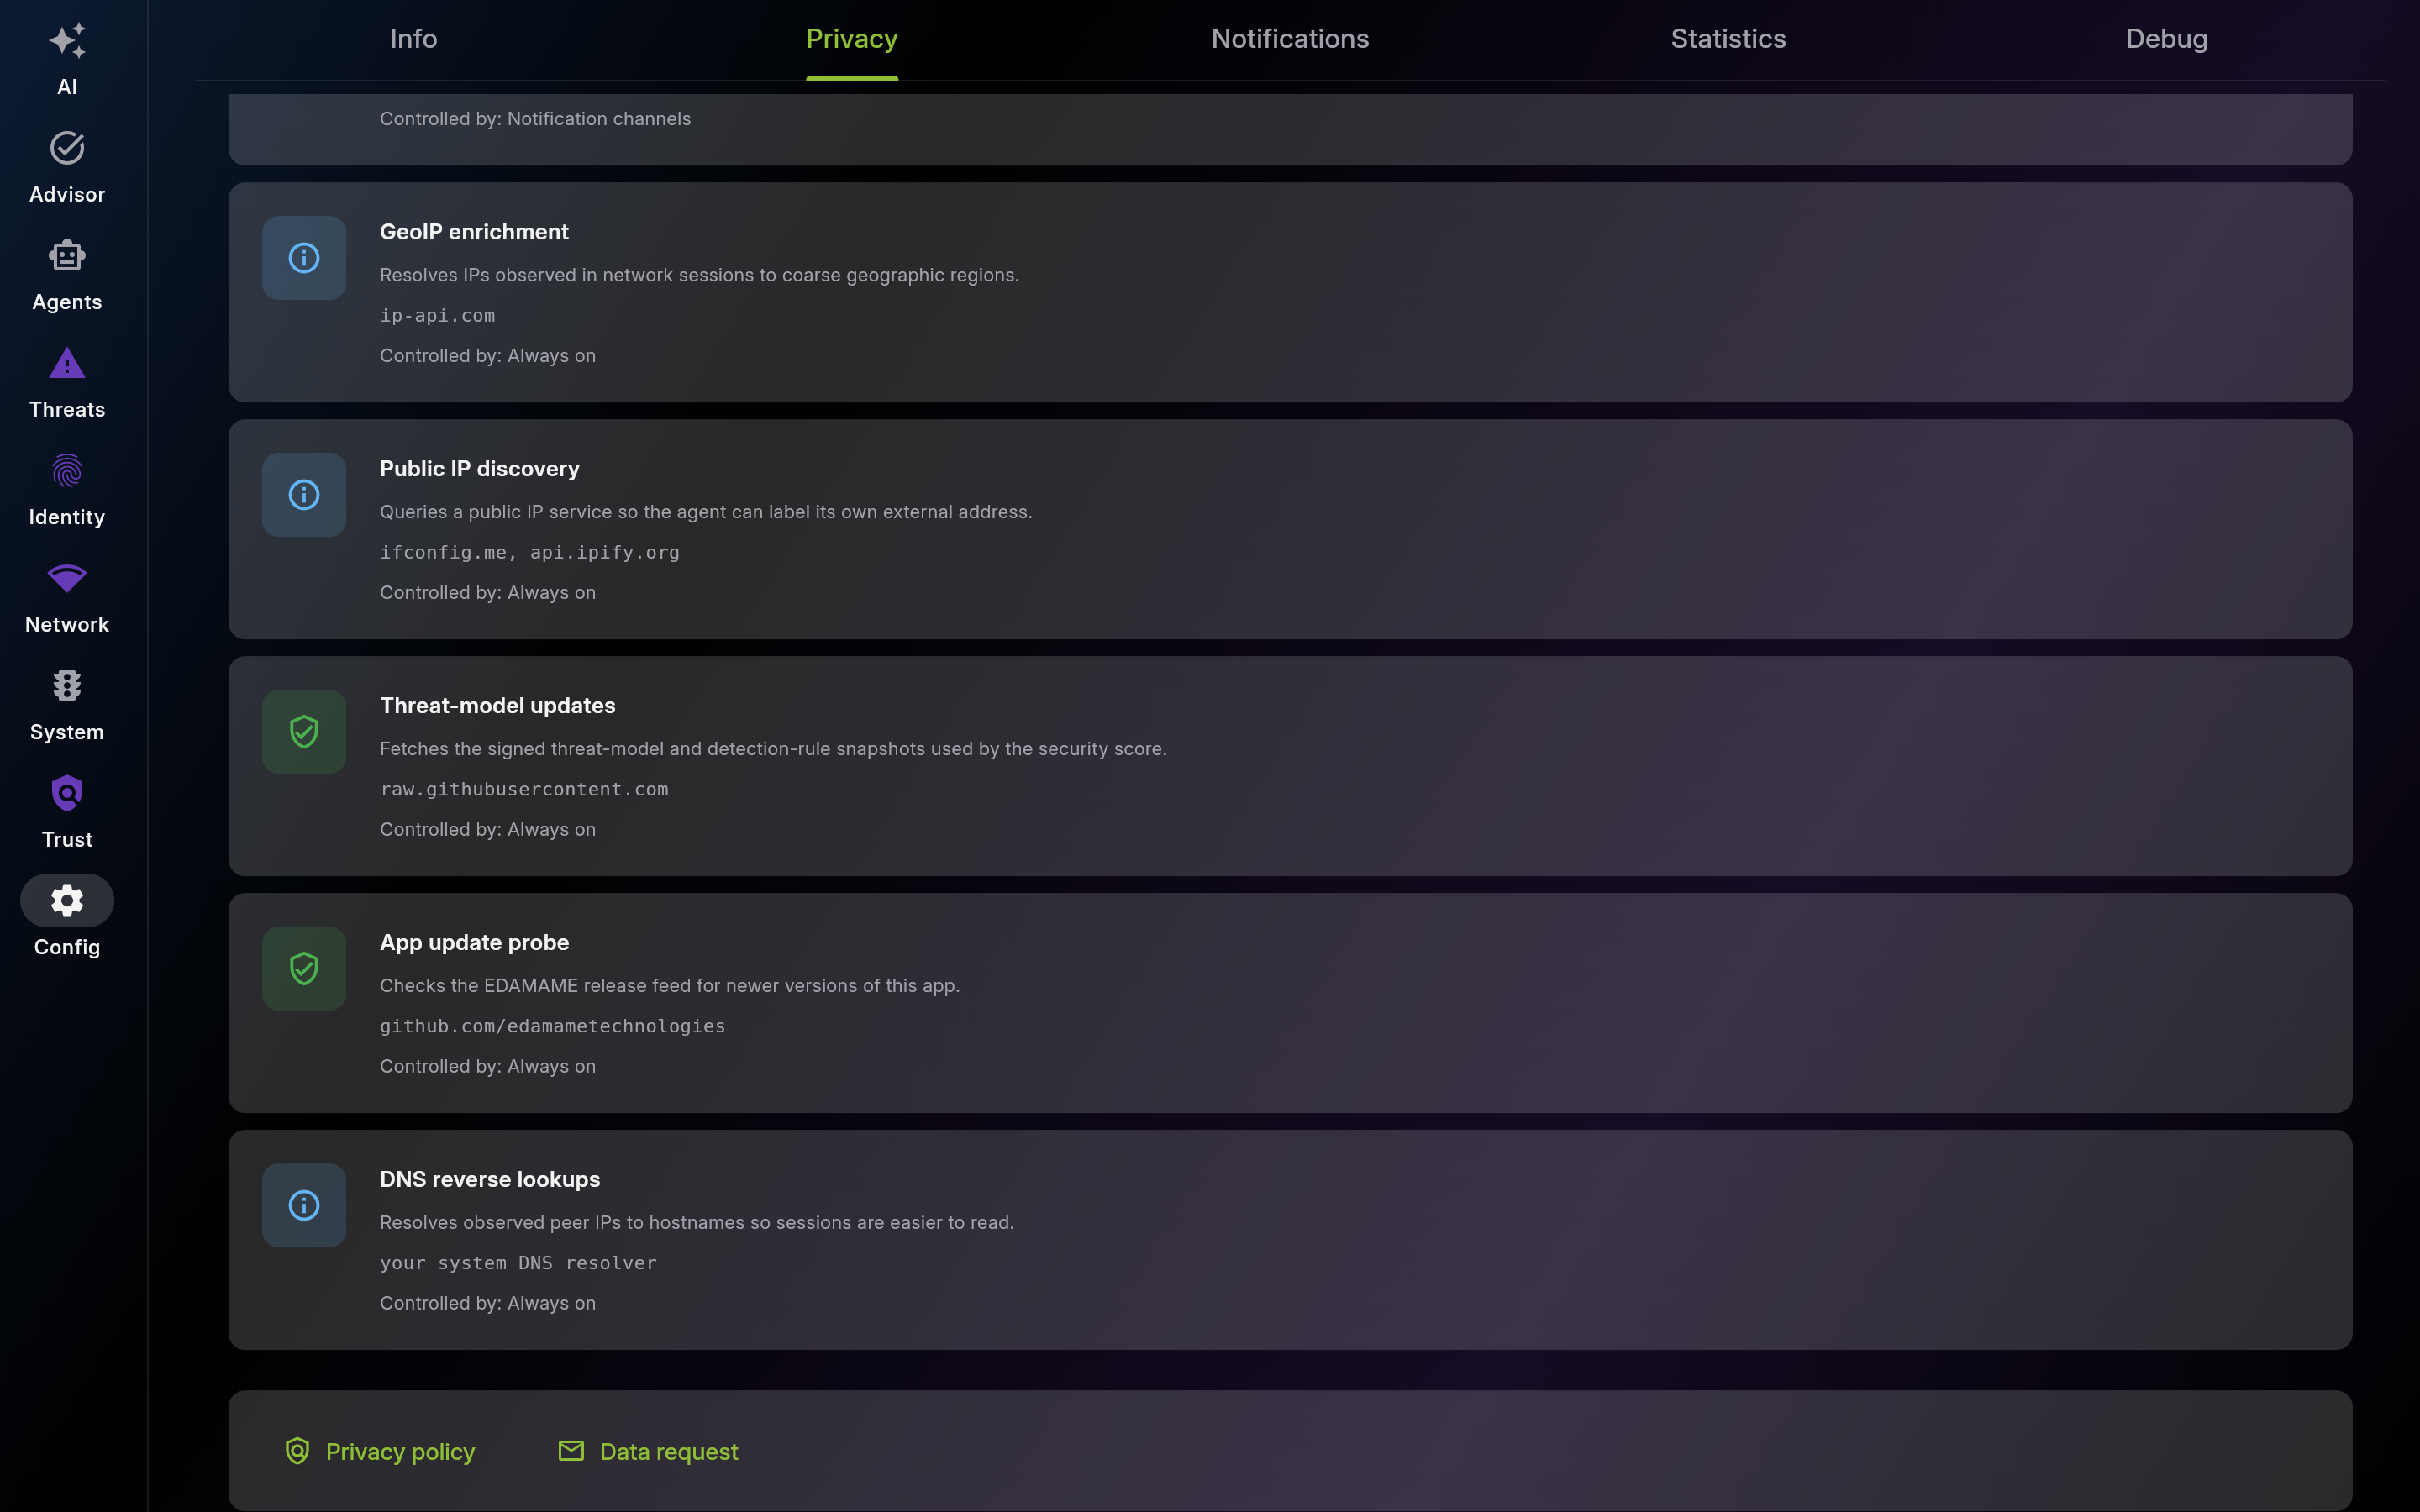
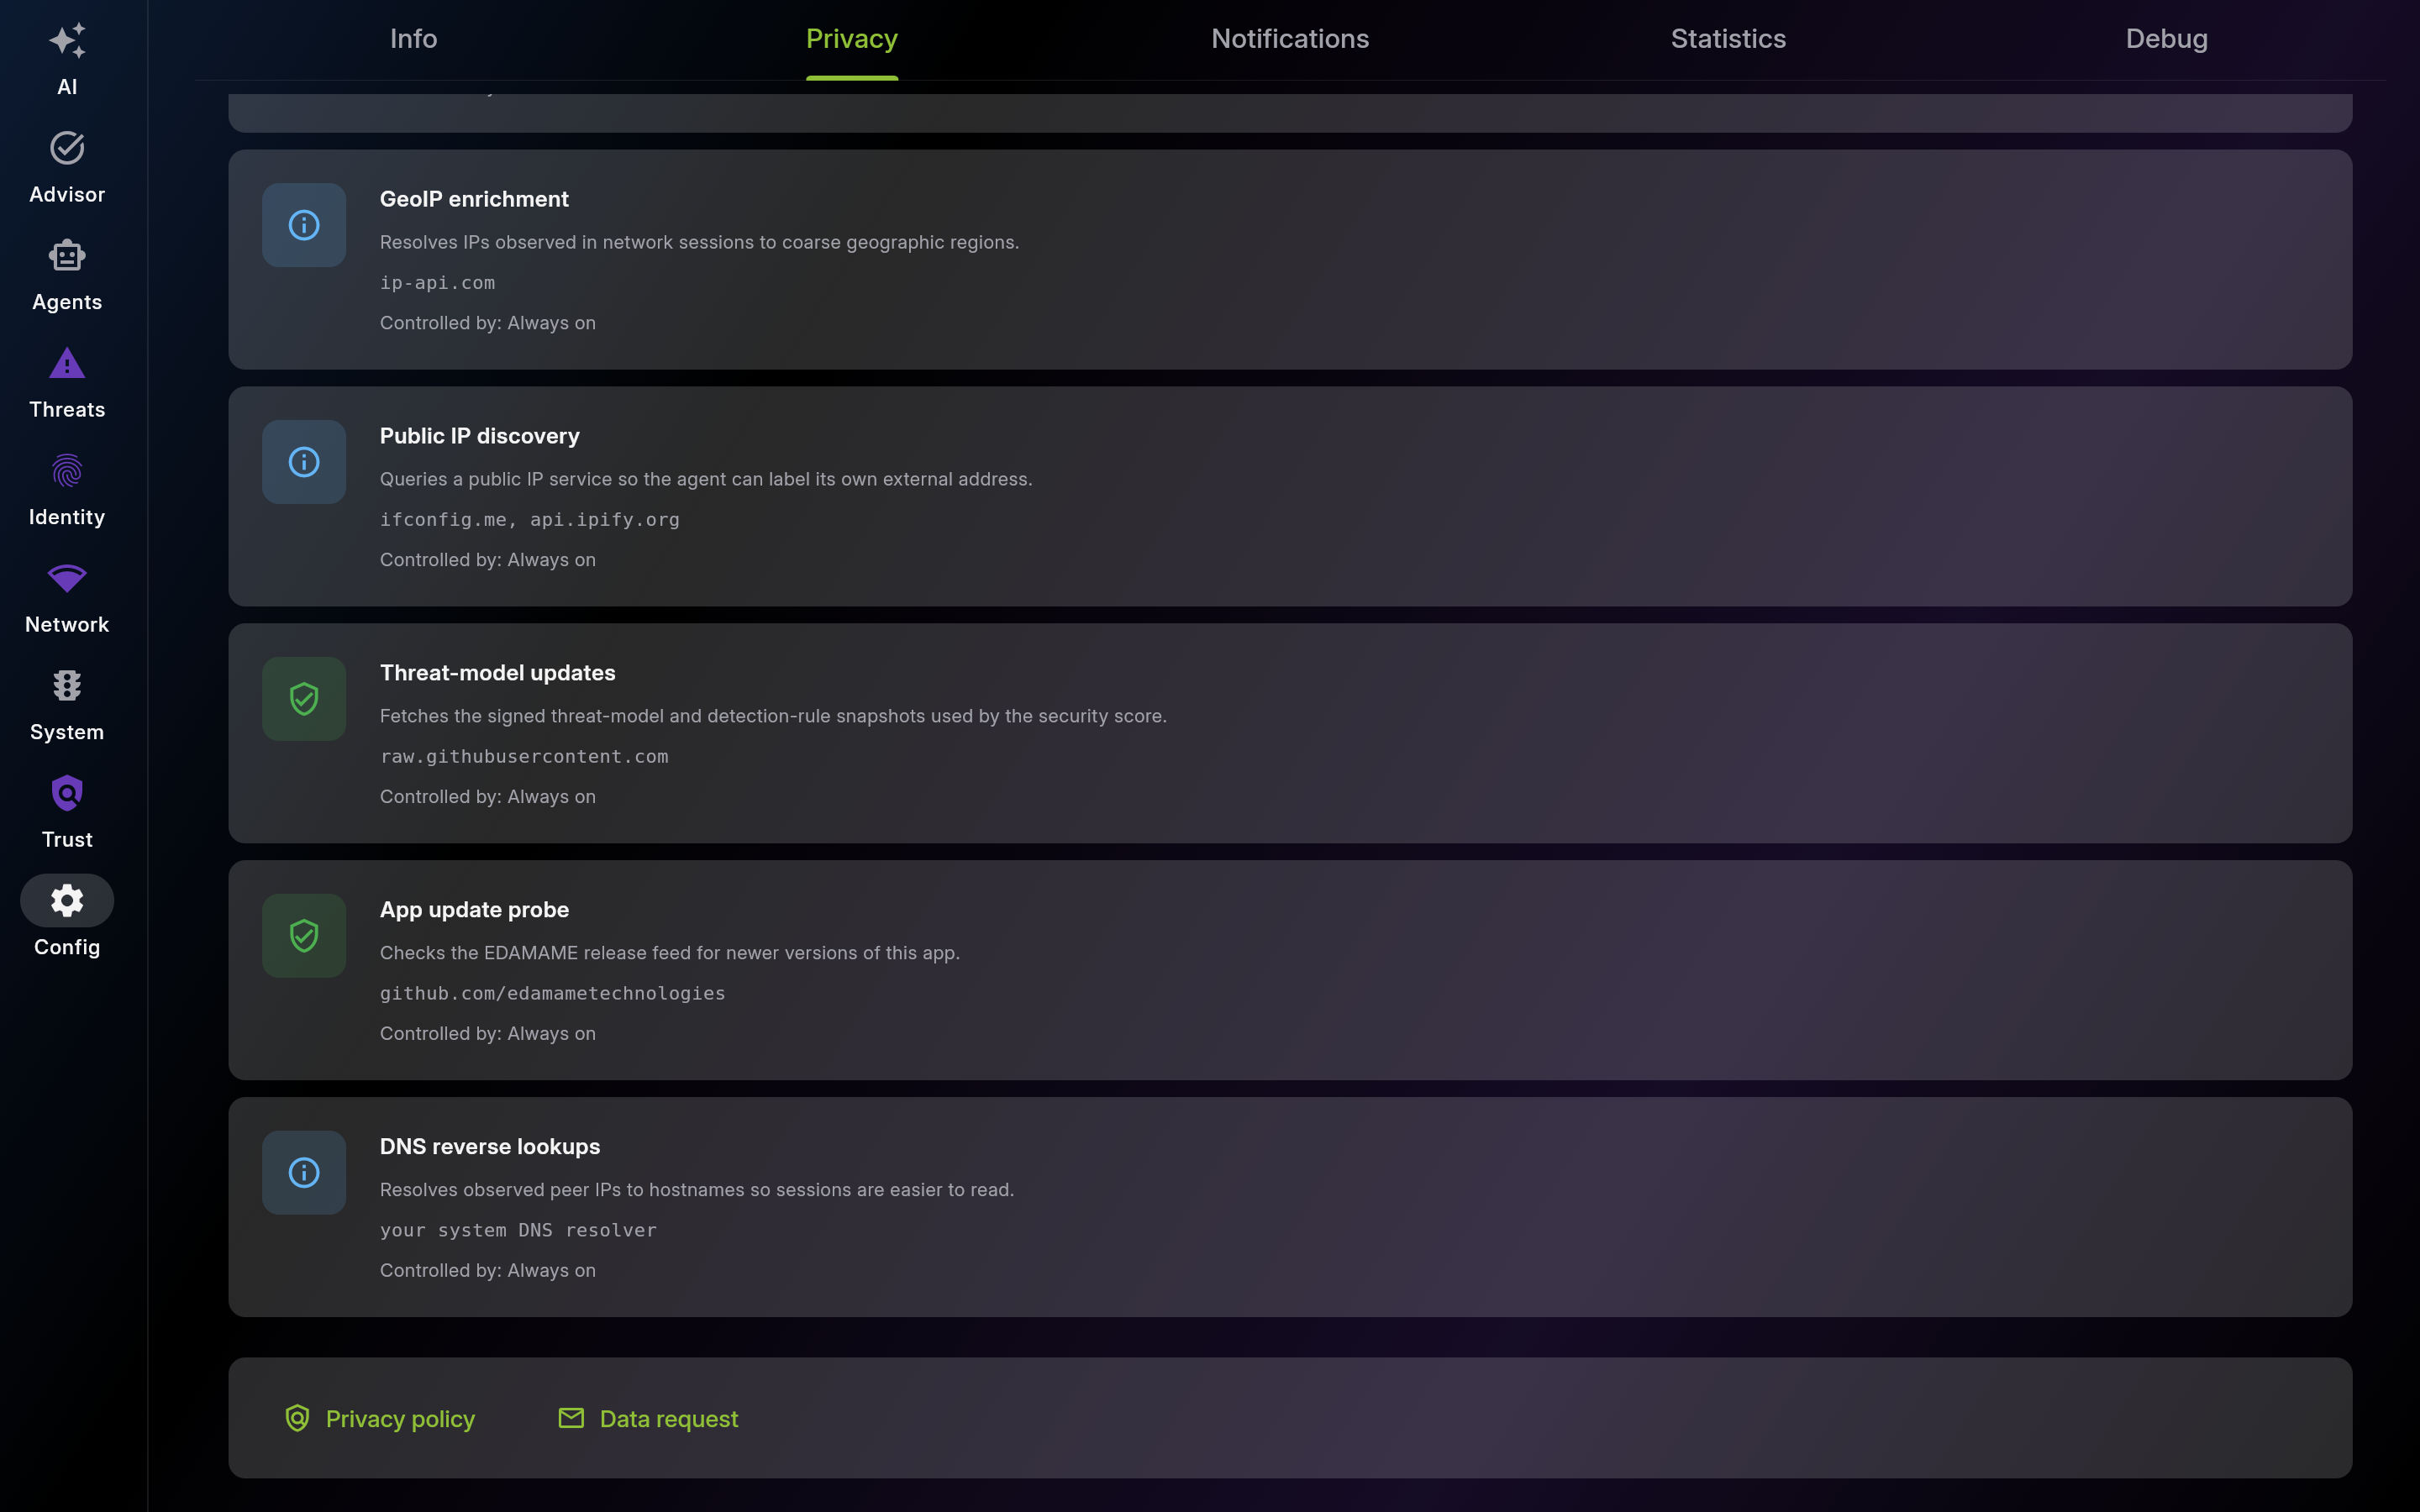
Description: Use Privacy to opt out of anonymous analytics or crash reports and to read an honest, endpoint-by-endpoint catalog of everything that leaves the device. Operator-controlled flows carry a quick-jump arrow to the page that owns the switch; the five 'Always on' flows are the infrastructure calls the app needs to function (GeoIP, public IP, threat-model and app-update fetches, DNS).

Screenshot of Privacy – Your Data, Your Control
Privacy – Your Data, Your Control — full page (scroll to see every section)
Part 2 of 4
Part 3 of 4
Part 4 of 4
Description: Use this section to tune local alert signal-to-noise for your workflow. Keep high-value in-app categories enabled and review history regularly.
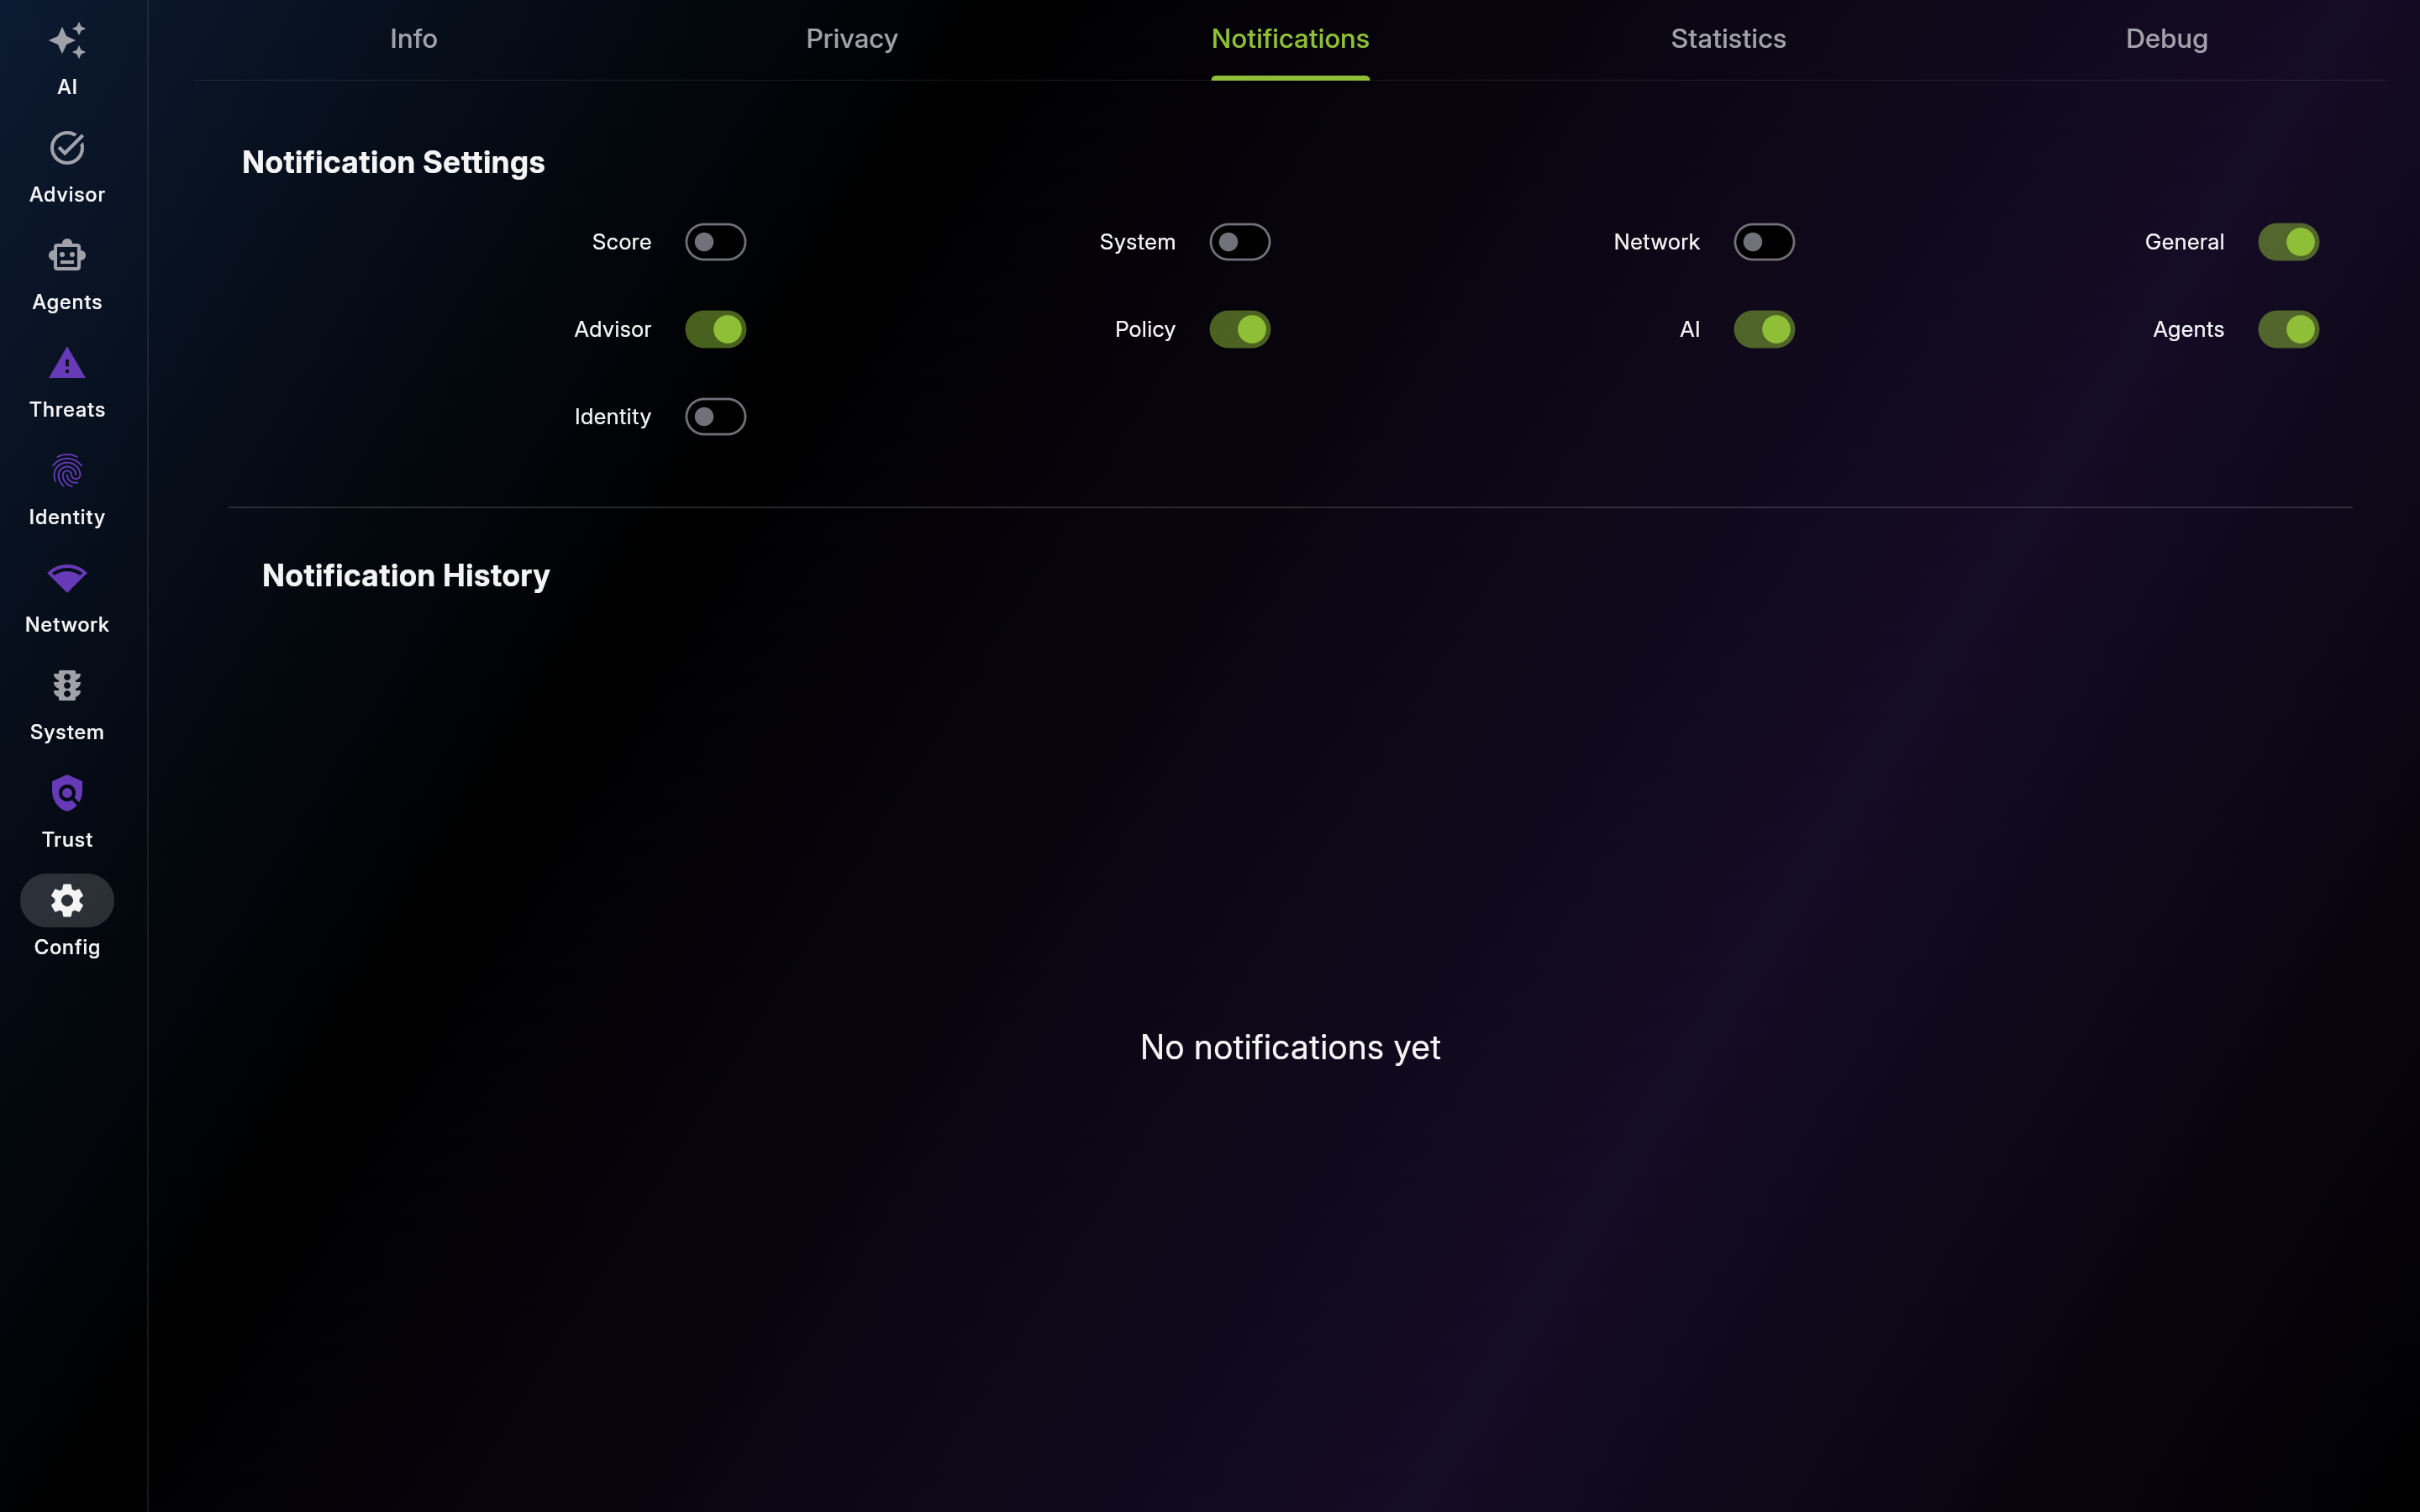
Screenshot of Notifications – Settings & History
Enable actionable categories and reduce noise-heavy channels to keep alerts useful.
Use history to reconstruct incidents and reopen related content quickly.
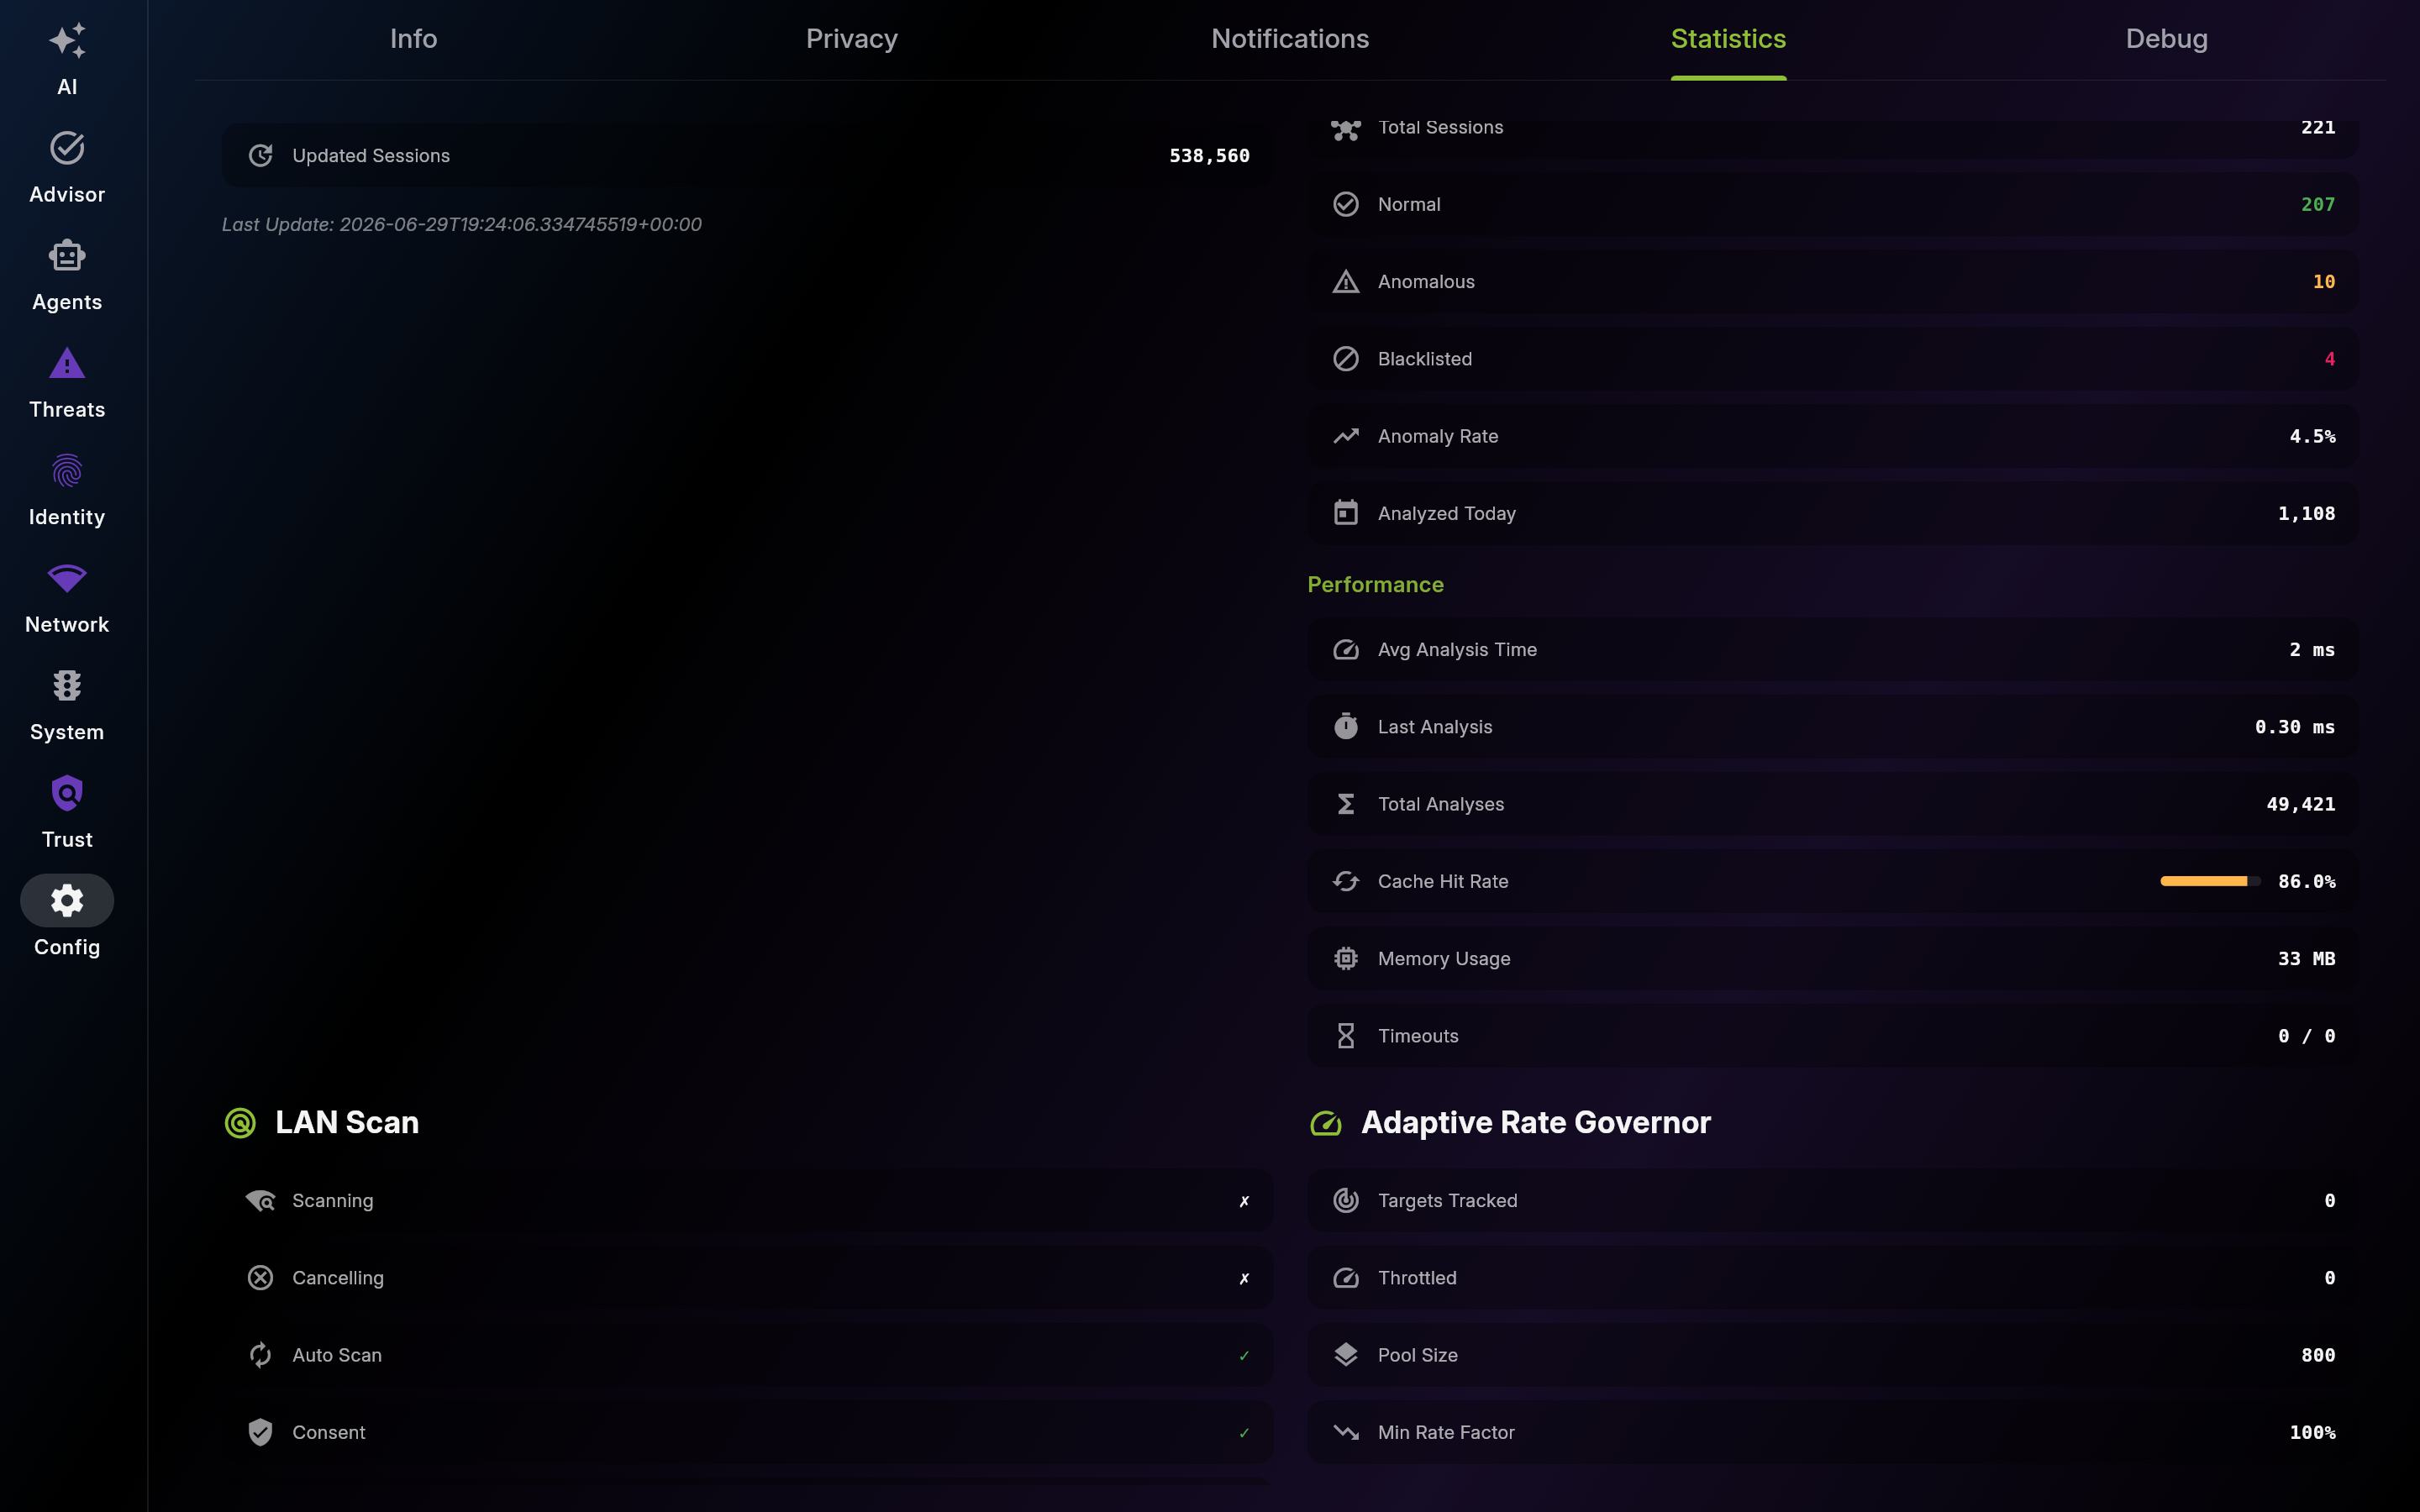
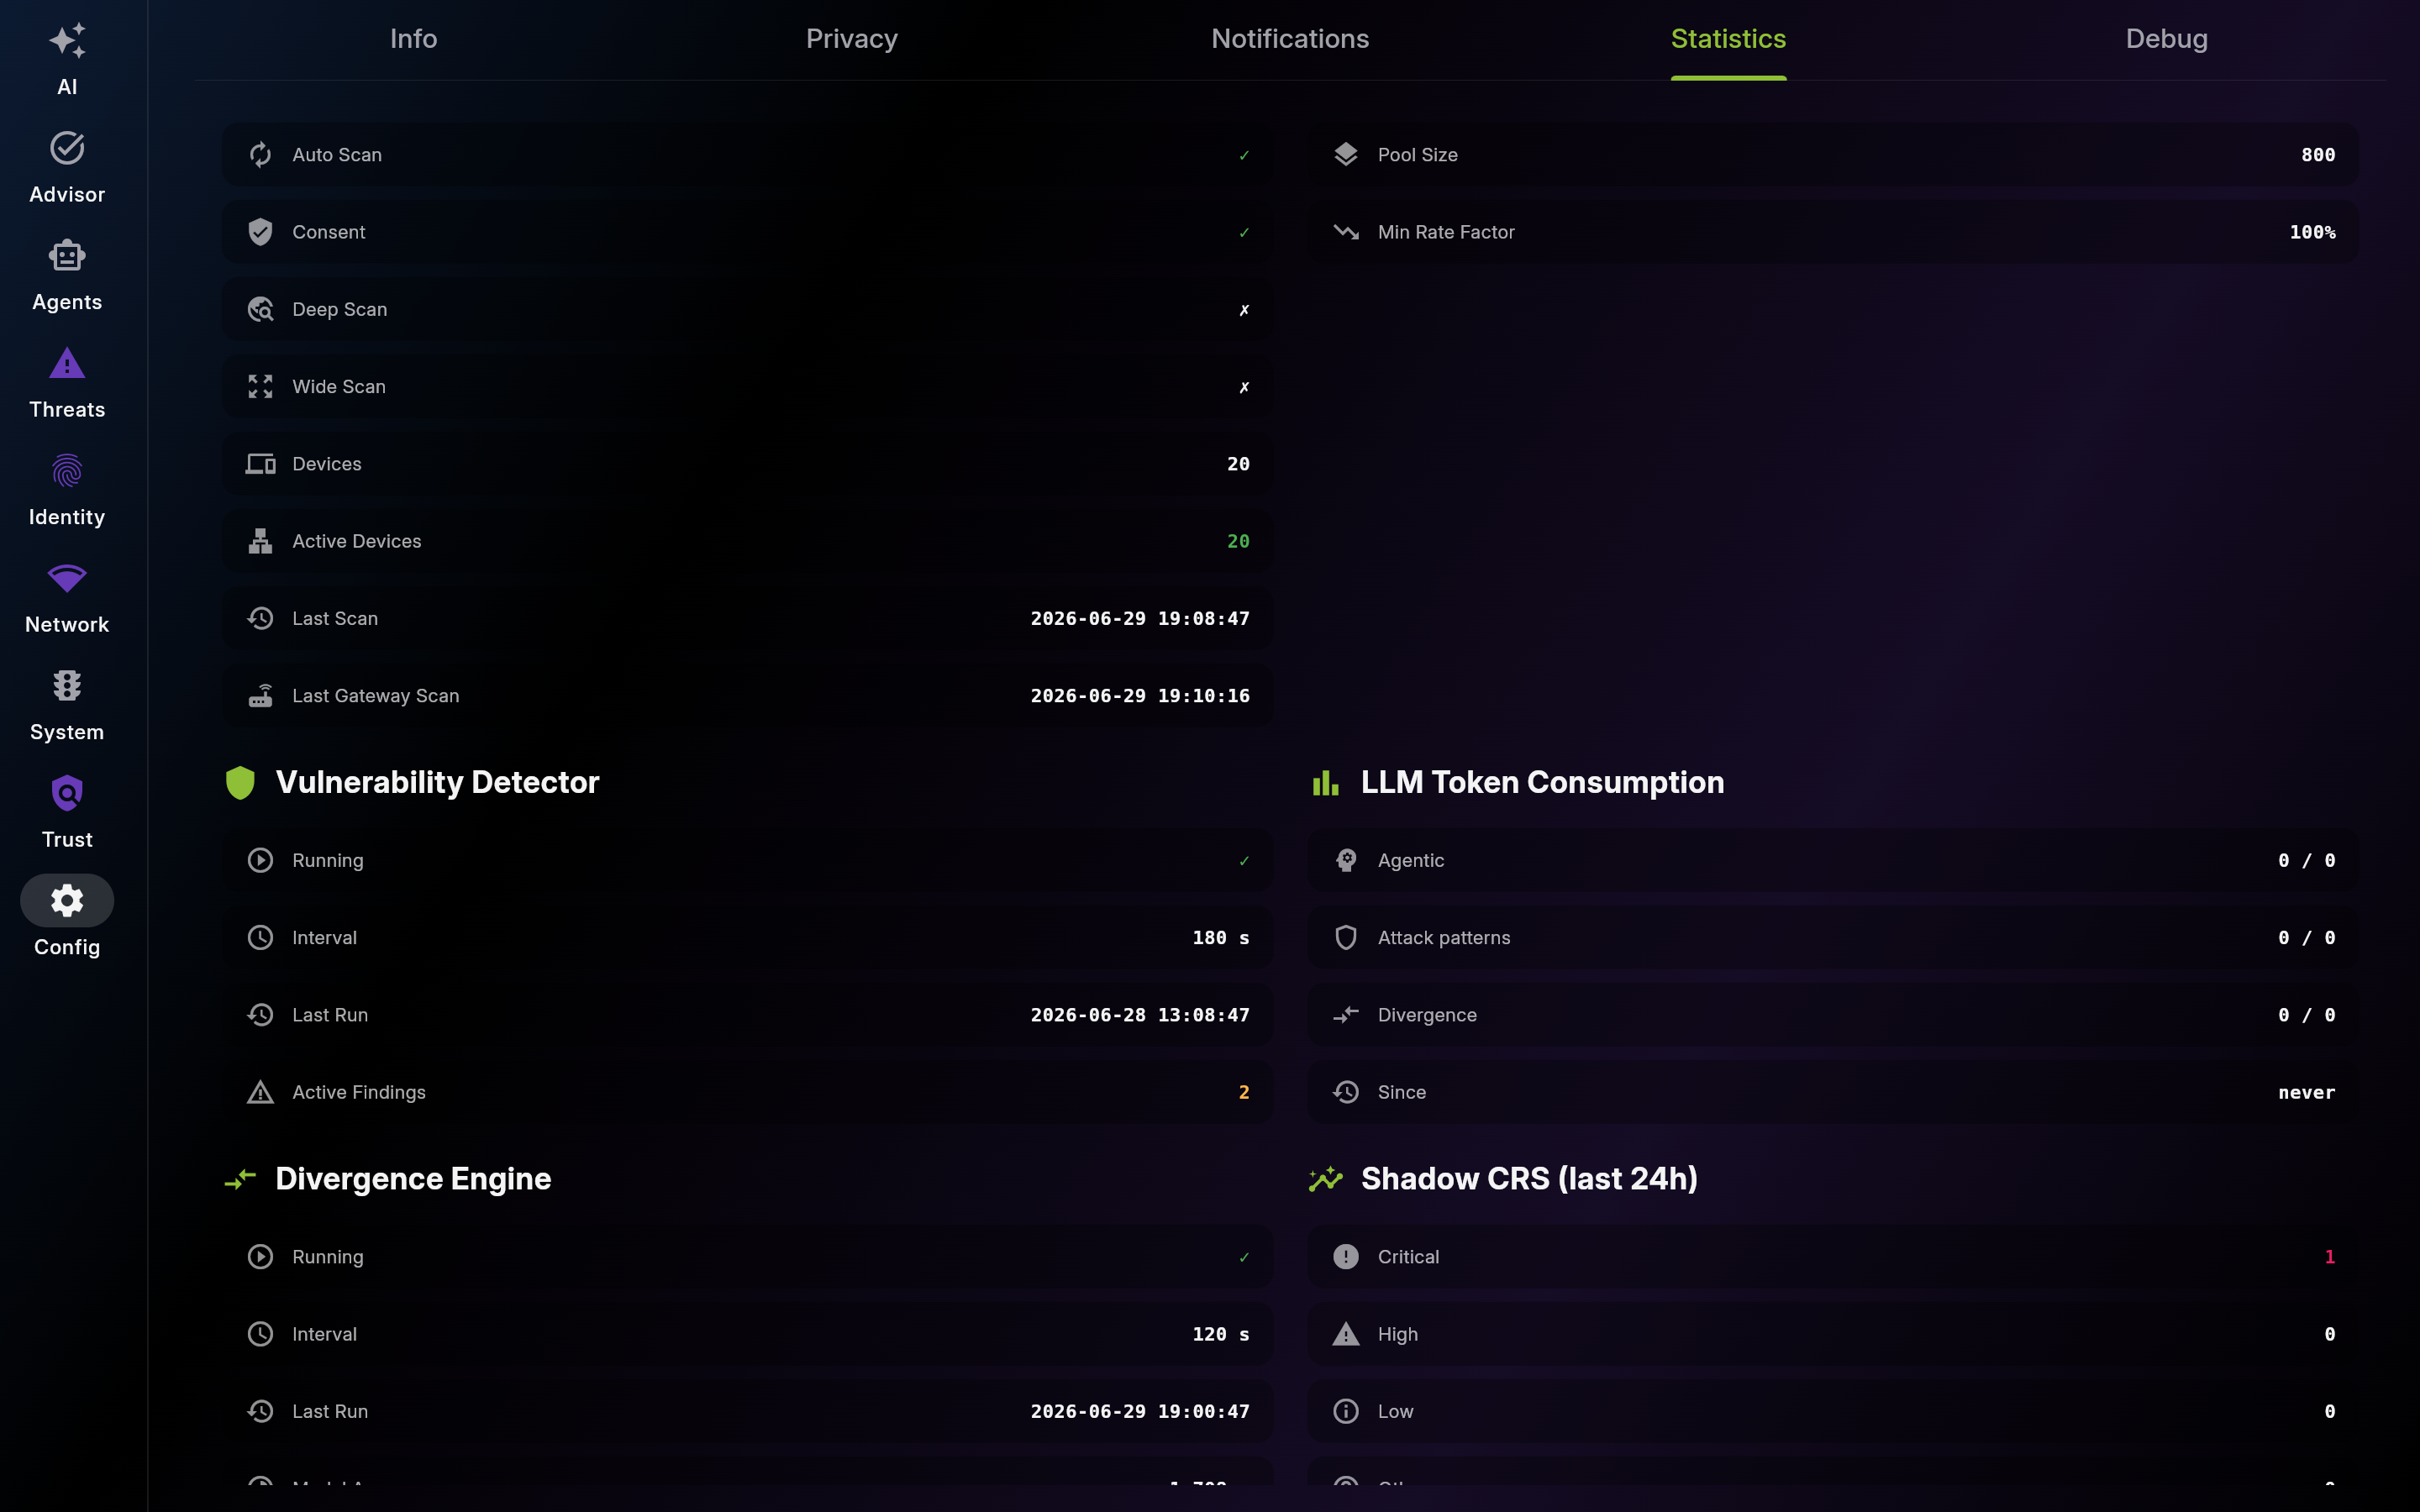
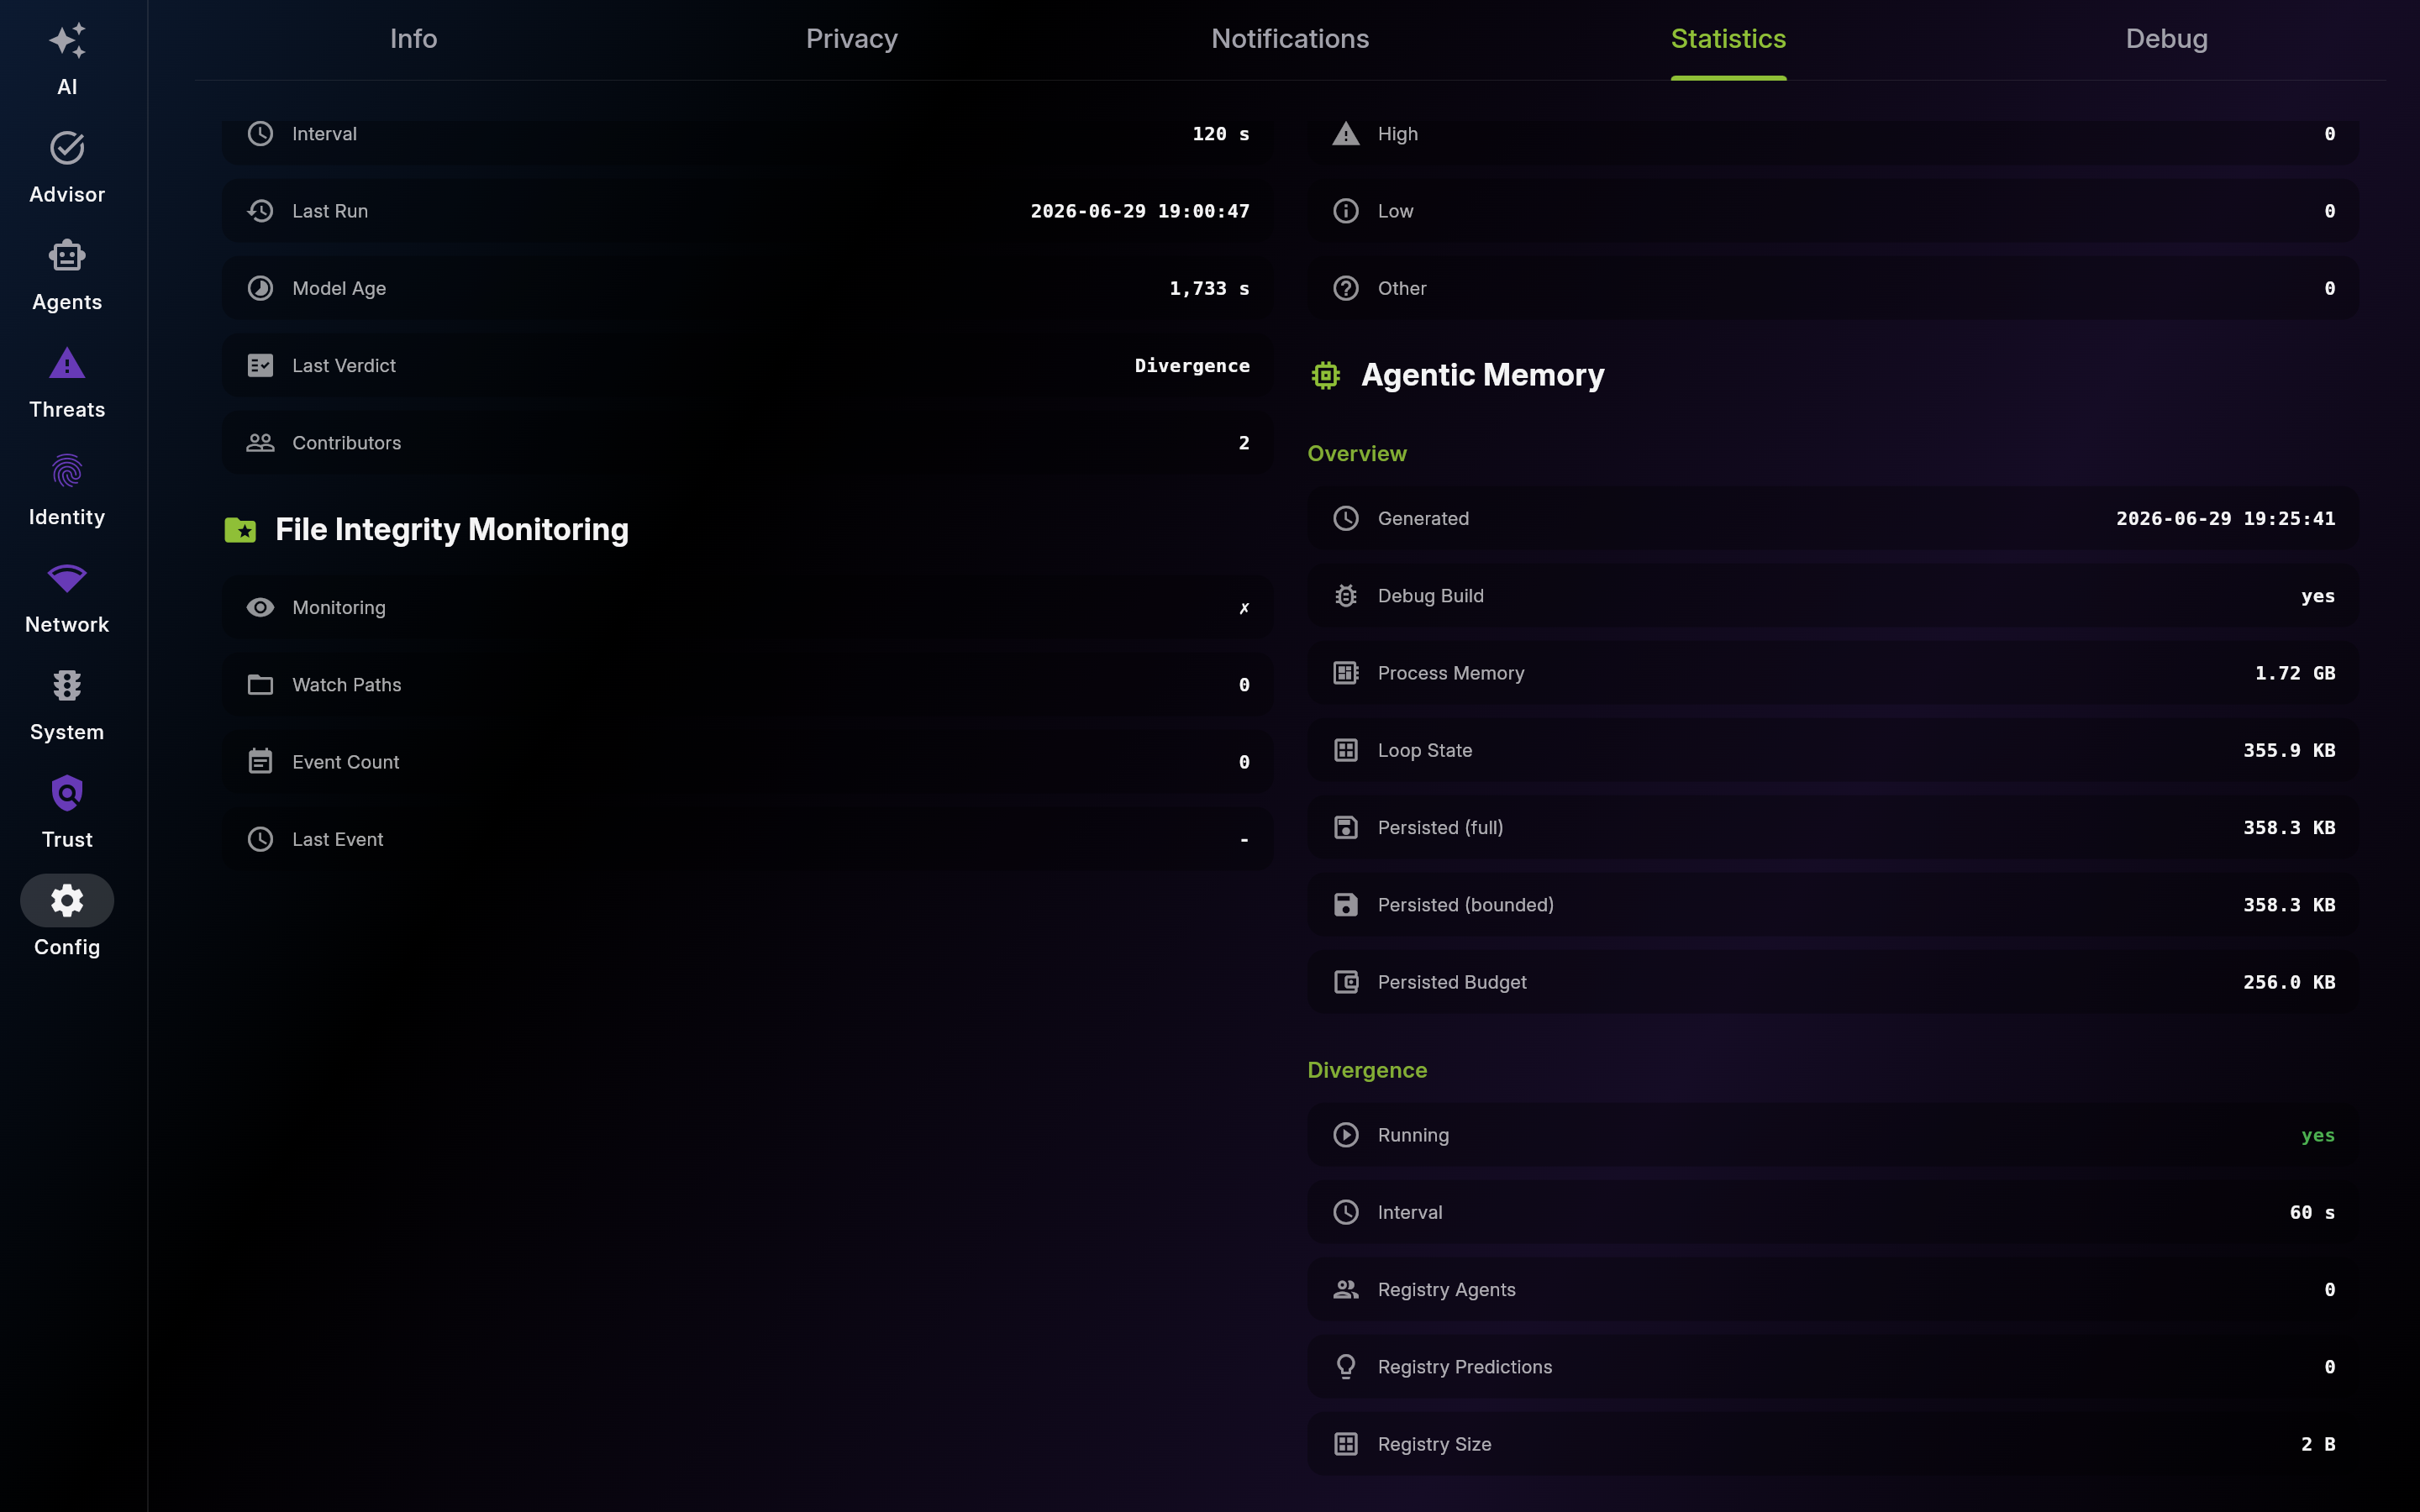
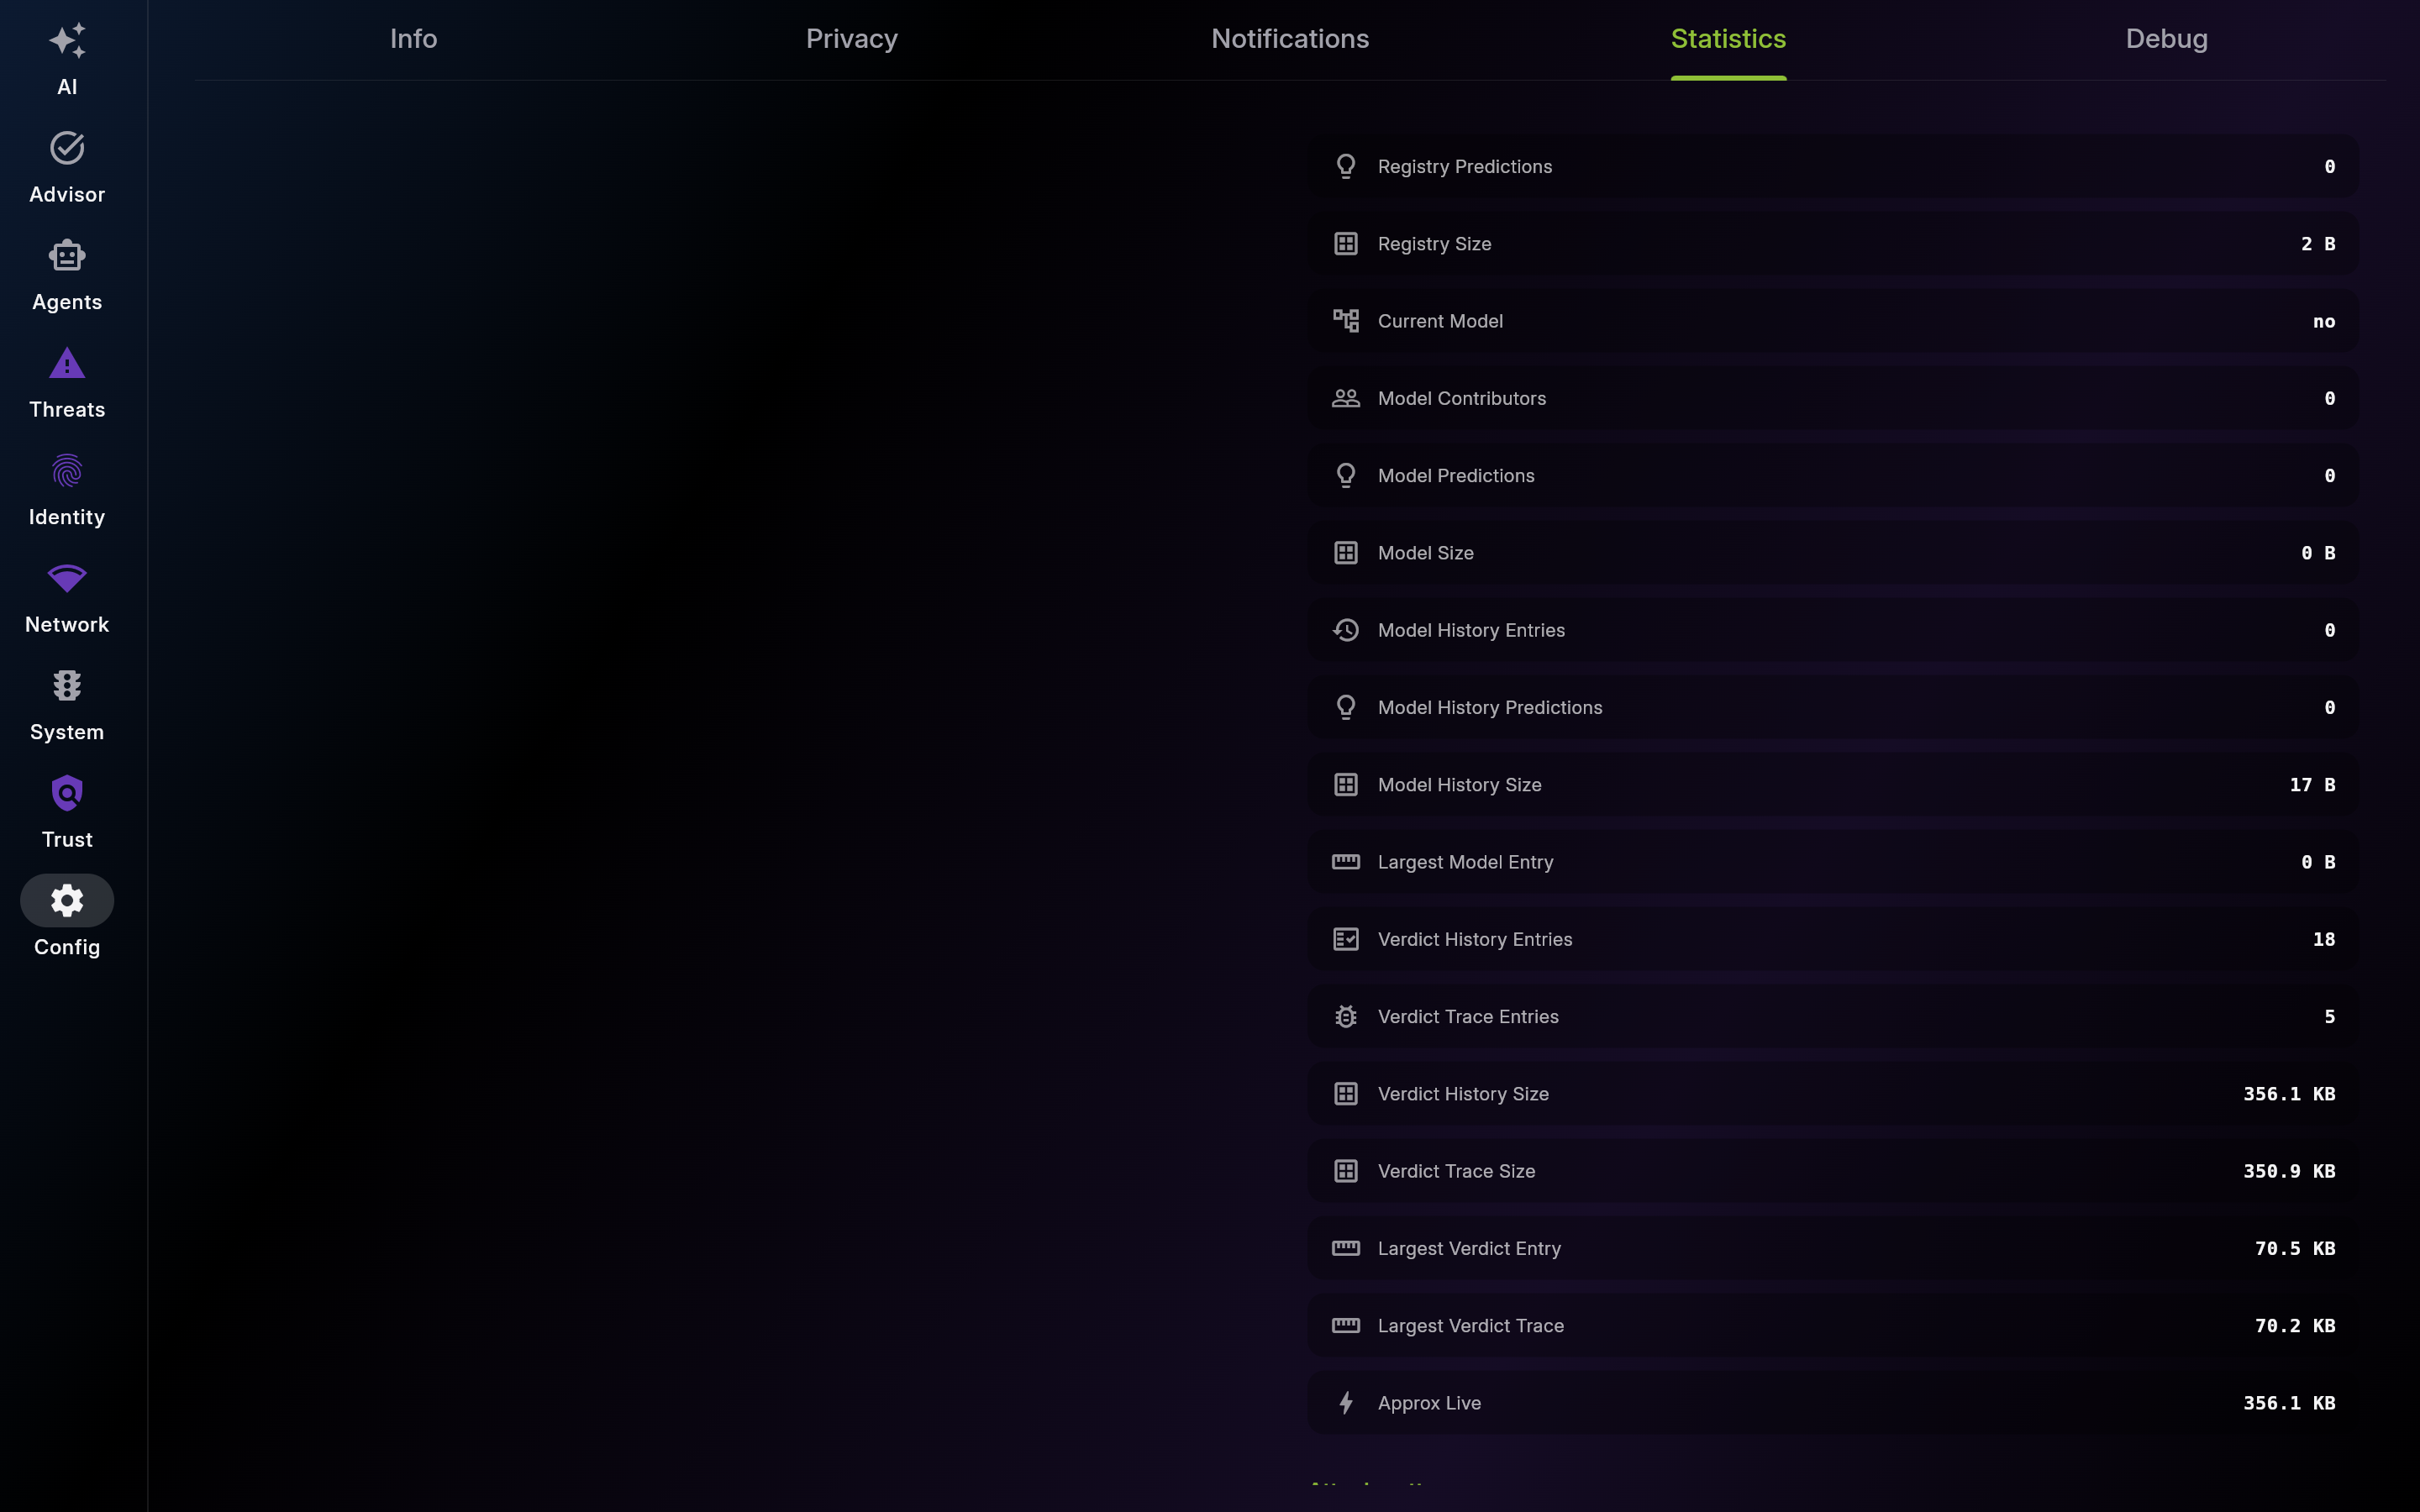
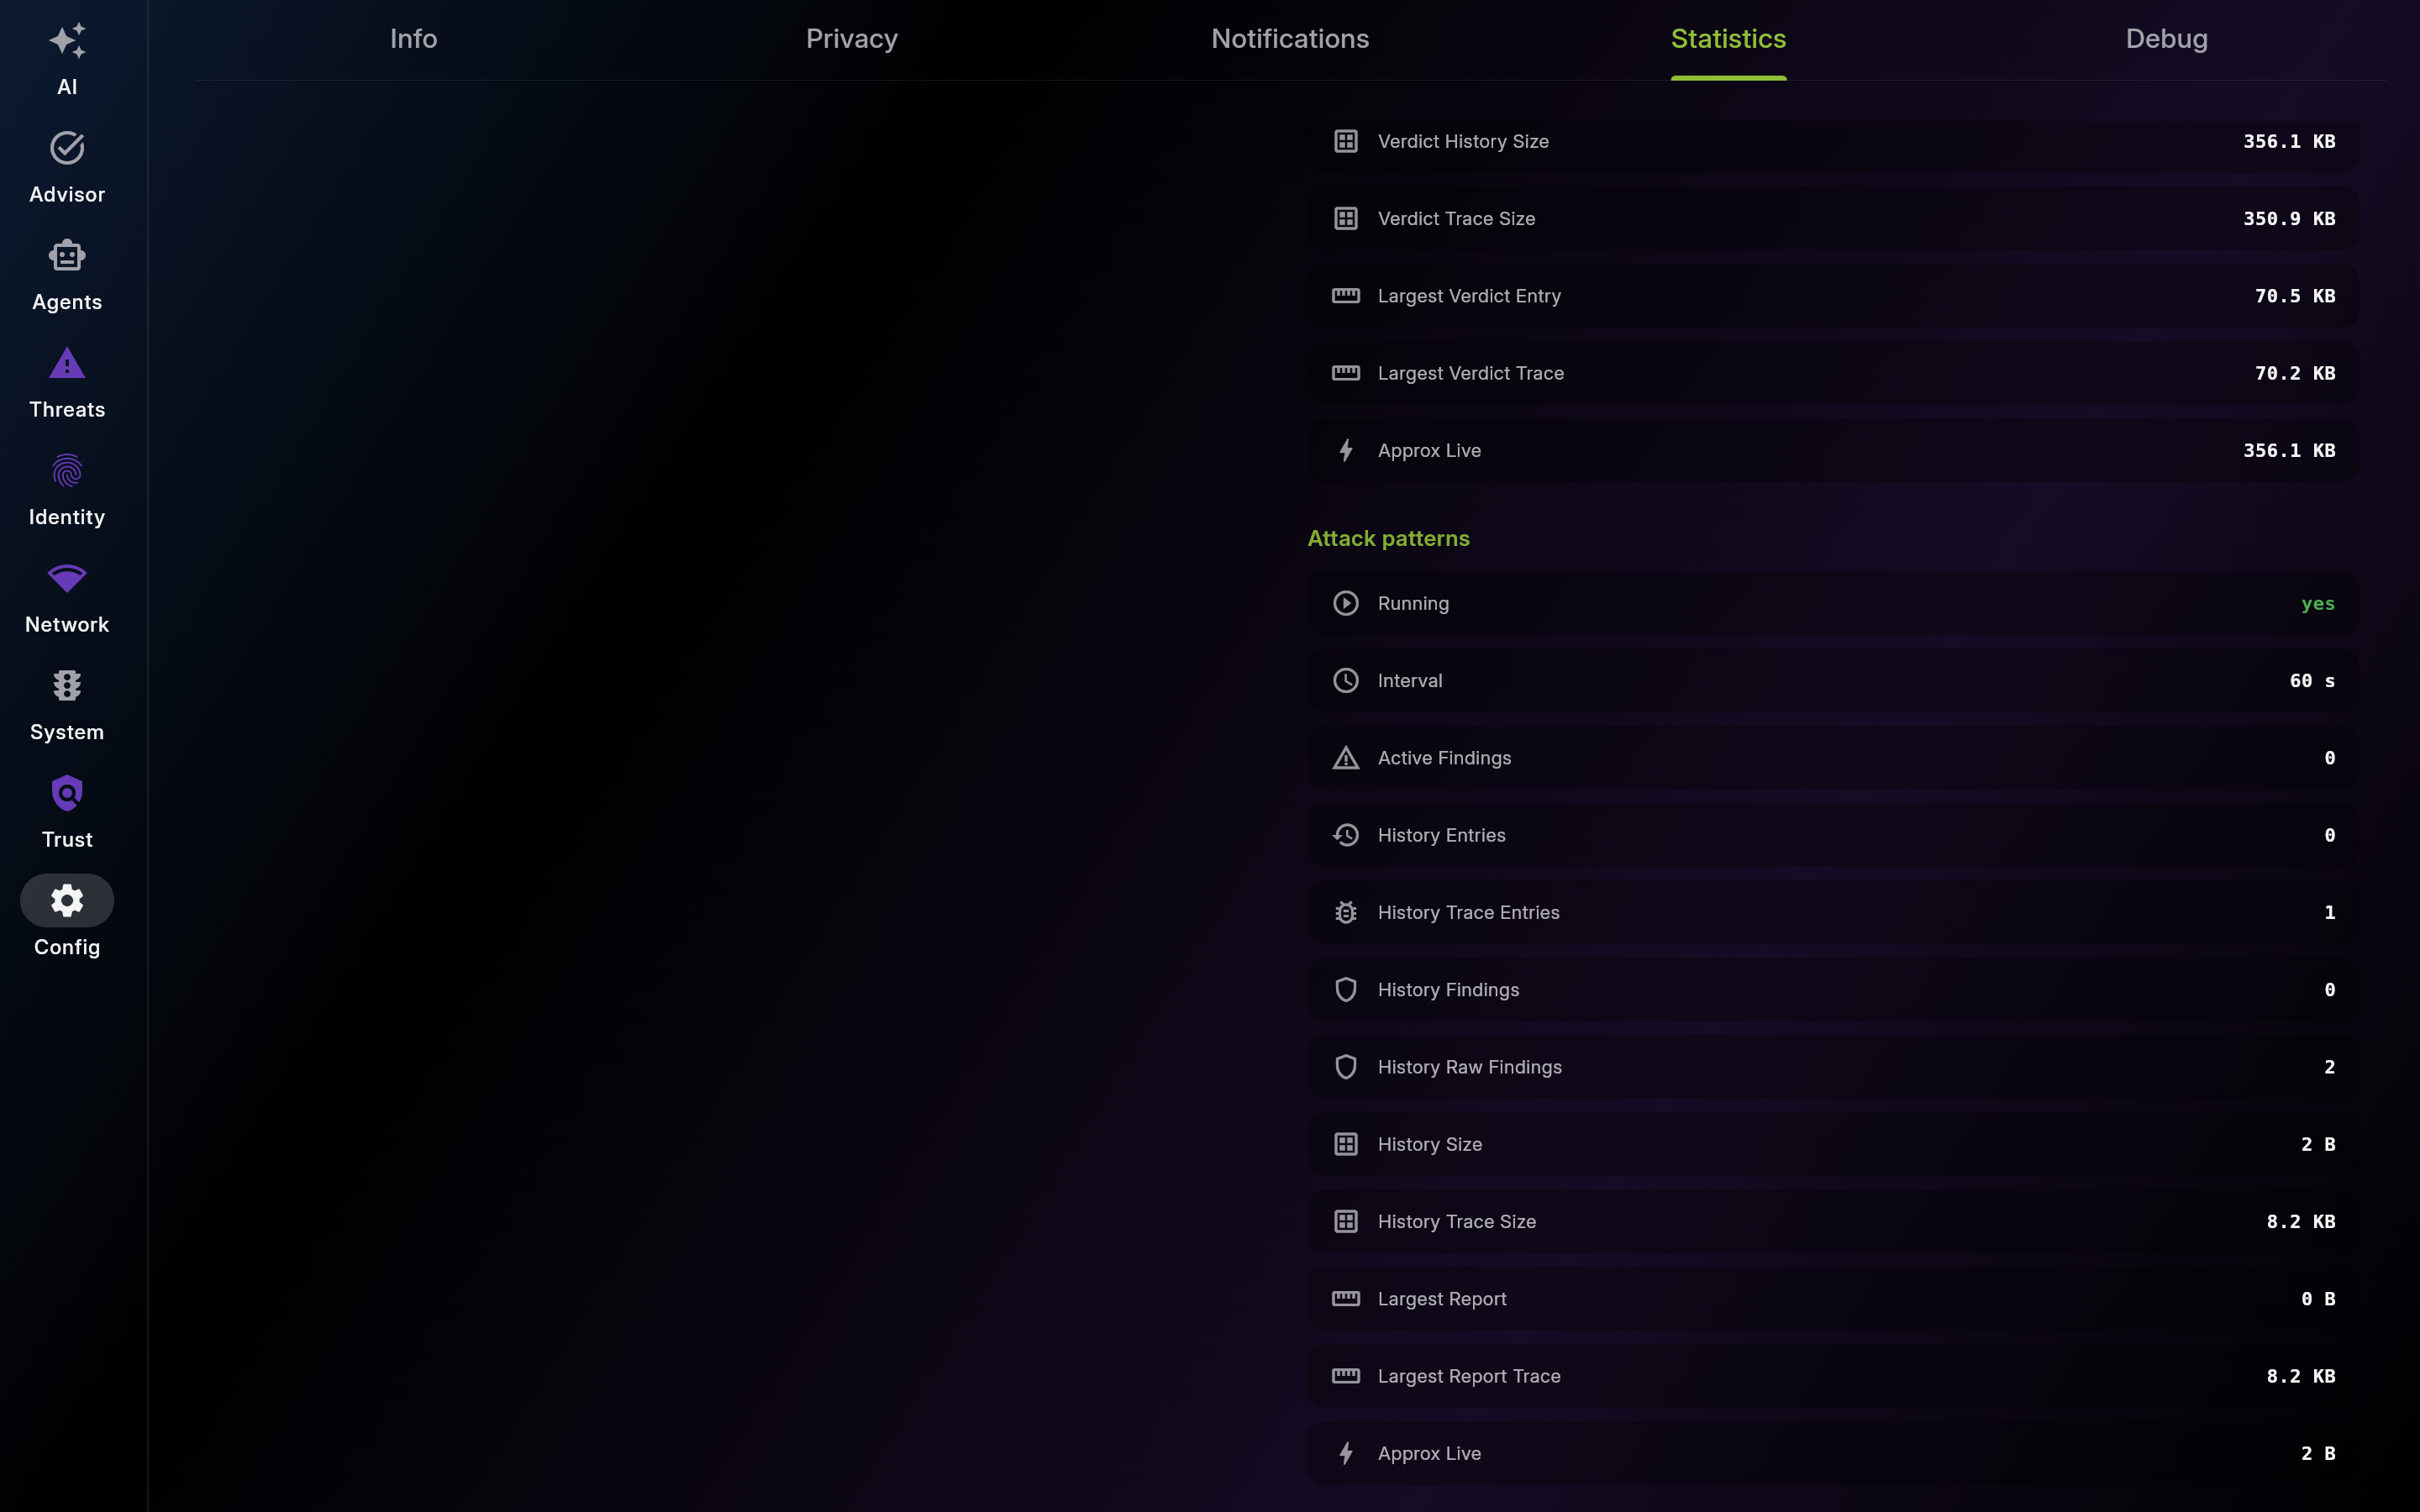
Description: Use this diagnostics panel to monitor the entire telemetry surface — packet pipeline, ML analyzer, vulnerability detector, divergence engine, file integrity monitor, agentic memory, and per-loop LLM token spend. Recheck thresholds and model stats when detection quality shifts.
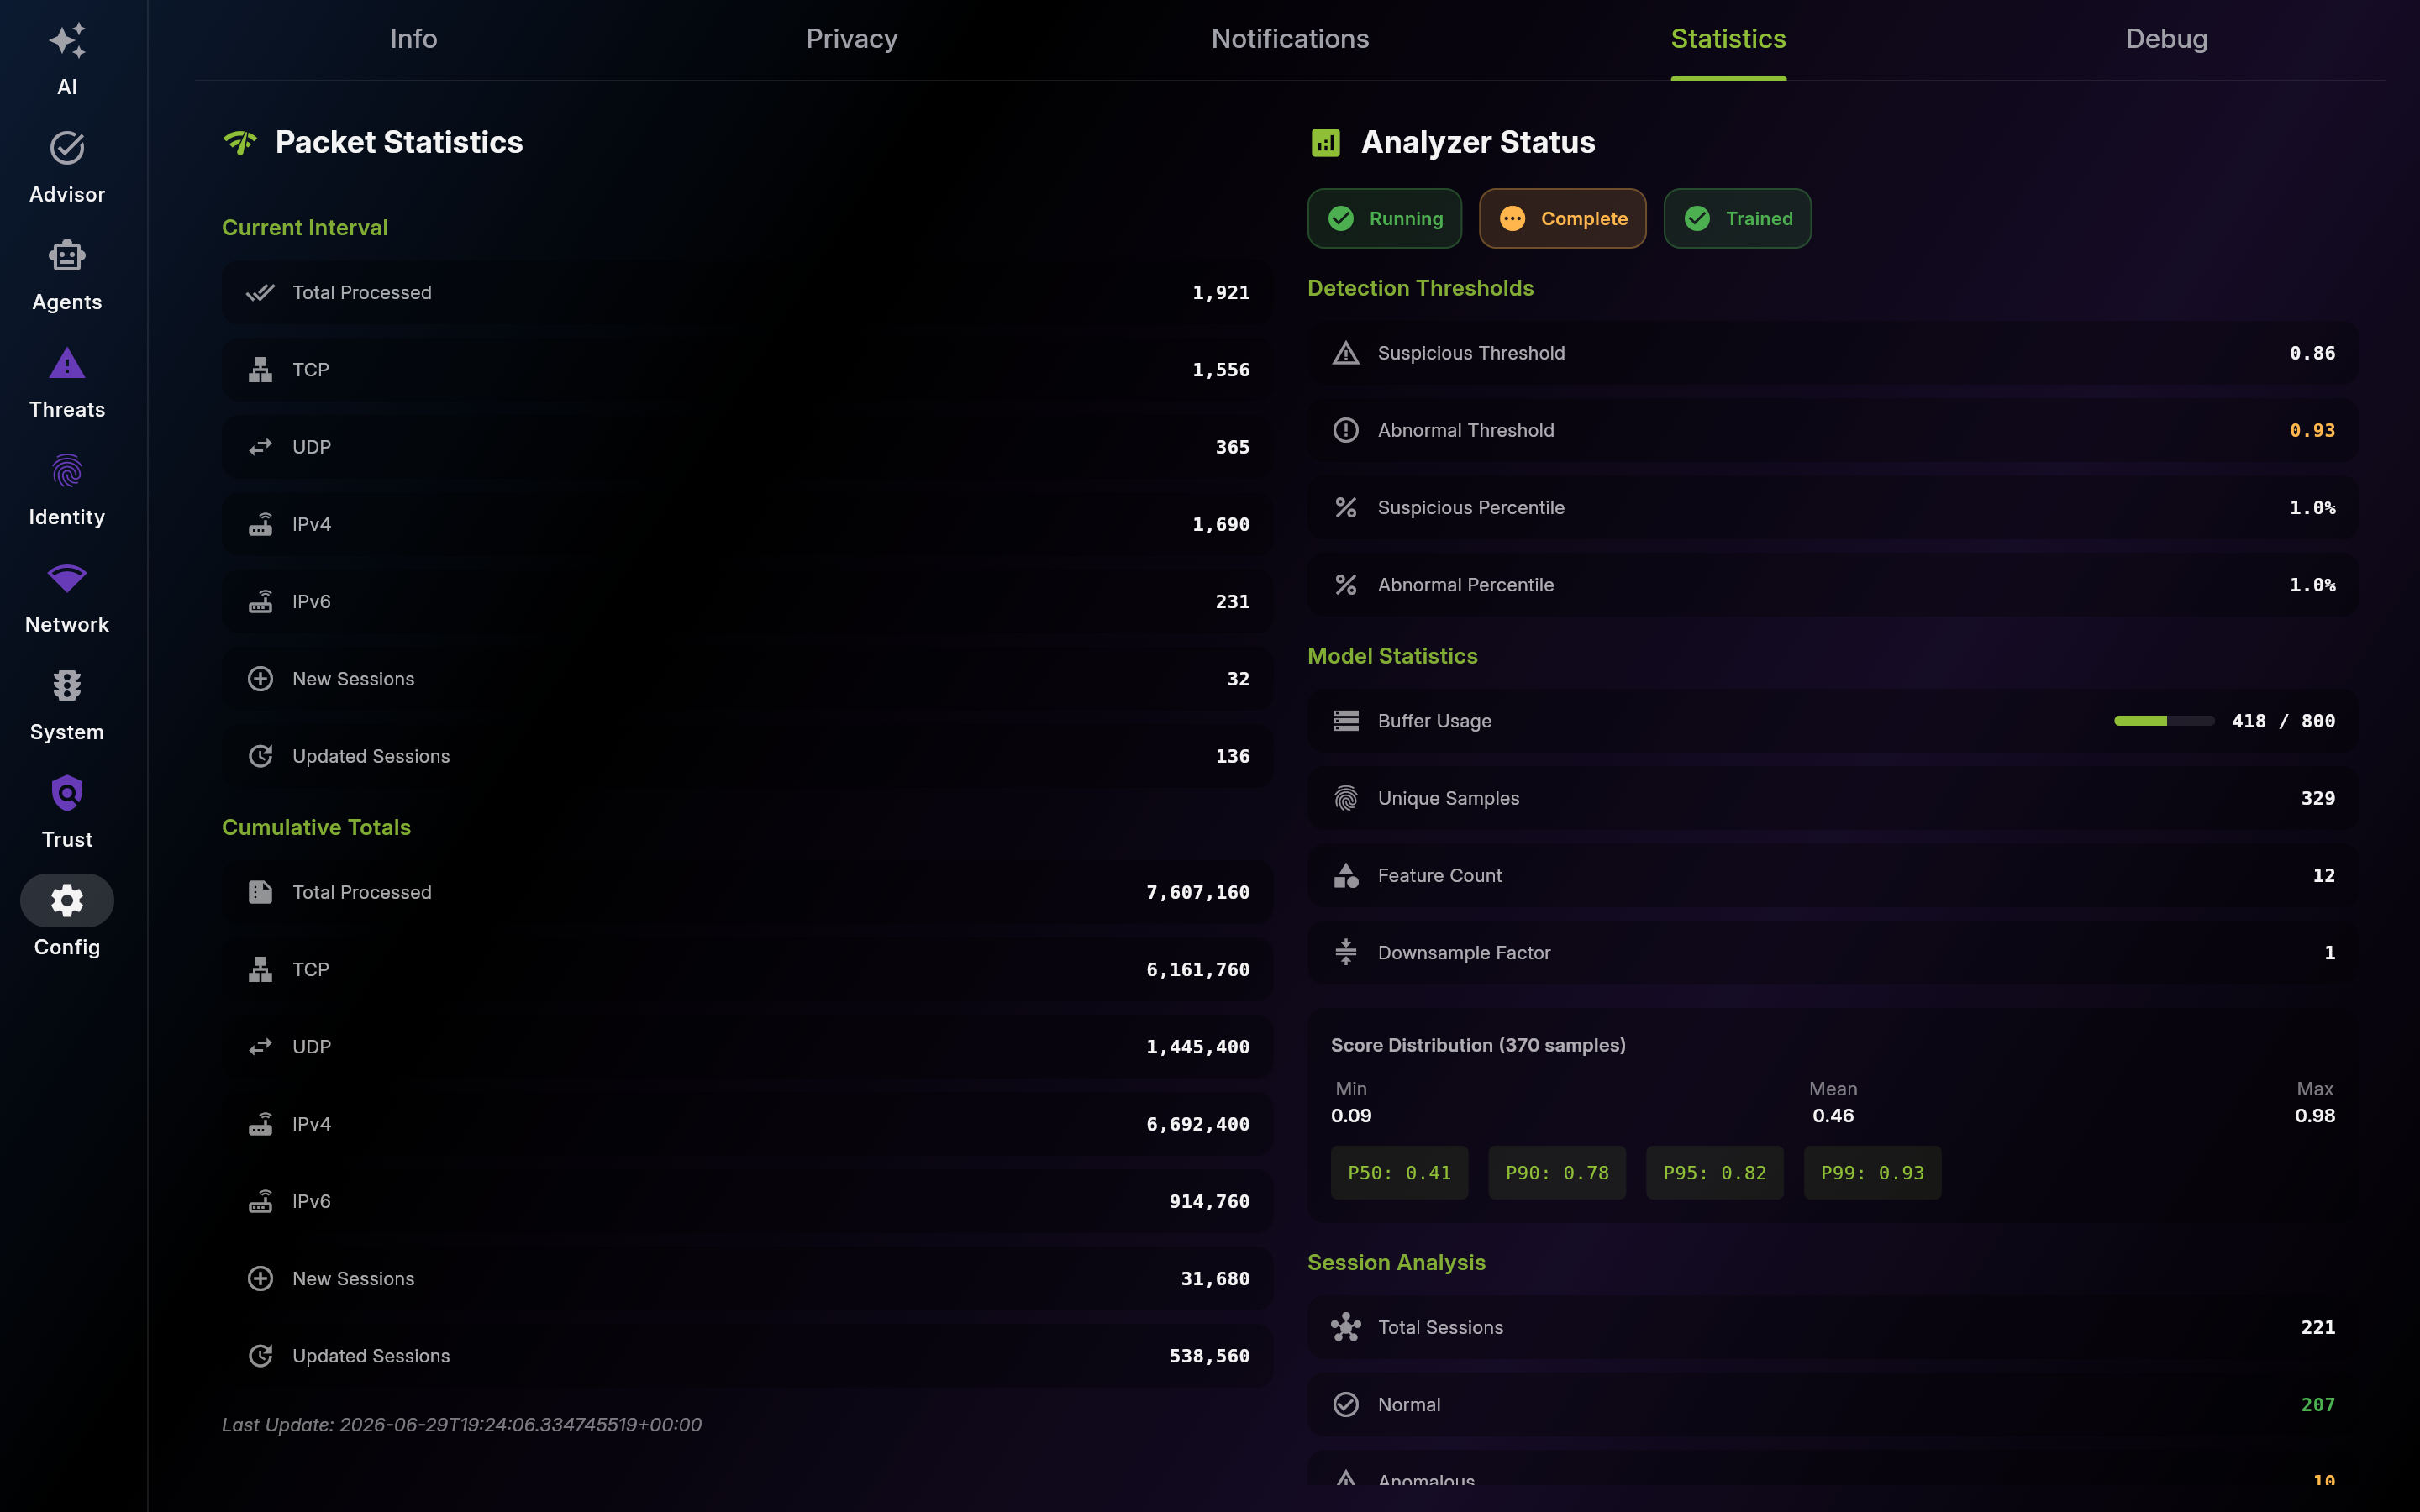
Screenshot of Statistics – Network, Files & Agentic Telemetry (Desktop)
Statistics – Network, Files & Agentic Telemetry (Desktop) — full page (scroll to see every section)
Part 2 of 6
Part 3 of 6
Part 4 of 6
Part 5 of 6
Part 6 of 6
Description: Use Debug logs for root-cause analysis with support or engineering. Filter by severity, search by keyword, and export relevant excerpts.
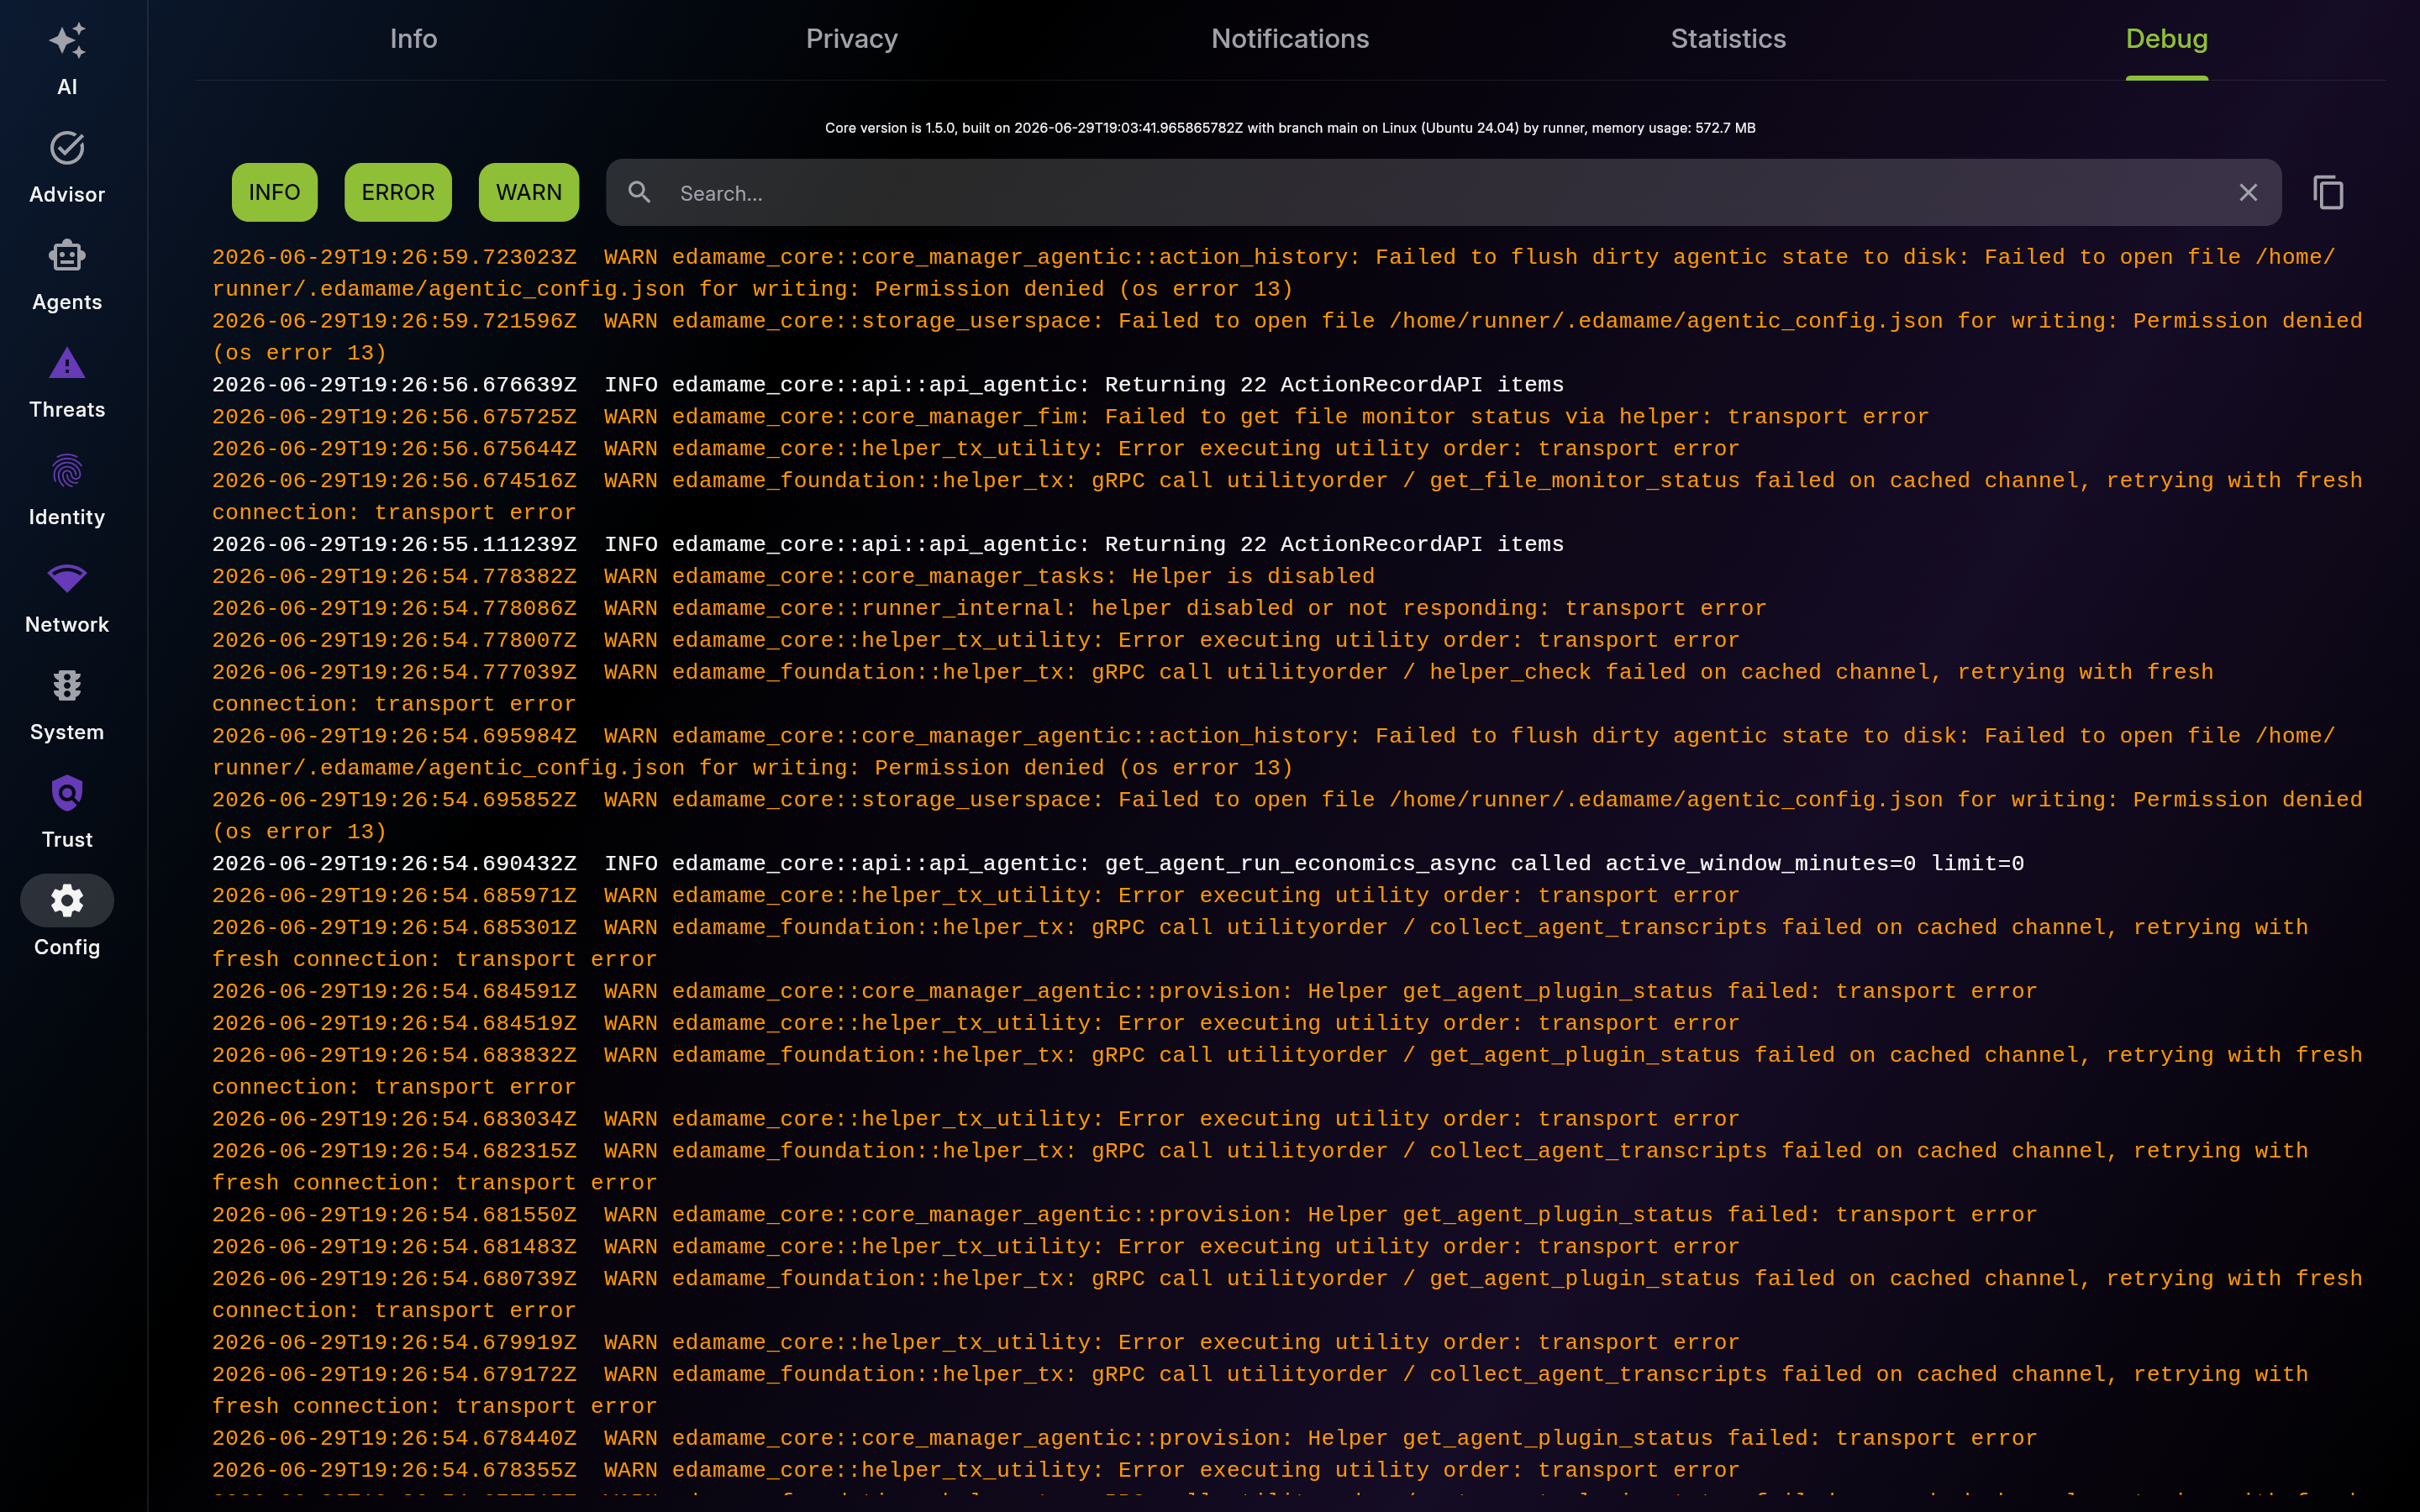
Screenshot of Debug – Real-Time Logs
This page was automatically generated from feature definitions.