Admin Panel and Dashboard
OBEY API Gateway ships with two embedded web UIs — an Admin Panel for configuration management and a real-time Dashboard for monitoring.
The Admin Panel provides a visual interface for managing all gateway configuration without editing YAML files.
URL: http://localhost:8080/admin (configurable via admin.path)
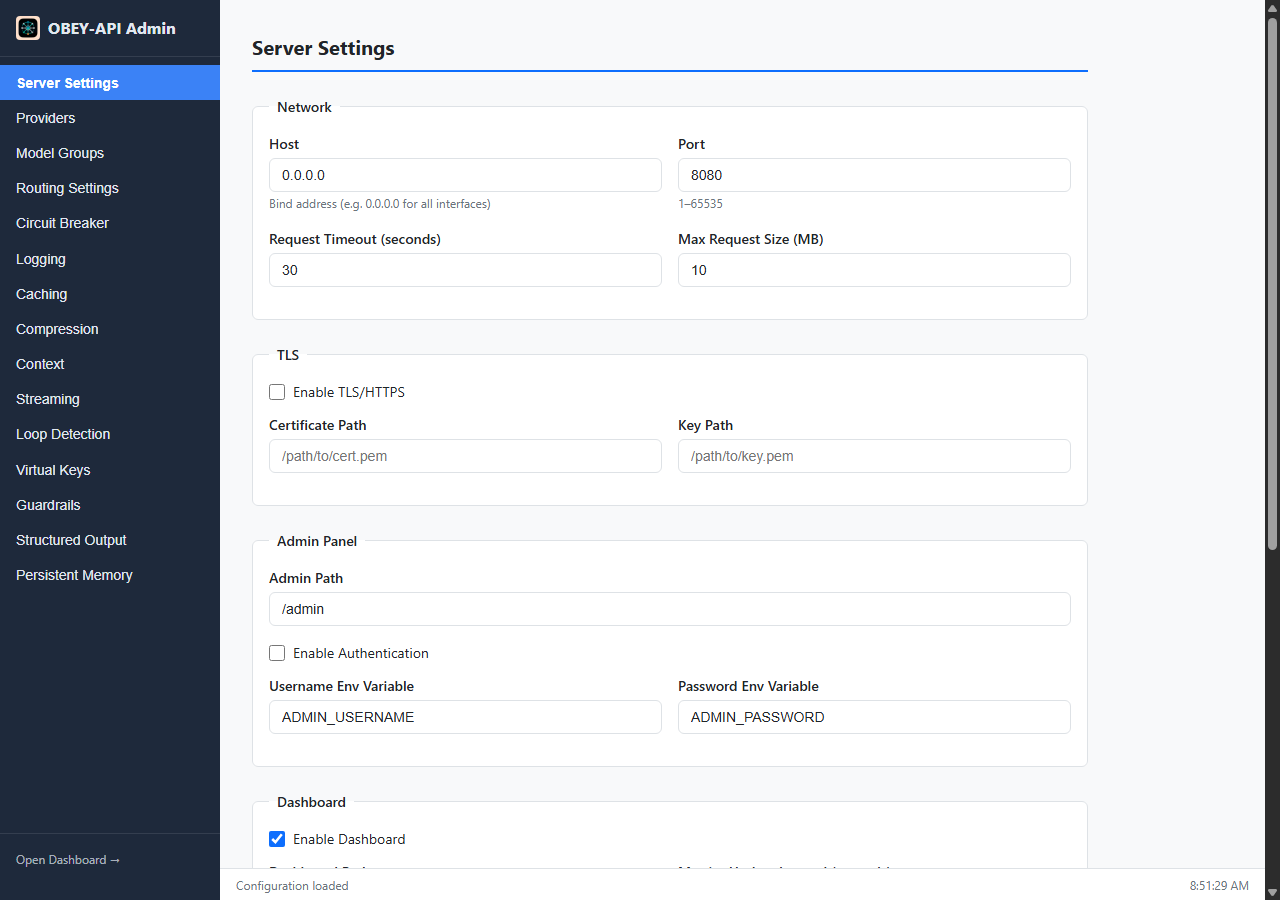
| Tab | Purpose |
|---|---|
| Server Settings | Host, port, timeouts, TLS, admin auth, dashboard, Prometheus, Codex backend URL |
| Providers | Add/edit/remove providers, configure API keys, timeouts, connection pools |
| Model Groups | Define model groups, priority ordering, per-model cost and tier |
| Routing Settings | Retry policy, Cache-Aware Routing, Reasoning Compatibility, CORS |
| Smart Routing | Complexity-aware tier selection, classifiers, cascade, budgets, ONNX assets, simulation |
| Circuit Breaker | Failure thresholds, backoff sequences, success thresholds |
| Logging | Log levels, retention, body logging, excluded fields |
| Caching | Exact cache and semantic cache settings |
| Compression | Token compression levels, engines, pipelines, perplexity/ONNX assets |
| Context | Context window management, truncation strategy |
| Streaming | SSE reliability configuration, keep-alive, truncation retry |
| Loop Detection | Session tracking, confidence thresholds, signal weights, enforcement |
| Virtual Keys | Key creation, management, budgets, rate limits, usage tracking |
| Guardrails | Quick Setup wizard, custom rules, Advanced pipeline configuration |
| Structured Output | JSON Schema validation settings, retries, passthrough providers |
| Persistent Memory | Memory store config, browser, extraction, vector search, live stats |
| Button | Action |
|---|---|
| Save | Validate and apply changes (hot-reload) |
| Reset | Revert form to current saved state |
| Reload Config | Re-read config.yaml from disk |
| Export YAML | Download current config as YAML file |
| Import YAML | Upload and apply a YAML config file |
admin:
  enabled: true
  path: "/admin"
  auth:
    enabled: true
    username_env: "ADMIN_USERNAME"    # Env var name
    password_env: "ADMIN_PASSWORD"    # Env var name
When auth is enabled, all admin endpoints require HTTP Basic Auth. Credentials are resolved from environment variables at runtime.
The Dashboard provides real-time metrics, provider health, and log viewing via WebSocket updates.
URL: http://localhost:8080/dashboard (configurable via dashboard.path)

| Tab | Purpose |
|---|---|
| Metrics Overview | Total requests, avg response time, request rate, active requests, cost, cache hit rate, real-time charts |
| Provider Health | Per-provider circuit breaker status, latency, error rates |
| Cost Breakdown | Spending by provider and model |
| Compression | Token compression events/timelines, tool compression statistics (reduction ratio, pruning, feedback levels, progressive disclosure) |
| Recent Errors | Latest error logs with details |
| Memory | Persistent memory events timeline (injections, extractions, evictions), event type distribution, namespace activity |
| Log Viewer | Searchable, filterable request log table with body viewing |
The dashboard connects via WebSocket for live updates (configurable interval):
dashboard:
  enabled: true
  path: "/dashboard"
metrics_update_interval_seconds: 1| Metric | Description |
|---|---|
| Total Requests | Cumulative request count since startup |
| Avg Response Time | Rolling average latency |
| Request Rate | Requests per minute |
| Active Requests | Currently in-flight requests |
| Cumulative Cost | Total USD spend across all providers |
| Cache Hit Rate |
N/A until first eligible request, then percentage |

Shows per-provider:
- Circuit breaker state (Closed/Open/Half-Open)
- Average latency
- Error rate
- Request count

Features:
- Filter by date range, provider, model, status code, trace ID
- Configurable result limit
- Request/response body viewing (when body logging enabled)
All admin functionality is also available programmatically:
# Get current config
curl http://localhost:8080/admin/config

# Update config (validate + write + apply)
curl -X PUT http://localhost:8080/admin/config \
  -H 'Content-Type: application/json' \
  -d '{ ... }'

# Validate without applying
curl -X POST http://localhost:8080/admin/config/validate \
  -H 'Content-Type: application/json' \
  -d '{ ... }'

# Hot-reload from disk
curl -X POST http://localhost:8080/admin/config/reload

# Export YAML
curl http://localhost:8080/admin/config/export

# Import YAML
curl -X POST http://localhost:8080/admin/config/import \
  -H 'Content-Type: application/yaml' \
--data-binary @config.yamlcurl http://localhost:8080/admin/keys # List
curl -X POST http://localhost:8080/admin/keys # Create
curl http://localhost:8080/admin/keys/{id} # Get
curl -X PATCH http://localhost:8080/admin/keys/{id} # Update
curl -X POST http://localhost:8080/admin/keys/{id}/revoke # Revoke
curl -X DELETE http://localhost:8080/admin/keys/{id} # Deletecurl -X POST http://localhost:8080/admin/oauth/openai/login # Start login
curl http://localhost:8080/admin/oauth/openai/status # Check status
curl -X POST http://localhost:8080/admin/oauth/openai/logout # Logoutcurl http://localhost:8080/dashboard/metrics # Current metrics snapshot
curl http://localhost:8080/dashboard/errors # Recent errors
curl "http://localhost:8080/dashboard/logs?limit=100&provider=openai" # Filtered logscurl "http://localhost:8080/admin/memory/entries?namespace=user::project::myapp" # List entries
curl -X POST http://localhost:8080/admin/memory/entries \
-H 'Content-Type: application/json' \
-d '{"namespace":"user::project::myapp","memory_type":"fact","content":"Uses React 19"}'
curl -X DELETE http://localhost:8080/admin/memory/entries/{id} # Delete entry
curl -X DELETE http://localhost:8080/admin/memory/namespaces/{namespace} # Clear namespace
curl http://localhost:8080/admin/memory/stats # Store statistics
curl http://localhost:8080/admin/memory/projects # Detected projectscurl http://localhost:8080/admin/onnx/status # Model/runtime readiness
curl -X POST http://localhost:8080/admin/onnx/install \
-H 'Content-Type: application/json' \
-d '{"model_path":"./models/perplexity_scorer.onnx"}' # Install assets# Get current tool compression statistics
curl http://localhost:8080/admin/tool-compression/stats
# Get feedback loop state per model group
curl http://localhost:8080/admin/tool-compression/feedback
# Test compression against a tools array without sending to a provider
curl -X POST http://localhost:8080/admin/tool-compression/test \
-H 'Content-Type: application/json' \
-d '{"tools": [...], "model_group": "gpt-4-group"}'# List active sessions (paginated)
curl "http://localhost:8080/admin/loop-detection/sessions?limit=50&offset=0"
# Get full session detail
curl http://localhost:8080/admin/loop-detection/sessions/{session_id}
# Reset a session's enforcement state
curl -X POST http://localhost:8080/admin/loop-detection/sessions/{session_id}/reset
# Aggregate statistics
curl http://localhost:8080/admin/loop-detection/statscurl -X POST http://localhost:8080/admin/metrics/reset-active # Reset active request counter# Test connectivity to a provider (validates URL + auth)
curl -X POST http://localhost:8080/admin/test-connection \
-H 'Content-Type: application/json' \
-d '{"provider_name": "openai"}'
# Proxy provider's /v1/models endpoint (for model discovery in the UI)
curl http://localhost:8080/admin/providers/models?provider=openaiConfiguration can be changed and applied without restarting the gateway:
- Via Admin Panel — edit settings and click Save
-
Via API —
POST /admin/config/reloadto re-read from disk -
Via PUT —
PUT /admin/configto validate, save, and apply in one call
On reload:
- All circuit breakers are reset
- New provider settings take effect immediately
- Active requests complete with old settings
For integration with existing monitoring infrastructure:
prometheus:
  enabled: true
  path: "/metrics"
Exposes standard Prometheus text format at http://localhost:8080/metrics.
Key metrics include:
obey_api_requests_total{provider, model, status}obey_api_request_duration_seconds{provider, model}obey_api_cache_hits_total{tier}obey_api_circuit_breaker_state{provider}obey_api_guardrail_stage_executions_total{pipeline, stage, provider, action}obey_api_guardrail_stage_latency_ms{pipeline, stage, provider}
- Configuration — full config reference
- Virtual Keys — key management details
- Guardrail Pipelines — policy enforcement