Repository navigation
Home
Polaris monitors your network and the devices on it, and keeps one inventory of what those devices are. It builds that inventory from the systems you already run, watches every device in it, and tells the right people when something breaks — once, rather than once per symptom.
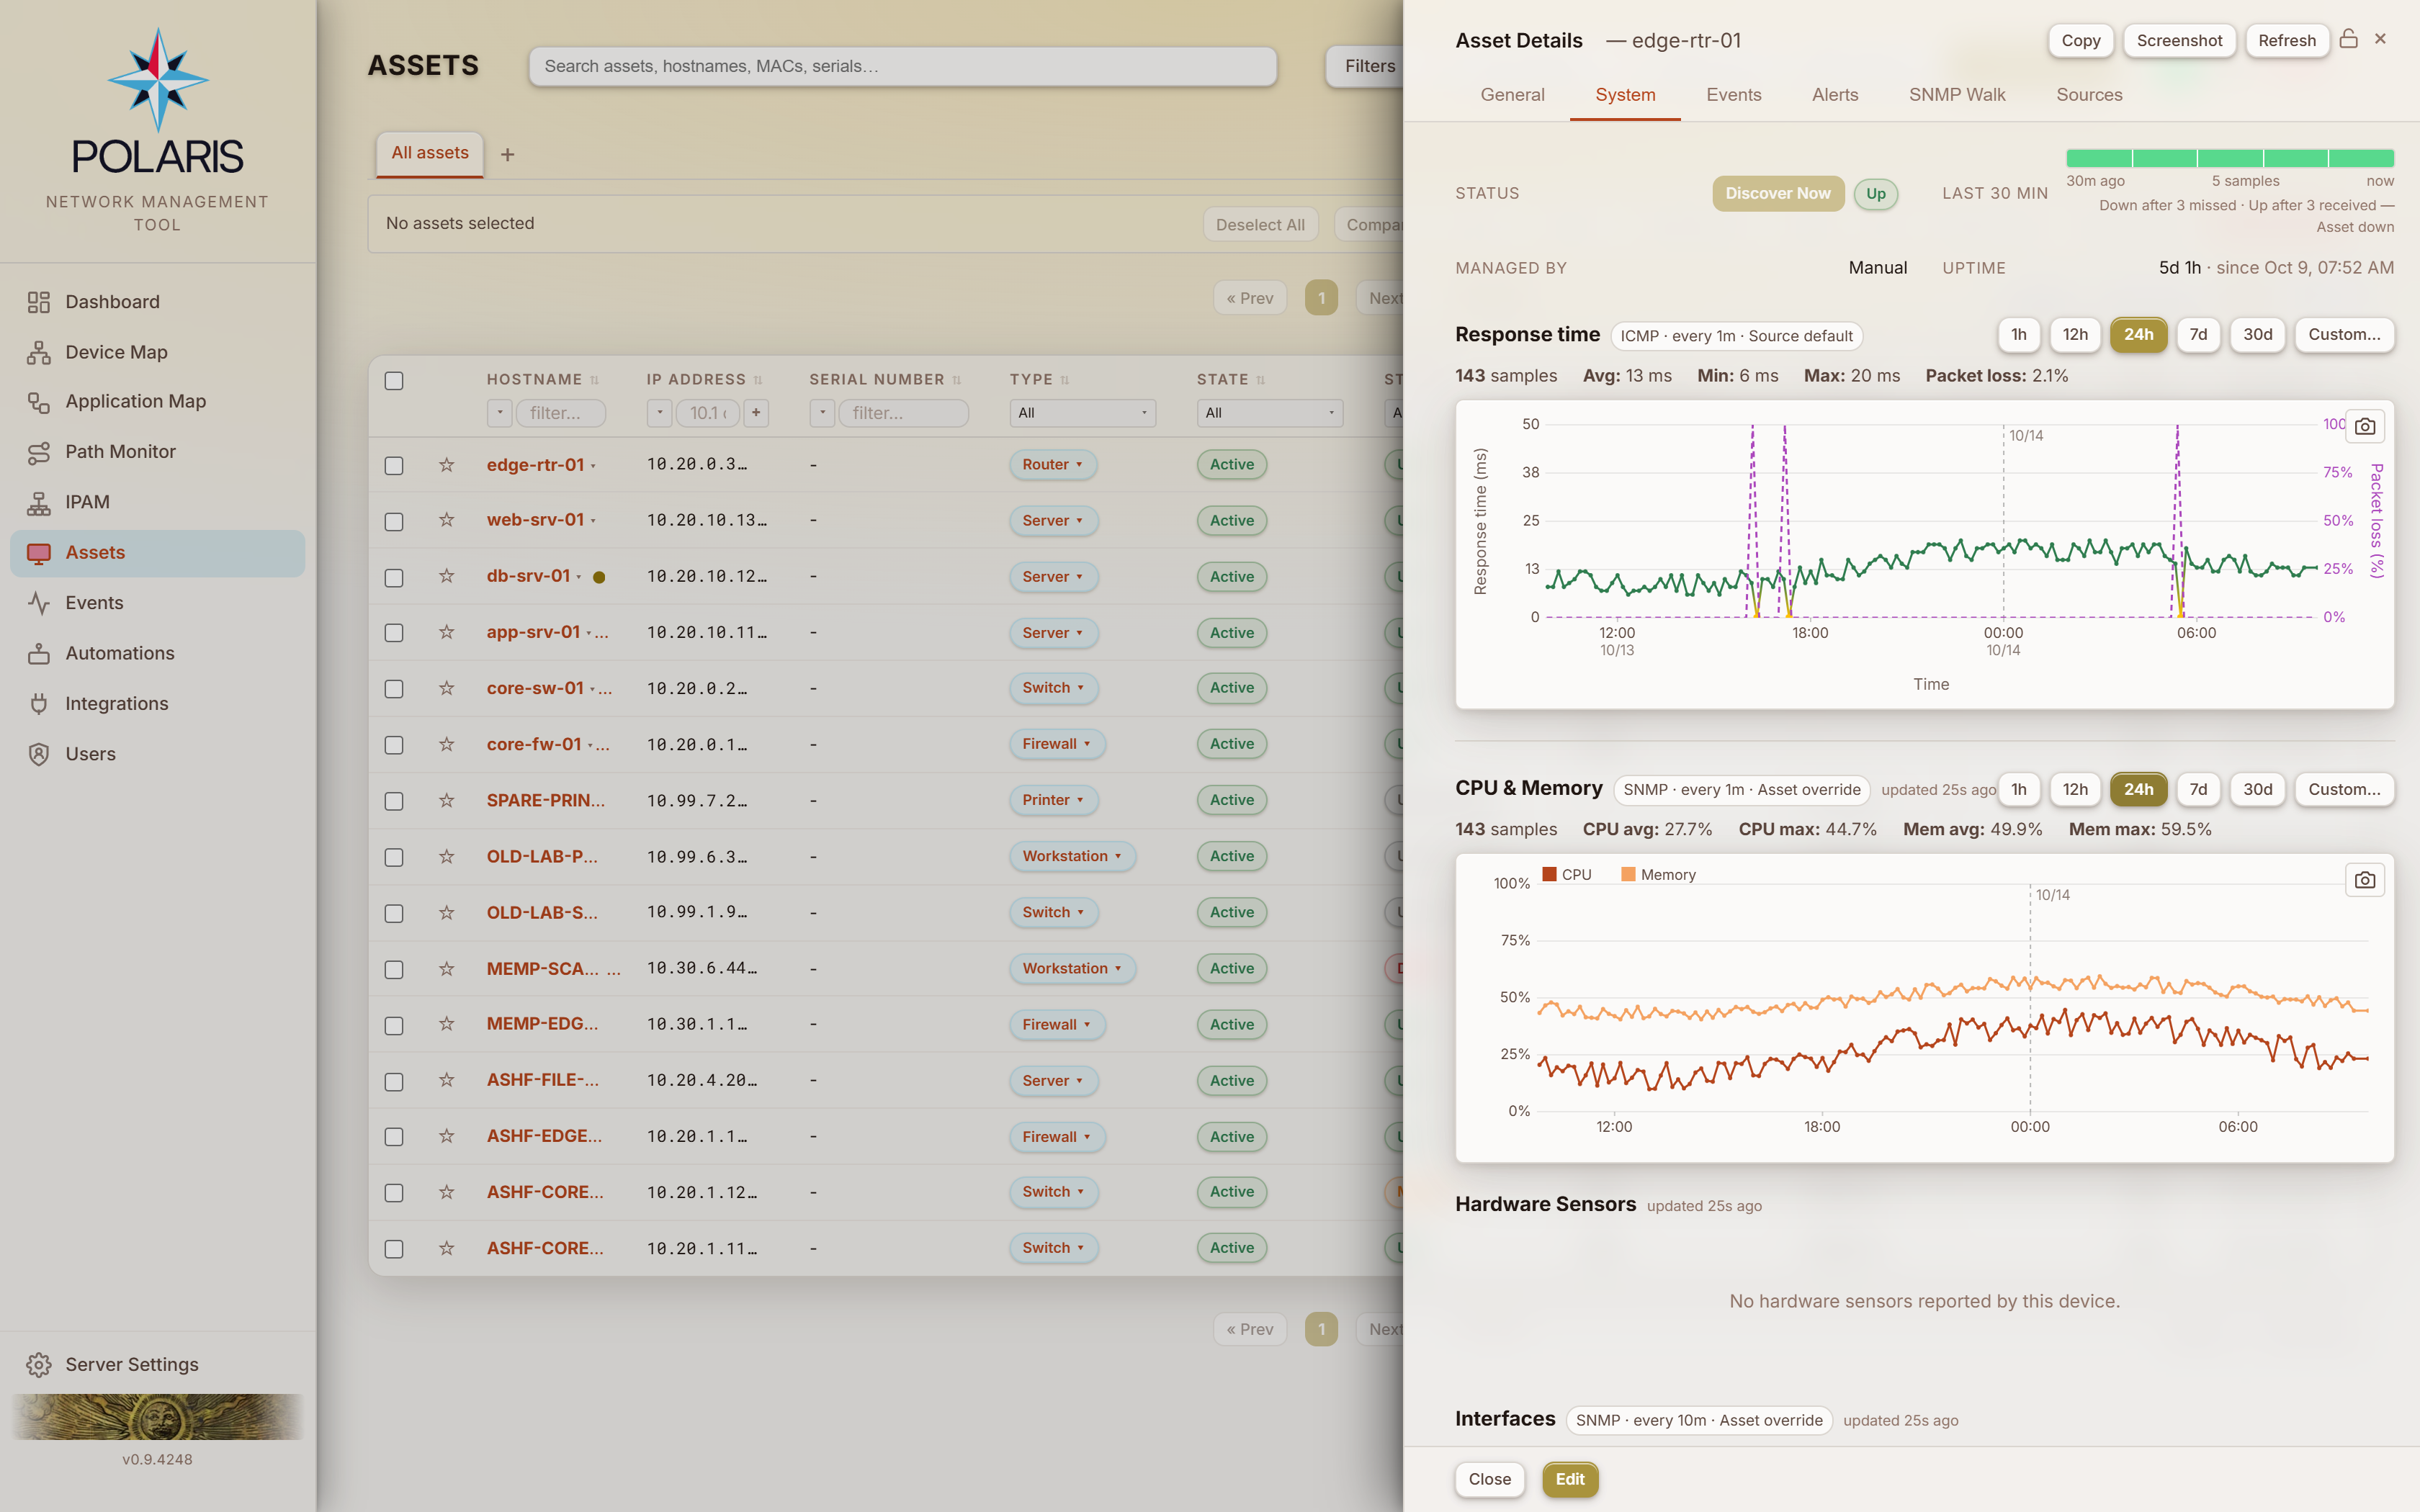
Eight independent telemetry streams — response time, CPU/memory, hardware sensors, interfaces, LLDP, storage, processes, event logs — each on its own cadence, over FortiOS REST, SNMP, SSH, WinRM, ICMP, the hypervisor and NAS APIs, or the optional Polaris Agent. See Monitoring.
- Down is a verdict, not a missed ping. Misses accumulate in a bucket, recovery takes a known number of good polls, and how many misses make "down" is a property of the alert you wrote. See Monitor states.
- One outage, one alert. Everything behind a device that is down is suppressed, so a dead core switch pages once. See Dependency suppression.
- Quiet when it should be — maintenance windows, ad-hoc holds, and the holds Polaris takes on itself while it reboots or upgrades a device. See Maintenance windows.
- What talks to what. The Application Map draws the traffic the agent observes between processes and services on your hosts.
Automations watch a metric, a device state, an event or a change; raise an alert at a severity; notify people by email, push or webhook; escalate when nobody acknowledges; and run a script, call an API or book a reboot if you want them to. See Triggers · Actions · Escalation.
Eleven integration types — FortiManager, FortiGate, Entra ID / Intune, Active Directory, Windows DHCP, vCenter, Azure Arc, Unraid, TrueNAS SCALE, Proxmox VE, and the build-your-own Generic API — fill the inventory and can add what they find as monitored. See Discovery.
An asset that AD, Intune, Azure Arc and a FortiGate all know about is one row carrying four sources, and every field shows the answer from whichever source is most trustworthy for that field — not whichever system wrote last. Where they genuinely disagree, you get a conflict rather than a silent overwrite. See Assets.
Path Monitor checks reachability from where your users sit. The Device Map draws each site's Fortinet topology. IPAM keeps a full address registry — blocks, networks and reservations, with overlaps refused. Polaris can push DHCP reservations and MAC quarantine to FortiGates, upgrade firmware and reboot devices, and answer questions through an AI assistant connected to a model you run.
| If you are… | Start at |
|---|---|
| installing Polaris for the first time | Installation → First-run setup |
| new to an install someone else built | Concepts → Getting around |
| trying to get alerted about something | Automations → Triggers → Actions |
| wondering why a device reads up, down or grey | Monitor states → Dependency suppression |
| choosing how a device is polled | Monitoring → Polling methods |
| trying to get devices into inventory | Discovery → the page for your integration |
| wondering why Polaris decided something | Business rules — every numbered decision and the reasoning behind it |
| wiring Polaris into another system | REST API |
| holding a broken install | Troubleshooting |
Every screen has its own page, and every page answers three questions in the same order: what this screen is for, how to configure it, and the logic behind what it decides. The third one is where Polaris differs most from tools that look like it — a great deal of behaviour here is a considered rule rather than an accident, and the rules are written down.
Polaris is one Node.js application over one PostgreSQL 17 database with
TimescaleDB. It can run as a single process or split into four roles —
web, monitor, discovery, dash — sharing that database, which is how a
large fleet is scaled. TLS terminates wherever you put it: direct, behind
nginx, behind a corporate load balancer, or nowhere at all on a lab VM.
     browsers ─┐
     phones  ──┼─► nginx ─► polaris (web)  ─┐
     API     ──┘                            │
                                            ├─► PostgreSQL 17 + TimescaleDB
     polaris (monitor)  ── SNMP/SSH/REST ───┤
     polaris (discovery) ── FMG/Graph/LDAP ─┤
     polaris (dash) ── NOC wallboard ───────┘
Every integration is optional and absent by default — discovery is something you turn on, not something you turn off. An install with none at all still works: you enter assets by hand and monitor them over SNMP, SSH, WinRM, ICMP or the agent. But an integration is what saves you typing in the fleet, and an install with one is worth more than an install with none.
The version in the sidebar reads <major>.<minor>.<commit count>. The major
and minor live in package.json; the patch is the git commit count, computed
at runtime. It is embedded in backup filenames, so a backup always names the
build that produced it.
Polaris is written to work at both ends of a wide range — a lab with one device and a fleet with two thousand. Where a setting's right value depends on fleet size, the page for that setting says so. Where a figure is measured on your install rather than assumed, the screen showing it says that too.