Repository navigation
Automations
An automation is the whole unit: which devices, what to watch, at what severity, what to do about it, and when it resets. Automations are what make Polaris a monitoring tool rather than an inventory.
| Gate | Grants |
|---|---|
automationManagement:read |
see the page, preview, export, view code |
automationManagement:write |
create, edit, clone, delete, run test deliveries |
automationScripts:read / :write
|
the Scripts tab; attaching a script action needs write |
contacts:read |
the Address Book tab |
alerts:read / :write / :fullwrite
|
see alerts / acknowledge / clear |
Read these in order: this page, then Triggers and conditions, then Actions and recipients, then Escalation, reminders and quiet time.
Five tabs:
| Tab | Holds |
|---|---|
| Automations | the list, with an enable toggle per row |
| Delivery | the delivery-channel registry |
| Alert Groups | automations whose alerts about one device become one alert — below |
| Scripts | the script registry |
| Address Book | contacts and the directory |
The Settings button beside + New automation opens the automation
settings. Its one tab, Global Quiet Times, lists the quiet periods that
apply to every automation without a quiet time of its own: which devices, which
severities and kinds of alert, when, and how the summary email goes out. + New
quiet time walks the same five steps the automation wizard does — Name,
Devices, Alerts, Schedule, Review. The list shows whether each one is quiet right
now and when it next will be, and below it the recent summary emails. Reading
needs automationManagement:read; creating, editing, toggling and deleting need
write. See Quiet time.
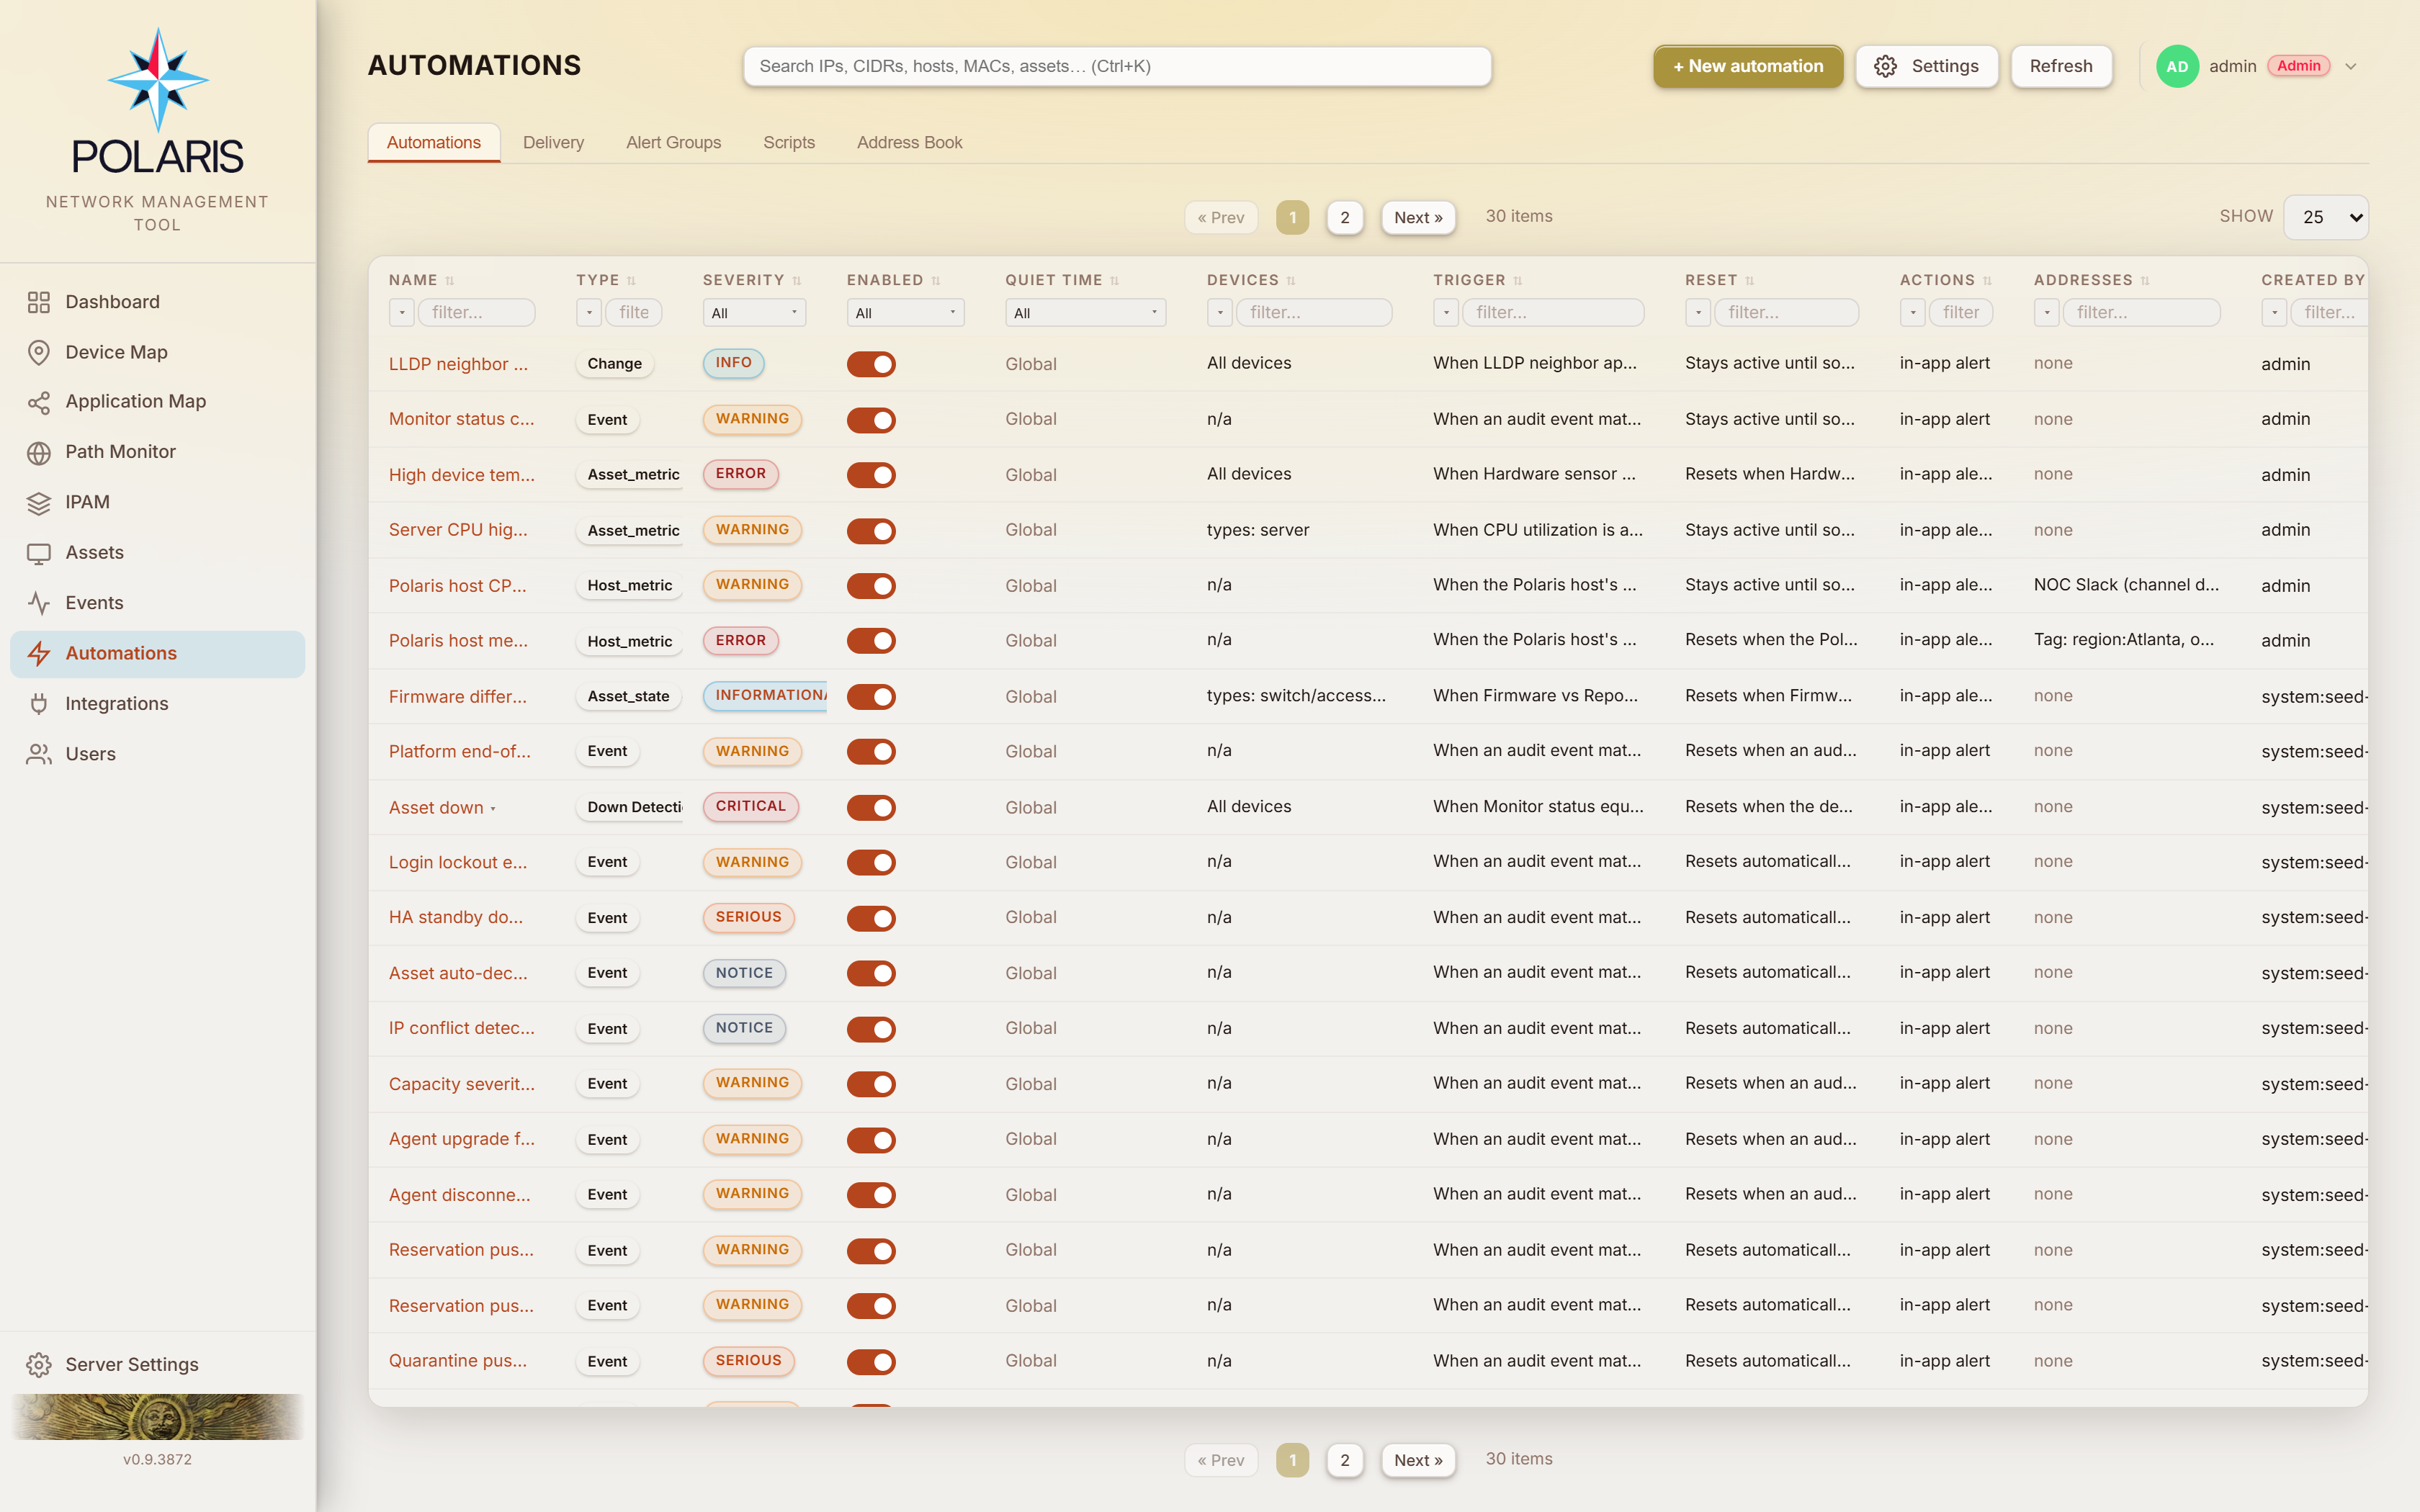
Columns: Name · Type · Severity · Enabled · Quiet time · Devices · Trigger · Reset · Actions · Addresses · Created by.
Quiet time shows what the automation's Quiet time step says: Global (the global quiet times apply), IGNORES GLOBAL (no quiet time at all — it sends whatever the hour) or OVERRIDES GLOBAL (its own quiet time; hover for the schedule). Filter on it to see which automations page through the night.
Devices, Trigger, Reset and Actions each hold that part of the automation in the builder's own words, so two automations can be told apart without opening either. Trigger and Reset come from the same sentence factory the wizard renders its own steps from — a second phrasing here is how the list and the editor would come to describe one automation differently.
Addresses answers the question the other four cannot: who does this automation actually reach? The cell is the flat deduplicated address list, so filtering it answers "every automation that mails Jane". Hovering breaks it down by where each recipient is declared — the base notification, each severity band, each escalation tier, the all-clear, the reset — with the delivery channel on each group.
A chat or webhook channel posts to its own destination, so its action shows the channel rather than people who would never receive it.
Type is the narrow trigger-kind column. It stays because prose cannot be filtered by kind.
Severity shows the automation's one severity — unless it has severity bands, in which case the pill reads Escalation, coloured by the base severity (the first tier it fires at). Hovering it lists the ladder, e.g. Warning → Serious (20) → Critical (30). The column's filter and sort use that base severity.
Clicking an automation's name opens a menu: Edit, Clone, View
code, Export, Delete. Below automationManagement:write the name
renders as plain text and the Enabled column as a static label.
Clone pre-fills the wizard, saves as a create, names it <name> (copy), and
is created disabled. That is not politeness: two automations with the same
trigger signature at the same scope rank both fire
(rule 18), so an identical enabled clone would
double-alert the matched fleet.
Sort, filters, column widths and visibility, and page size persist per user and are restored before the first render, so the initial paint carries your setup rather than flashing defaults.
| Step | What it asks |
|---|---|
| 1 — Name | name, description, and (when creating) Import from file… |
| 2 — Devices | which devices this automation covers |
| 3 — Trigger | severity, then what to watch |
| 4 — Reset | what has to become true again |
| 5 — Actions | the in-app alert, then notify / API call / script / event / reboot |
| 6 — Quiet time | Off (the global quiet times apply), Ignore Global Quiet Time or Override Global Quiet Time — see Quiet time |
| 7 — Summary | review, export, view code, test delivery, and the impact preview |
You can navigate freely to any step you have visited; in edit mode every step is unlocked. An unsaved new automation stashes in memory with a restore prompt.
There is no enabled control in the wizard — enabling is the list's toggle.
Import from file… (create only — never offered while editing, where replacing the open automation would be a data-loss trap). The file is read in the browser.
Two things always happen on import:
- The file's name becomes the automation's name.
- It is created disabled, whatever the file says — the same same-signature reasoning as Clone.
A banner lists the file's declared dependencies as present / missing / can't-tell against this install, and names which later steps need attention. Actions always need attention, because an exported file carries no delivery wiring. See Export and import.
A default-checked "All assets" checkbox. Unchecking it reveals the nested condition builder: a root group with AND / OR / NONE / NOT-ALL combinators, rows of field + operator + value with a click-to-suggest combobox, sub-groups up to 5 deep, and drag-and-drop between groups by the grip handles.
Unchecked and empty is a validation error — never silently "all assets".
A debounced preview shows the devices currently matched.
Subnet / IP matches a device by its primary IP address, three ways — the operator decides which, and each has its negation:
| Operator | Value | Matches when the device's IP is… |
|---|---|---|
| is within CIDR |
10.20.0.0/16, or a bare IP (one address) |
inside that network |
| is within range |
10.20.0.10-10.20.0.50, or the short 10.20.0.10-50
|
between the two addresses, both included (IPv4) |
| is in subnet named | an IPAM network name; * and ? are wildcards, case does not matter |
inside any active network whose name matches |
The value box suggests networks for CIDR and network names for a name, and
clears itself when you switch to an operator that takes a different kind of
value. A name rule follows the IPAM registry: Plant-* also covers a plant
network added next month, and a renamed network reaches the rule within a
minute. Deprecated networks never match. Every value is checked when you save —
a backwards range or a malformed CIDR is refused, not stored. IP block
takes a CIDR only. The same field and operators appear in every device filter:
alert groups, the Address Book, mass pinning and tag
auto-assignment.
The step is per trigger. A trigger type the catalogue marks unscoped has
its filter discarded at save. Today that is host_metric and a host-kind
composite — those are about the Polaris server, not about your devices. The
step's lead line says which case you are in. event automations are scoped
(rule 46). A
Path Monitor automation only ever watches
devices with the Polaris Agent installed: the filter narrows those, and the
preview counts only them.
An alert group is a named set of automations whose alerts about the same device become one alert (rule 75). A switch whose power supply fails can trip a PoE-fault automation on eight ports and an uplink-down automation at the same moment; in a group that is one alert naming everything wrong, one acknowledgement, and one page at 02:00 instead of three.
The split is the whole idea:
- Each automation still decides what counts as a problem — its devices, trigger, holds, severity bands and reset are unchanged.
- The group decides who hears about it — its recipients, escalation chain, reminders, acknowledge-note policy and email. While an automation is in a group, its own recipients are not used for alerts the group governs.
The editor holds a name, an Active switch, One alert per (Device, Automation, Device + automation or Subnet), a Which devices filter, the member list, the alert text, Require a note when acknowledging and Remind while unhandled.
-
Members. Every automation is listed; one that cannot join says why rather
than being left out. An automation can be in one group at a time, and only
one that watches something it can keep checking — a metric, a state, or a
multi-condition device trigger. Event and change automations cannot join:
they fire on a single moment, so Polaris could never tell when their part in
a shared alert had ended. In a Device or Device + automation group, a metric or state that
is about the whole device (such as
monitorStatus == down) cannot join either — it already raises one alert per device, so there is nothing to fold; the picker suggests one alert per automation or per subnet instead. The list is re-checked whenever you switch One alert per. - Which devices. Narrows where the folding applies, never what a member watches. On a device outside the filter, a member alerts on its own exactly as it would outside the group — which is how one set of automations can serve several groups routed to different people.
- Recipients are copied once, from the first member that has any, the first time the group is saved with none of its own — together with that automation's escalation chain, email layout and reset actions. Changing that automation afterwards does not change the group. This screen cannot edit recipients or escalation yet; change them through the API.
- Turning a group off does not turn its automations off: they go back to alerting on their own. Deleting one does not delete them either, and the confirmation names any member that has no recipients of its own and would go quiet.
Adding or removing a member, changing the device filter, switching One alert per, and turning off or deleting a group all end the affected live alerts; the next check raises them again under whoever now delivers them.
A grouped alert — from a group, or from an automation set to one alert per device — shows up in Polaris the moment it opens, but its first email waits one polling interval of whatever opened it: the device's poll interval for that reading, or a path check's own interval. Anything that fails in that time joins the alert and is in the first email. The wait comes after the automation's own for N polls: an automation that waits 3 polls of a 5-minute path check opens its alert at 15 minutes and emails at 20.
While it waits, nothing else is sent either — no updates, no escalation, no reminders (those count from the first email). An alert that recovers before its first email sends nothing at all, not even "Resolved".
After the first email, updates go at most once per interval too. A device
that joins the alert, comes back after recovering, or recovers while others are
still affected is not emailed straight away. Polaris collects the changes and
sends one [UPDATED] email naming all of them — +pc-03, −pc-01 in the
subject, "pc-03 joined this alert; pc-01 recovered" at the top — one interval
after the previous email. A device that joins and recovers inside the same
interval is left out. A worse severity band is still emailed at once.
One alert per decides what a single alert stands for:
| Choice | One alert per | Members listed |
|---|---|---|
| Device | device — everything the group's automations find on it | the components (ports, tunnels…) |
| Automation | automation — every device it trips, together | the devices |
| Device + automation | device, separately for each automation | that automation's components |
| Subnet | network — every device in it, together | the devices |
Automation suits a check you want to hear about once however widely it
fires — "Device down: 5 devices — sw-01, sw-02, …". The alert is named after
the automation, ends when the last device recovers, and (like Subnet) also
accepts automations about the whole device, such as monitorStatus == down.
A Path Monitor automation gets one alert per path check rather than one
for every check it watches — "Path Monitor — ERP HTTPS: 3 devices — pc-01,
pc-02, pc-04" — with hosts added and removed as they fail and recover.
Device + automation keeps different checks apart on the same device — a PoE fault and a high temperature on one switch are two alerts — while each automation's own components still fold (eight faulted ports are one alert). Use it when you want the group's recipients and escalation over several automations without merging their alerts.
The groups list marks a group that folds any way but Device with a badge.
Set One alert per to Subnet and every device the group governs whose IP falls in the same IPAM network shares one alert, each device listed as a member. The network is the most specific active one containing the device's primary IP. A device in no recorded network still alerts, on its own. The groups list marks these groups per subnet.
The case it exists for is the device-down storm: a switch fails and every host behind it goes down or Dep. Down at once. With a subnet group that is one page — "Device down: 12 devices in Plant A (10.1.0.0/24) — …" — instead of twelve. The alert names the network as its device, carries the dependency headline when the first host is Dep. Down, and stays up until the last host recovers; a host that comes back earlier is marked as recovered in the member list. The alert email shows no per-port graph block, since its members are devices rather than components of one device.
To set it up:
- Open the automation that watches
monitorStatus == down(or create one — see Asset state). If hosts behind a failed switch should alert too, tick Dependency-Down Bypass on its Actions step. - On the Alert Groups tab, click New group, set One alert per to Subnet, and narrow Which devices if only some sites should fold.
- Tick the down automation in the member list and save. The group's recipients are copied from it the first time, as for any group.
Separately from groups, a single automation that watches something per component can raise one alert per device on its own — see Actions and recipients.
Two automations watch the same thing if their trigger signature matches. Among those, the one with the higher specificity rank carves out the devices it covers from every lower-ranked one (rule 18).
The ladder, least to most specific:
All assets < Device type < OS < Manufacturer < Model
          < Tag < Region < IP block < Subnet < Hostname
(An IP block contains subnets, so a block rule targets less precisely and loses the carve-out to a subnet rule over the same trigger. A Subnet / IP rule ranks as Subnet whichever way it names the addresses — CIDR, range or subnet name.)
When a higher-ranked automation carves a device out of a lower-ranked one, the
lower one's readings for that device are dropped, any active alert from it is
cleared as notification.superseded, and a pending debounce is reset.
Same-rank ties both fire. That is why Clone and Import create disabled.
event and change triggers are exempt — they neither carve out nor are
carved out.
monitorStatus is keyed by operator and value, not by device filter. It is a
single per-asset column, so every == down automation lands in one group
whatever its device filter — they have to be able to carve each other out. This
is also the group that decides whose missedPolls count governs each device
(rule 36), rather than inventing a second precedence
system.
The Summary step's preview shows both directions: which lower-ranked automations this one removes devices from, and which of its devices a more-specific automation already covers. Carved-out devices are counted in the warning box and left out of the row list — the list is what the automation will alert on.
An automation only fires about a device Polaris is actually polling
(rule 37). One gate, applied by every trigger path:
the asset must be monitored and not suppressed by a maintenance window or
dependency suppression.
Three consequences:
-
Un-monitoring a device clears its live alerts (
notification.out_of_scope), the same way leaving the scope does. Without that,monitorStatusis not cleared when monitoring stops and a== downautomation would keep firing forever about a shelved device. -
A deleted asset still fires. An
asset.deletedevent must not be swallowed by a gate about the row that no longer exists. - System-scoped events still fire — they carry no asset id.
Event and change triggers obey the gate too: firing about a device nobody polls would make "an automation covers it" and "Polaris watches it" two different answers.
Both on the Summary step and the name menu on the list.
Export produces a portable .automation.json. The dependencies block
comes first, because that is what a human opening the file reads: everything
install-specific is stripped from the rule and recorded there by name
instead — delivery channels, registry scripts, state probes, custom roles,
regions, tags, pinned devices.
That strip is also the security half. It carries no ids and no secrets:
dropping api_call actions is what keeps an api_call bearer token — stored
unmasked by design — out of a file operators email and commit. It also means an
imported file can never name a script action, so the RCE surface is
untouched and automationScripts:write is never involved. A
reboot action is stripped the same way and named in
dependencies, so an imported automation reboots nothing until someone with
Read-Write on Assets adds the action back.
View code is deliberately a different serialisation: full fidelity, ids and headers included, because an edit there must round-trip losslessly onto the same automation. The editor says so.
The code editor's PUT is a full replace. An absent nullable column becomes null;
enabled,severityandresetfall back to schema defaults — so deletingenabledtakes a disabled automation live. The editor renders the complete body, strips the redundant mirror fields, says that removing a key removes the setting, and confirms a diff with the destructive fields called out.
Step 7 (Summary) carries a Test delivery block (automationManagement:write;
omitted entirely otherwise), with one button per distinct delivery the draft
would perform: Send Test Web Push, Send Test Email, Send Test ,
Write a Test Event. Deduplicated by channel across base actions, band actions,
escalation tiers, resolved and reset actions.
- Each press creates a real
[TEST]alert and dispatches that one action immediately. -
The alert is about a made-up device, not one of yours
(rule 65). Hostname, IP, MAC,
location, model, description and the last-hour charts are all invented sample
data (
EXAMPLE-SWITCH-01at192.0.2.51, and so on), so a test email can be forwarded to a vendor or a colleague without carrying any of your inventory. It is attached to no asset, so it never appears on a real device's alert list. - It does appear in the Dashboard's Active Alerts widget, for up to an hour. Nothing can recover a test, so Polaris clears it automatically an hour after it fired. Until then the row carries a grey TEST pill beside its severity, so a wallboard doesn't read it as an outage. Clear it by hand if you don't want to wait.
-
It says so in three places —
[TEST]in the subject, a banner at the head of the body, and a line in the plain-text alternative. The marking is added at send time, so customizing the email template cannot remove it. - No reading is quoted. The headline states the condition you configured ("Response time (median over 5 minutes) is above 500 ms") rather than a number, because the only real number available would be some device's.
- Every button sends to you and nobody else. That is a server-side recipient rewrite, not a flag. There is no mode to choose, so this step cannot page anyone.
- The block names the address and push-device count the test will land on.
-
api_callandscriptare never offered — the server refuses to run them from a button. Neither isreboot: a test never reboots a device. - Webhook kinds (Slack, Teams, Pushbullet) are disabled here with a pointer to the Delivery tab's per-channel Test button: one Slack post reaches the whole channel, so there is no private form of it.
The confirmation reports how many devices this would leave with no down
detection at all — i.e. passive. It is the only thing that can warn about
a fleet going unjudged, since the automation being removed is what would
otherwise alert about it.
A fleet with zero down automations stamps a one-shot
monitor.down_detection_absent warning Event.
notice · informational · warning · serious · critical.
Severity is chosen at the top of the trigger step, and the step heading and the condition group border are accent-coloured to it, so the automation you are editing looks like what it will raise.