Repository navigation
Events
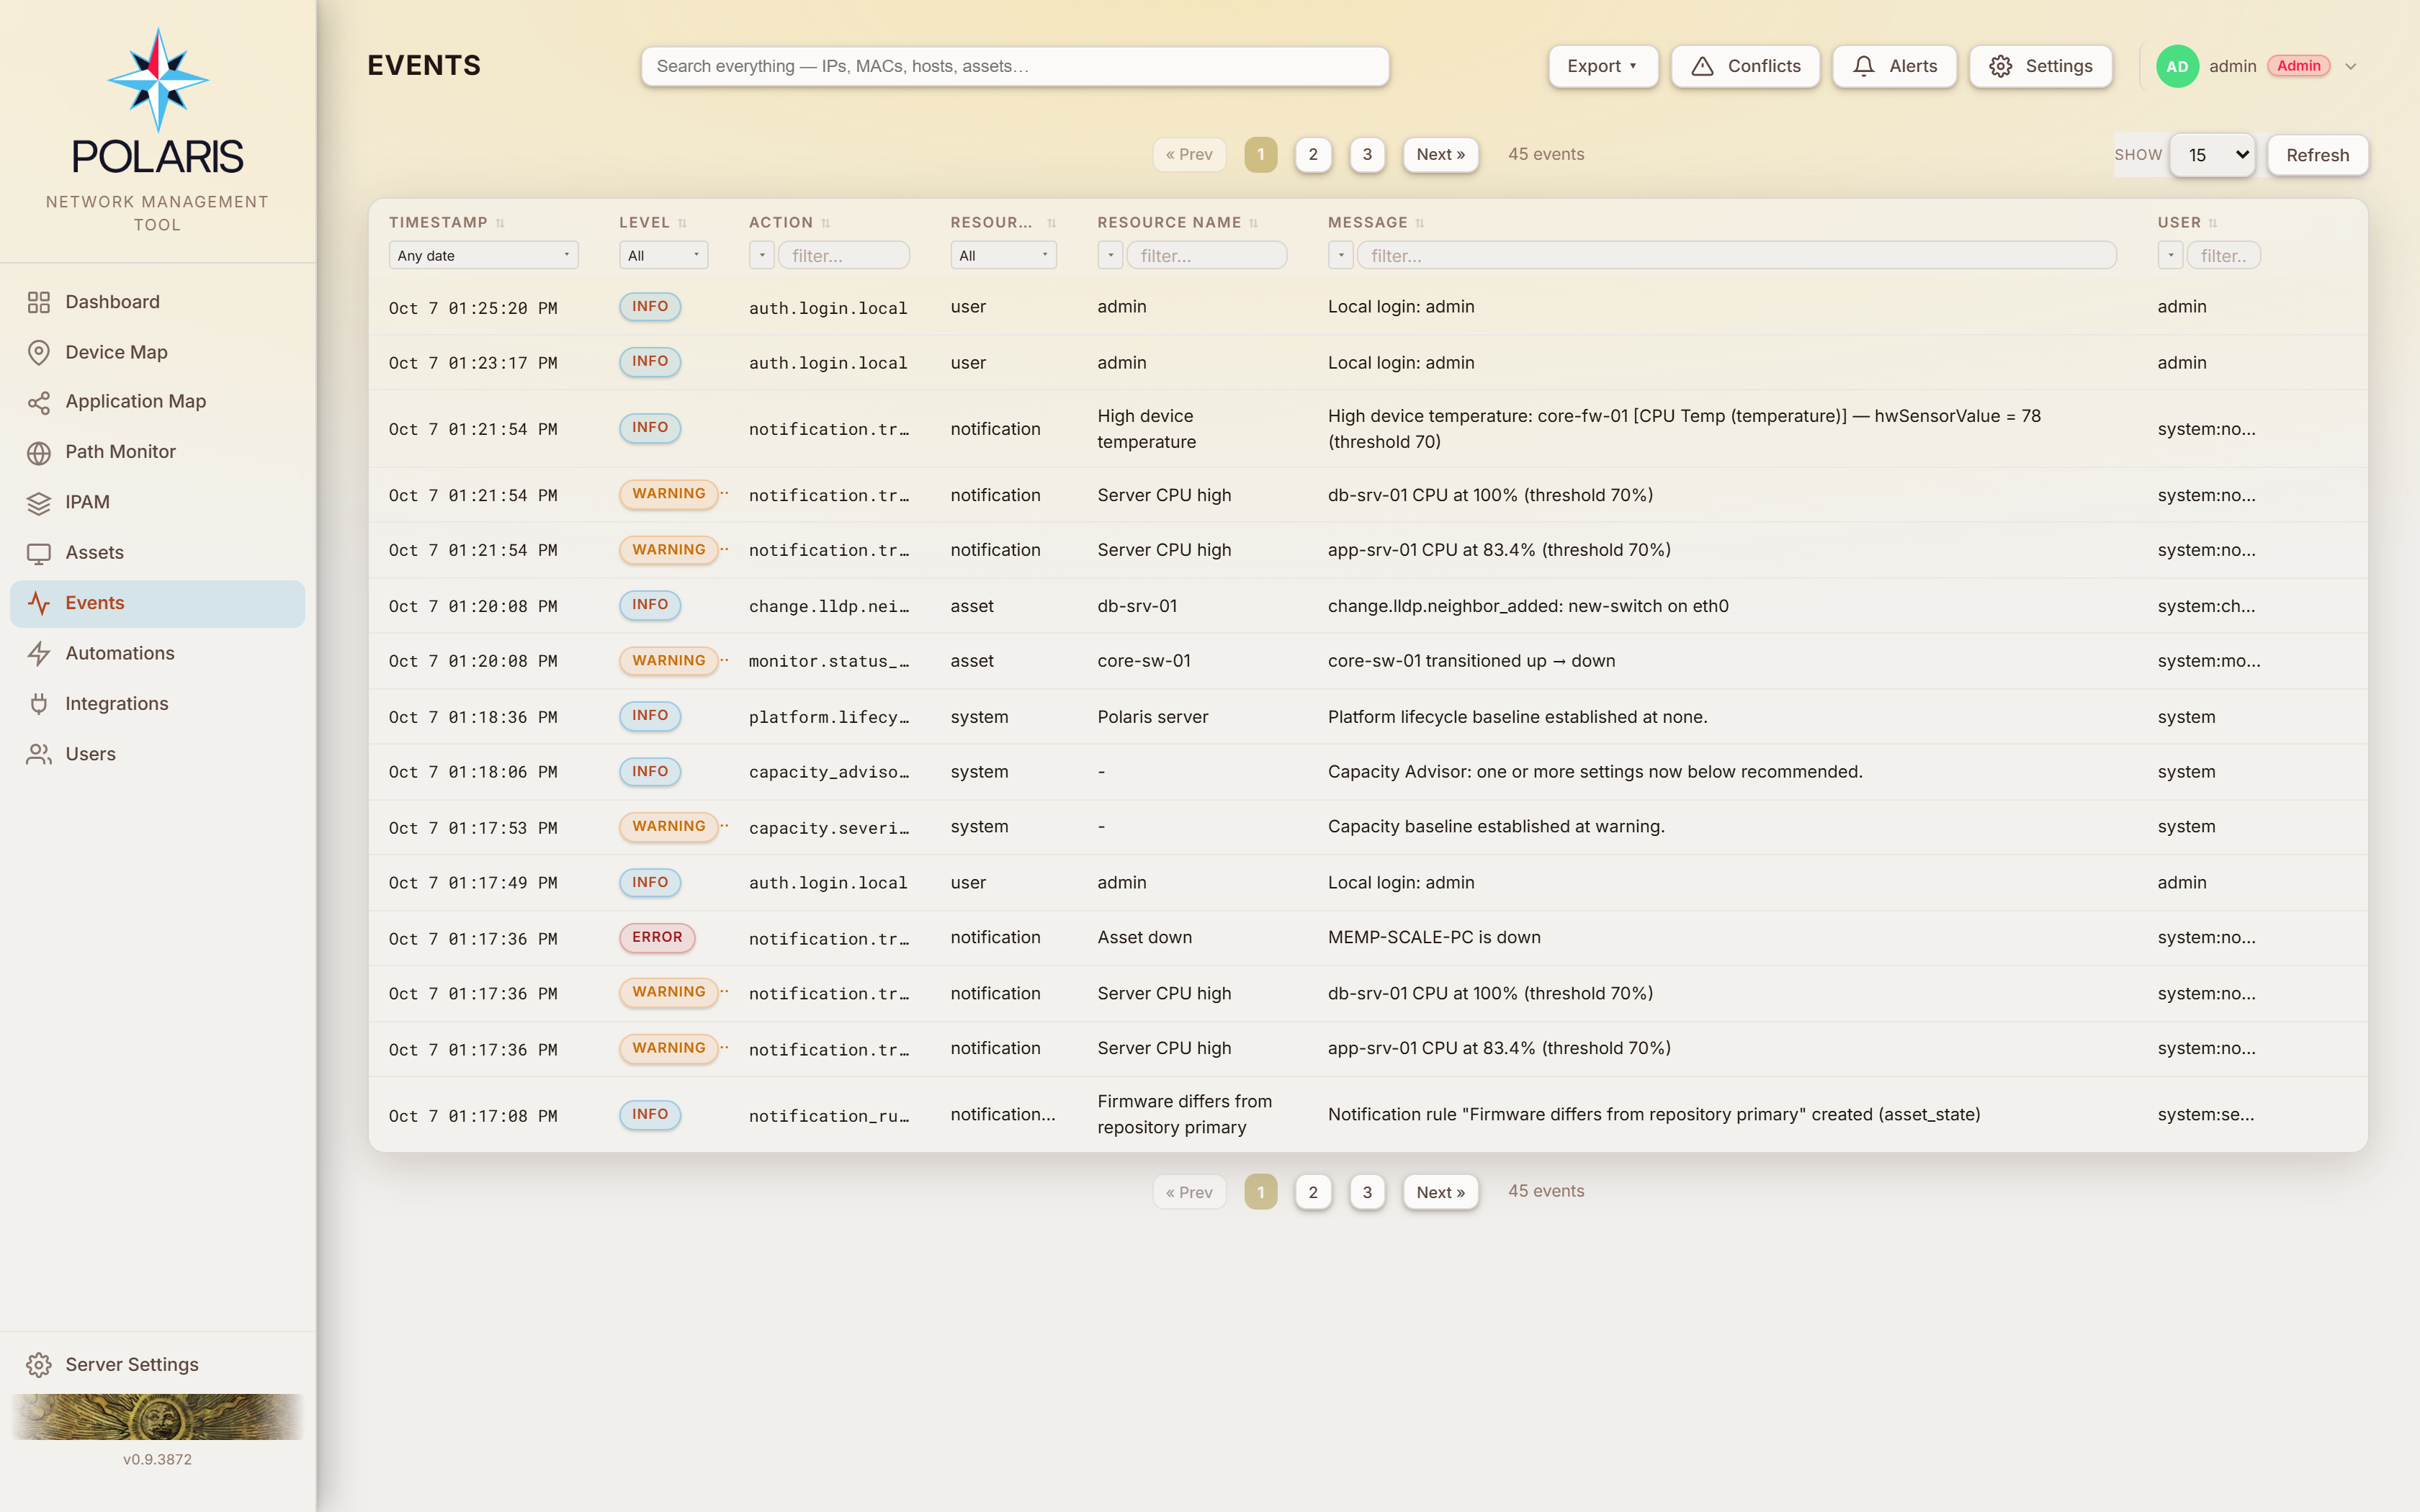
The audit log. Every audit-worthy action writes an Event — creates, updates, deletes, discovery results, alert lifecycle, login outcomes, agent activity, script runs.
Gated by events. The page has two tabs: Events (the log, below) and
Calendar — maintenance windows, reboots and firmware upgrades, booked and past
(see Calendar).
| Column | |
|---|---|
| Timestamp | |
| Level |
info · warning · error
|
| Action | a dotted verb — reservation.created, asset.firmware.changed, monitor.status_changed
|
| Resource | the entity type |
| Resource Name | |
| Message | |
| User | the actor |
Sortable, inline-filterable, resizable, with saved layouts like every other list
page. Export downloads PDF or CSV of the current page, all filtered results,
or the entire event log; Show (the page size), Refresh and Clear Filters
sit on the tab row, and the page buttons are below the page card. The Calendar
tab's month and week views fill the card. In a CSV, a cell that begins with =, +, - or @ (a hostname or
message that a device chose) is written with a leading apostrophe so a spreadsheet
reads it as text, not a formula (rule 109).
| Actor | Means |
|---|---|
| a username | a person, via the UI |
api:<token name> |
a bearer token |
system:<what> |
Polaris itself — system:dns-resolved, system:maintenance, system:automation, system:upstream-chain, system:auto-resolved
|
The system: prefix is worth knowing: it tells you a change was made by a rule
rather than by a person, and which rule.
An asset's Events tab (open the asset from Assets) shows every
event about that device, not only the ones filed under it: its own monitoring,
discovery and change events, and its alerts — an automation firing
(notification.triggered), escalating, gaining or losing a port, and clearing
(notification.auto_cleared). Those alert rows show Resource
notification with the automation's name beside it. A device whose alert keeps
firing and clearing shows each round there. Every alert email that goes out
adds a notification.email_sent row naming the automation and its To and Cc
recipients (Bcc is only counted) — see rule 106.
An automation only writes its fired event when it has a Create an Event action; the clear is written regardless. Acknowledging or clearing alerts by hand is one event for the whole selection, so it appears here on the Events page but not on each device's tab.
The Calendar tab puts every operation Polaris runs on a schedule on one calendar, booked and past, so it answers both "what runs tonight?" and "what ran last Tuesday?":
| Kind | What appears |
|---|---|
| Maintenance | every maintenance window's occurrences, planned and ad-hoc |
| Reboots | every booked reboot and every reboot that ran, whether started now or from a booking |
| Firmware | every booked firmware upgrade and every upgrade that ran |
A link ending in #calendar (/events.html#calendar) opens the page on this
tab; the Maintenance dialog's Schedules tab links here. The Export menu
belongs to the log and is hidden on this tab.
Month, Week, Day and List, with ‹ › to step by the view's unit and Today to come back. Your choice of view is remembered in this browser.
- Month — a window a day or longer is one bar across the week; anything shorter is a chip on the day it starts. A busy day folds behind +N more.
- Week / Day — an hour-by-hour grid, with a line at the current time and items placed at their times; overlapping items sit side by side.
- List — every item grouped by the day it starts, with windows already running when the month opens listed first.
A booking that has not run yet is drawn as a point at its booked time. Once it runs it spans from start to finish, so a long firmware flash reads as long. A booking that ran is one item carrying what happened to its run.
The left edge says what kind of item it is; the fill says how it went:
| Fill | Status |
|---|---|
| dashed outline | booked, not yet run |
| green | succeeded |
| red | failed, missed or refused |
| amber | unverified — the device answered, but nothing proved it rebooted |
| struck through | cancelled (a disabled maintenance schedule is struck through the same way) |
Hover an item for its device, time, status, who booked or started it — a username, or the automation that booked it — and any error. The legend under the calendar names each colour.
Maintenance, Reboots and Firmware checkboxes above the calendar show or hide each kind; the choice is remembered in this browser. A kind appears only when your role can read it on its own page:
| Kind | Also needs |
|---|---|
| Maintenance |
maintenanceManagement Read |
| Reboots, Firmware |
assets Read |
A kind your role cannot read is not offered at all, so when a kind's checkbox is shown and ticked, no items of that kind means none are scheduled — not that you may not see them. With none of the three keys, no checkbox is shown and the calendar stays empty.
| Click | Opens |
|---|---|
| a maintenance window | the Maintenance dialog on that schedule |
| a reboot or firmware item | the device's details on its System tab. A booking still pending opens the Reboot or firmware dialog to move its time, change who is told, or cancel it (with assets Read-Write); a run opens its log |
| an empty day, or an hour in Week / Day | the Maintenance dialog with a new one-time window prefilled on that day — that hour, or 20:00 (now, for today) — for two hours. Nothing is saved until you name it, choose its devices and click Save. Offered only with maintenanceManagement Read-Write; without it, empty days are not clickable |
A booking changed or cancelled from the dialog a click opened shows on the calendar straight away.
Every time on the calendar is the Polaris server's local time — the clock the schedulers run on — whatever time zone your browser is in, so an item is always on the day it will actually run. The hint above the calendar says so.
A range holding more than 2000 reboots or 2000 firmware upgrades shows the first 2000 of each and says "Too many items to show them all here — some are omitted."; step to a shorter view (Week or Day) to see the rest.
The Conflicts button opens the resolution queue in a slide-over, with a count badge. See Conflict resolution.
The panel is drag-resizable from its left edge and remembers the width per browser, like the other detail panels. The duplicate-IP card is the widest one in the queue — six columns, two of them holding the new-address field and the merge button — so widen the panel if the card is scrolling sideways. The Alerts button's panel beside it resizes the same way.
The Conflict Queue dashboard widget shows the same thing — every pending
conflict, to anyone whose role holds discoveryConflicts at Read, and nothing to
anyone whose role does not. If it looks empty and you expected rows, check that
grant before assuming there are none.
Events older than 7 days are pruned by default
(rule 8). All three settings live behind the Events page's
own Settings button (the Event Settings modal; the button is shown only
to the built-in admin role), not under Server Settings — Server Settings → Retention is sample
retention. Reading the retention needs events:read; changing any of the three
needs events:write.
| Tab | Holds |
|---|---|
| Archive Export | copy events off-host over SCP or SFTP: host, port, username, password or SSH key path, remote path |
| Syslog | forward events over UDP, TCP or TLS (CA, client certificate and key paths): host, port, facility, minimum severity, and message format — RFC 5424 (default) or RFC 3164 |
| Retention | Retention Period (days), default 7, and Minimum Event Level to Retain — Info (store everything, the default), Warning or Error, which drop the lower levels permanently |
Archive Export and Syslog each have a Test Connection button. Archive Export
refuses a host that is not a hostname or IP address, a username with anything
beyond letters, digits, ., _ and - (and a leading hyphen), and a port outside
1–65535, because those values are passed to ssh, sftp and scp
(rule 107).
Anything archived leaves the host. That is why several rules are careful about what reaches an Event in the first place — most visibly, directory sync writes counts only, never names (rule 35e), and address-book search query strings are never written at all.
| Action | Level | Means |
|---|---|---|
integration.discover.error |
error | the run failed |
integration.discover.devices_unread |
warning | devices the run could not read — named individually (rule 53) |
discover.device.complete |
info | retracts an earlier error for that device |
discovery.hostname_adopt_refused |
warning | a DHCP lease or detected device used the hostname of a monitored asset (or one with stored credentials) from a MAC that asset does not have. Polaris recorded the MAC as unverified and did not move the asset's address — otherwise it would have polled the newcomer with the asset's credentials (rule 91) |
integration.coords.push_failed |
warning | coordinate write-back failed; the asset writes still landed |
asset.location.geocode_failed |
warning | a firewall's SNMP location (or address metavariable) could not be turned into map coordinates — no geocoder recognised it, a geocoder was unreachable, or geocoding is off — so the pin kept its other coordinates. Filed on the asset, so its Events tab shows it; repeated at most once a week for the same address and reason |
| Action | Means |
|---|---|
monitor.status_changed |
the device went Down, or came back Up after being down. A missed poll (the pill reading Missed) and the answer after it are not events — they show on the response-time chart and count toward the down automation's missed-poll limit. One miss while a device climbs back out of an outage does not write a second Down. Not written for entering or leaving passive — that is a configuration edge, not a state change |
monitor.dependency_suppressed / _resumed
|
a subtree went behind a dark parent, or came back |
monitor.down_detection_absent |
one-shot — the fleet has no down automation at all, so nothing is being judged |
monitor.interface_up |
a monitored (pinned) interface came up. The message names the speed and duplex it negotiated — Interface port5 (Uplink) on SW-1 came up — 1 Gbps, full duplex — and says unknown for either one the source does not report. Filed on the asset, so its Events tab shows it |
monitor.interface_down |
a monitored interface went down: warning, or info with (administratively down) when the port was shut. Only a port that was seen up first produces one — the first reading after Polaris starts records where each link is and writes nothing |
The asset.*.changed family: asset.firmware.changed,
asset.switch_port.changed, asset.wireless_ap.changed,
asset.gateway_firewall.changed, asset.fortilink.changed, asset.ha.standby_down / _restored,
asset.mac.adopted, asset.ip_override.released.
path_check.path_changed — a host's traceroute for a
path check took a different set of hops from its
previous one. Written against the host (so an automation's device filter
applies to it), at most once every 10 minutes per host and check; the details
list the old and new hops. path_check.created / .updated /
.enabled / .disabled / .deleted audit edits to a check (a target change is
written at warning level), and path_check.agent_over_cap names a host
that matches more than 20 enabled checks.
These are diffed against a run baseline, not emitted at each write. Two sequences legitimately ping-pong within one discovery run — a coarse cached OS version replaced by the projected one, and two spellings of the same switch port — and emitting inline would report both halves as changes every run, forever. Diffing against the cycle boundary nets them to zero, so a steady fleet produces an empty batch.
notification.triggered is written by the removable "Create an Event"
action. It is present on every automation by default, and event- and
change-triggered automations are carved out — one that wrote an Event would feed
its own trigger.
notification.email_sent records each alert email that was delivered, on the
device it is about. It never triggers or clears an automation, even one whose
pattern is * or notification.*.
notification.superseded records an alert cleared by a carve-out, a
device-down supersession (any metric or device-state alert on a device that went
down) or a saturated reading.
| Action | Level | |
|---|---|---|
auth.login.blocked_source |
login refused by the source-IP restriction | |
user.password_changed |
info | self-service — the caller proved the current password |
user.password_reset |
warning | admin-side — that proof could not be made |
api_token.admin_equivalent |
warning | a token was bound to an admin-equivalent role |
| a group mapping to an admin role | warning | IdP group membership is now a path to Polaris admin |
automation_script.created |
warning | |
automation_script.updated |
warning when the body changed, else info | a body change carries the old and new sha256 |
automation_script.deleted |
warning | |
automation.script.run |
one execution | |
ssh.host_key.mismatch |
a host key changed and the connection was refused | |
tls.cert.mismatch |
warning | a server's TLS certificate changed and the connection was refused before any credential was sent — written once per new certificate (rule 113) |
tls.cert.trusted |
warning | an administrator trusted a server's new certificate in place of the pinned one |
tls.cert.repinned |
info | a device's new certificate was pinned automatically after a firmware upgrade Polaris ran |
ssh.host_key.deleted / tls.cert.deleted
|
warning | a pin was deleted, so the next connection trusts whatever answers |
event_archive.export_failed |
warning | the archive export failed, so old events were not pruned that hour |
event_archive.host_key_forgotten |
warning | the archive server's pinned host key was forgotten |
role.grant_review_needed |
warning | a custom role holds Read-Write on a permission the September 2026 update made stronger; review it (rule 114) |
role.grant_reviewed |
info | an administrator confirmed a flagged role's grants are intended |
regex.pattern_unusable |
warning | a stored pattern uses lookahead, lookbehind or a backreference, so it is skipped until rewritten (rule 116) |
logflagrule.pattern_unusable |
warning | the same, for a log-flag rule |
integration.query |
info | a query run from the Unraid Query API window; the event holds the query text (rule 117) |
agent.upgrade_skipped |
a host the fan-out could not upgrade | |
agent.upgrade_deferred |
info | a host the fan-out did not try because monitoring shows it down; retried by the next fan-out |
asset.pins.bulk_updated |
one mass-pin apply | |
credential.used |
info | a person aimed a stored credential they own (or hold Credentials Full RW for) at an asset, a Discovery's targets, a path check, a firmware binding or a flash |
credential.borrowed |
warning | the same, with a credential the person does not own and no Credentials Full RW — the row names the owner and the destination (rule 112) |
The two password Events being different actions at different levels is deliberate: the self-service change proves knowledge of the current password and the admin reset cannot, so they are not the same act.
An event trigger fires when a matching Event is written, filtered by action
pattern, minimum level and resource type. A change trigger is sugar over the
change Events — the change.* family (LLDP neighbours, processes, SD-WAN
failover, MCLAG, wireless stations), written only while some automation
subscribes to them, and the always-written asset.*.changed family.
Both are device-scoped (rule 46), and both are exempt from carve-out precedence — they neither carve out nor are carved out.
Twelve event automations ship seeded, unconstrained. An event automation clears
on its counterpart Event rather than on a timer:
agent.disconnected → agent.connected, scoped to the same subject.