Repository navigation
Dashboard
The landing page. It is a widget canvas — you choose which widgets are on it, where they sit and how wide they are, and the layout is yours.
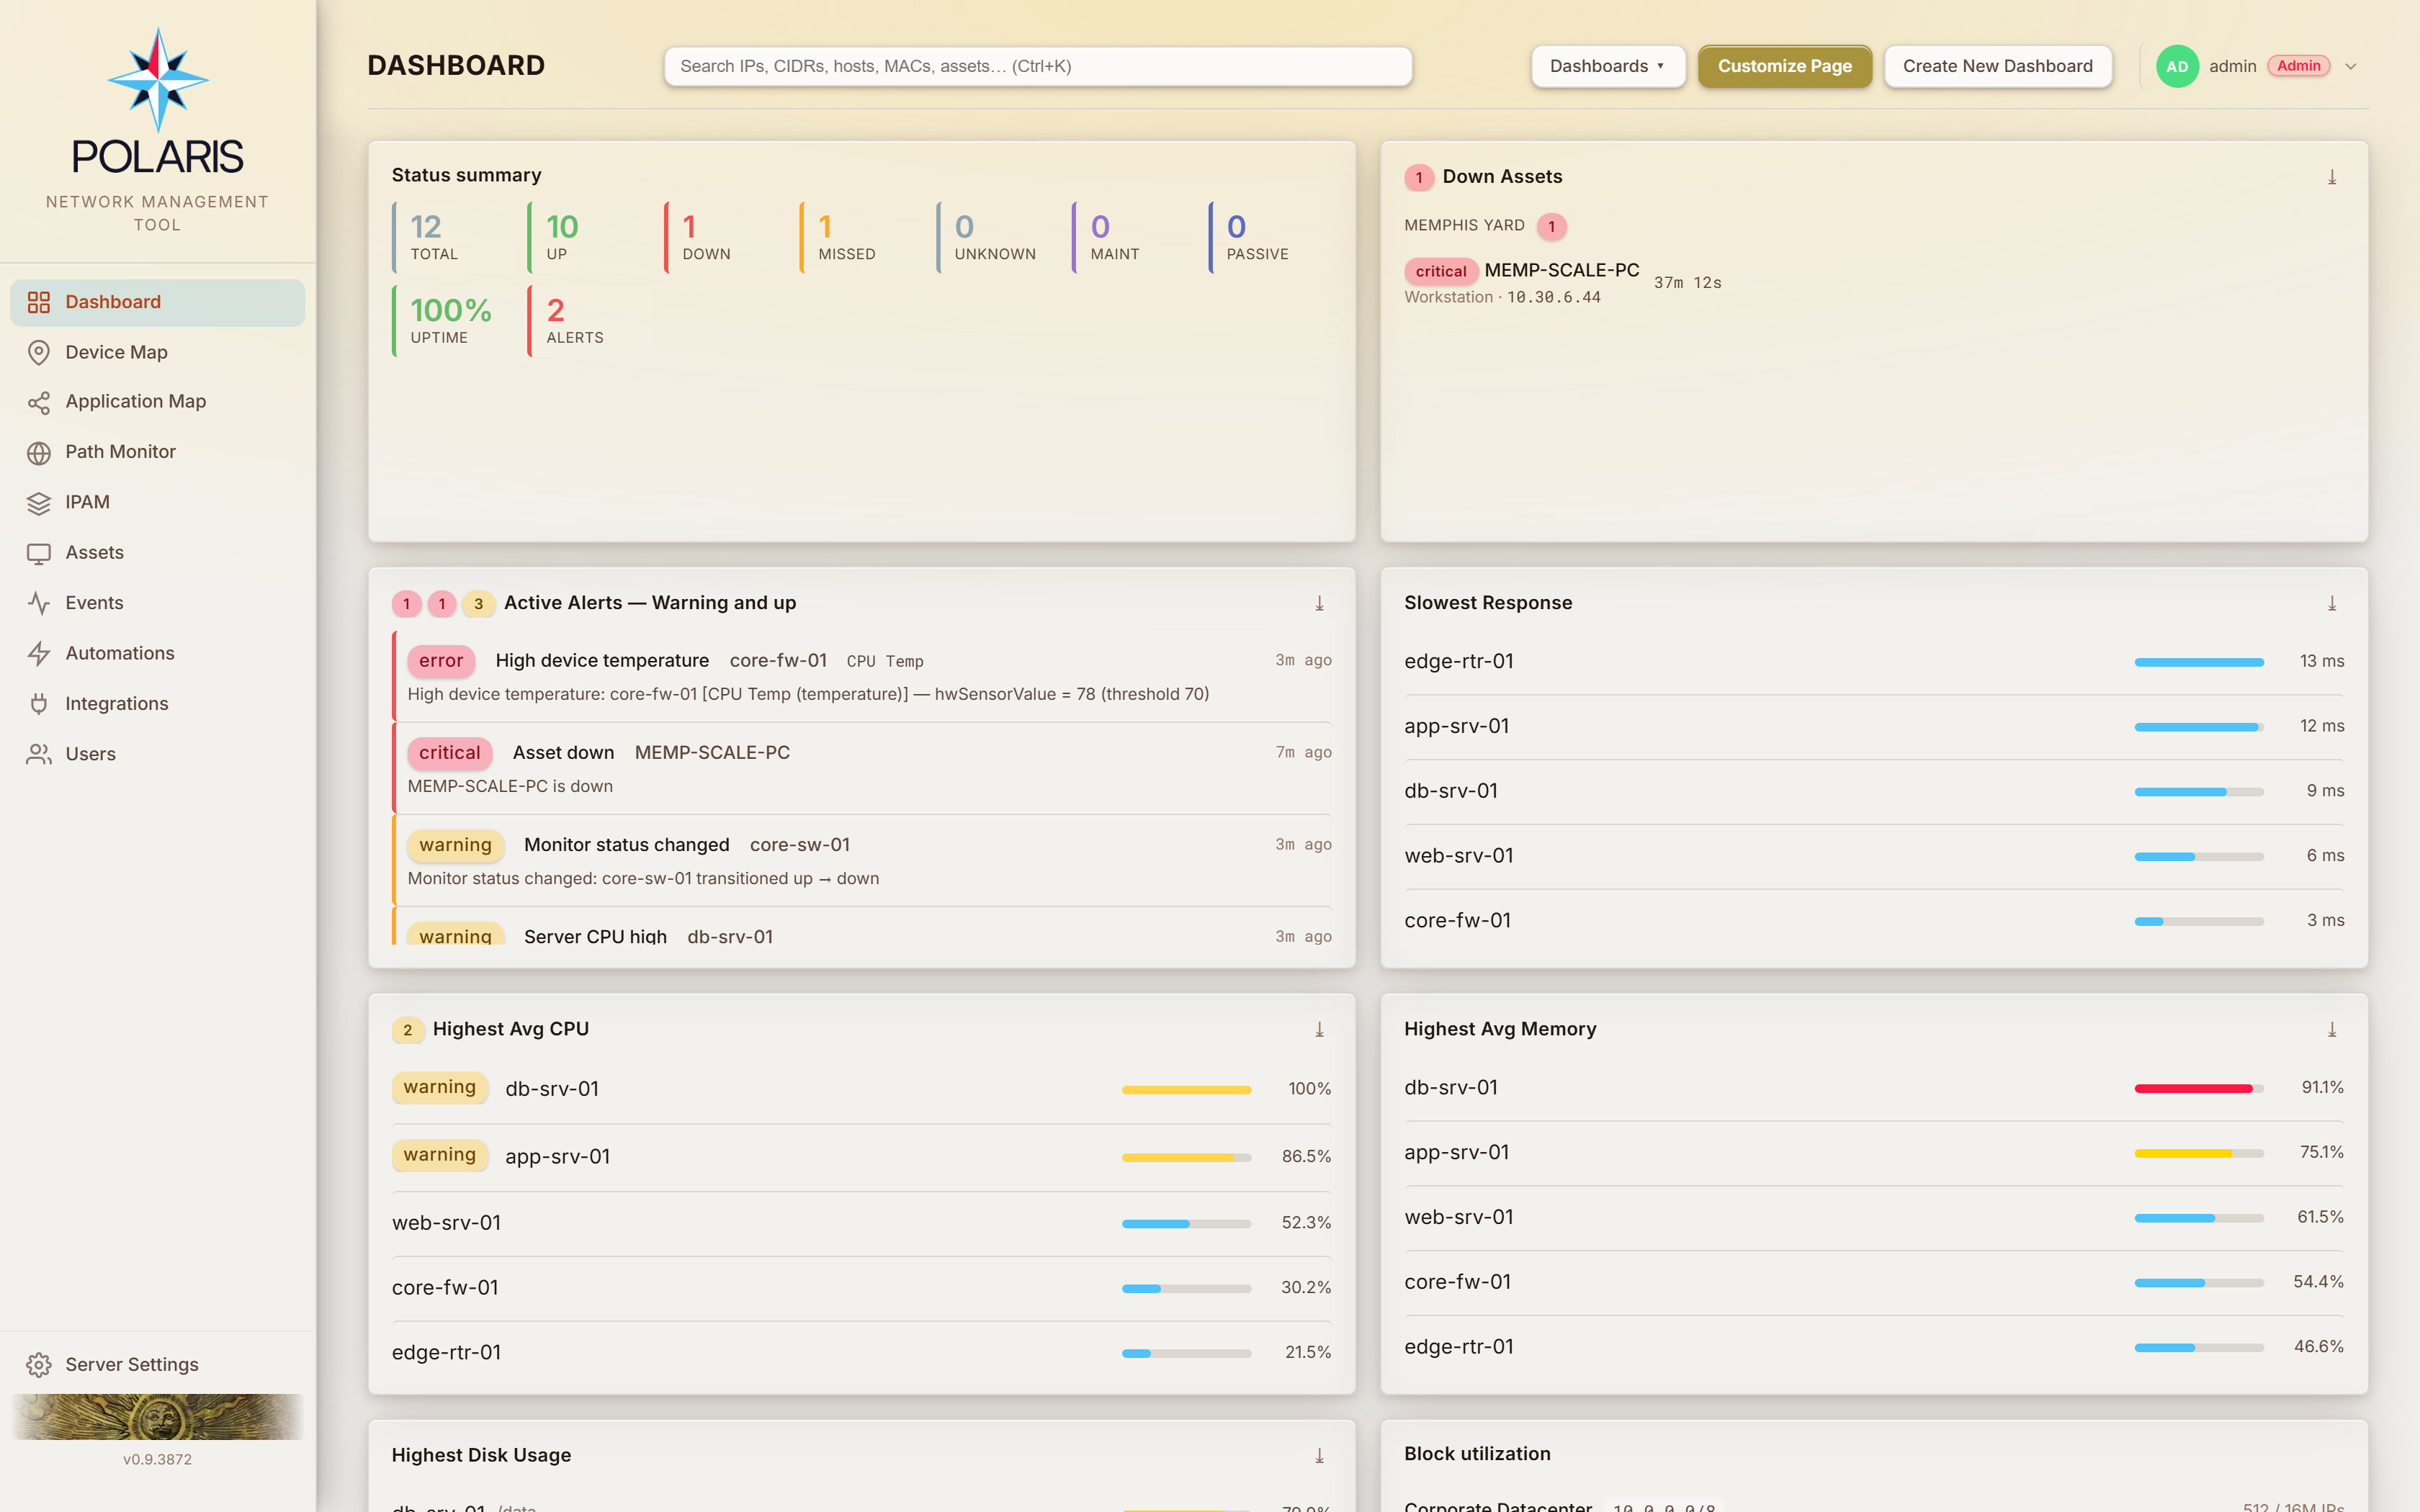
The Dashboard has no permission key of its own. It is gated per widget: a widget whose data your role cannot read hides itself rather than erroring, so two people on the same install legitimately see different dashboards.
The canvas is read-only until you press the pencil (Customize Page) at the top right; the tick (Done Editing) in its place saves and leaves edit mode. The layout is a row of columns, each a stack of widgets.
| Action | How |
|---|---|
| Add a widget | the pencil (Customize Page), then the green + Add Widget at the bottom of a column — a picker that docks over the dashboard, with a group list, a search box, A–Z / Z–A sort and favourites; drag a widget into place or click it (a click adds it to that column) |
| Start a new column | the green + New Widget Block after the last column — click it and pick a widget, or drop a widget on it |
| Move one | drag its ⠿ grip to any column; a green + marks where it will land, and dropping on + New Widget Block starts a new one |
| Column width | the column's ¼ / ⅓ / ½ / Full control |
| Widget height | the 1× / 2× / 3× toggle on the widget, click to cycle |
| Configure one | the gear on the widget — most carry options (row count, filters, grouping). Changes apply at once; click anywhere else, or press Escape, to close it |
| Sort one | the ⇅ button on the widget's header, while you are customizing |
| Export one to CSV | the download button on the widget's header, while you are not customizing |
| Remove one | the × on the widget, while customizing |
Several dashboards, as tabs. Each dashboard is a tab above the canvas — the tab shows even when you have only one. While customizing, the + after the last tab adds another dashboard and opens it in edit mode; click a tab to switch; while customizing, type over the active tab's name to rename it, drag a tab's grip to reorder, or × to delete it.
Your personal layout — every tab — saves automatically to your account
(/me/dashboard), so it follows you to another browser.
A layout can also be named and saved as a SavedDashboard, private or
public, from the Dashboards ▾ menu → Save this dashboard…. What is
saved is the tab you are looking at — its widgets, columns, sizes and
per-widget settings. Saving over one of your own names replaces it.
The same menu lists My dashboards and Shared dashboards (everyone's published ones). Loading one adds it as a new tab of your own layout — a copy, so editing it never writes back to someone else's row, and later edits by its owner do not follow it.
| Level | Grants |
|---|---|
savedDashboards:read |
list them, and keep your own private ones |
savedDashboards:write |
publish one — which reaches every operator and the unauthenticated Dash wallboard |
savedDashboards:fullwrite |
delete anyone's |
A role with savedDashboards at None does not see the Dashboards ▾
menu at all. Custom roles created before saved dashboards existed were given
None, so if a user is missing the menu, raise that key on their role.
Publishing is the escalated level on purpose: a public dashboard is visible on a NOC wallboard that has no session at all. See Mobile and Dash.
To move a tab to another Polaris install — lab to production, or into version control — use the Dashboards ▾ menu:
-
Export this tab downloads the tab you are looking at as
<tab name>.dashboard.json: its name, columns, widget sizes and per-widget settings. Nothing install-specific travels — no ids and no credentials. Settings that name things (regions, FortiGates) carry the names, so on an install without a region of that name the widget simply matches nothing. -
Import tab from file… reads a
.dashboard.jsonand adds it as a new tab of your own layout, named from the file. Widgets the receiving Polaris does not have are skipped, and the confirmation says how many.
Export and import work one tab at a time, happen entirely in your browser, and need no permission beyond seeing the menu. Unlike a saved dashboard, an imported tab is not linked to anything: it is yours to change.
| Widget | Shows |
|---|---|
| Status Summary | at-a-glance counts of monitored assets by state, infra uptime %, active alerts |
| Active Alerts | alerts your automations have raised from a reading or a state change and nothing has cleared, most severe first — with Acknowledge and Clear in place |
| Event Alerts | the same, for alerts raised by event-triggered automations — an agent disconnecting, a failed sync, a discovery error. These used to share Active Alerts behind a Show / Hide setting; add this widget wherever you want them |
| Down Assets | monitored assets currently down, newest outages first, grouped by site or division. Dependency-down assets are excluded unless the gear says otherwise. An outage whose alert has been acknowledged stays listed but is greyed out, with an ack pill naming who took it, so unowned outages stand out. Hover the pill to read the acknowledgement note |
| Sites With Issues | sites with assets down or in warning, worst first; expand for the nodes |
| Asset Types | breakdown of monitored assets by type; click a slice to drill into the matching asset list |
| Widget | Shows |
|---|---|
| Top CPU | highest average CPU load, averaged over the last N polls (gear-configurable, default 10) |
| Top Memory | same for memory |
| Slowest Response | highest average response time over the last 10 probes |
| Temperature | hottest hardware sensors across monitored assets, per sensor |
| Packet Loss | highest recent probe loss. Fully-down assets (100 %) are excluded — that is what Down Assets is for |
| Stale Polls | monitored assets overdue for their next response-time probe |
| Active Maintenance | the maintenance schedules in effect right now — what each one holds, and when its window expires. The one widget about the devices the others deliberately leave out |
| Recent Reboots | devices that rebooted recently, detected from SNMP sysUpTime drops |
| Down Interfaces | pinned interfaces admin-up but operationally down, plus fully-down IPsec tunnels, grouped by the gate they are on |
| Widget | Shows |
|---|---|
| Disk Usage | monitored filesystems with the highest used percentage, per volume |
| Storage Forecast | growing filesystems ranked by projected days until full, from a 30-day trend |
| Widget | Shows |
|---|---|
| Block Utilization | IP block address-space utilization, busiest first |
| Recent Reservations | most recent reservations; filter by source type from the gear |
| Stale Reservations | DHCP reservations whose client has not held the IP recently — cleanup candidates |
| Widget | Shows |
|---|---|
| Discovery Activity | in-flight integration discoveries with per-run progress and slow-run amber telemetry |
| Conflict Queue | pending discovery conflicts of every kind — needs discoveryConflicts:read; see Conflict resolution for who can act on each |
| Capacity Health | overall capacity severity pill + the top reasons driving it. Admin only |
| Widget | Shows |
|---|---|
| Device Map | geographic map of FortiGates — monitor-health dots, clustering, click through to topology |
| Site Map | geographic map of monitored sites — status dots and live weather radar |
On both maps a down site whose alert has been acknowledged is faded: it
stays red, but drops the pulse and its label dims to DOWN · ACK. A full-strength
red dot is an outage nobody has picked up yet. A Device Map cluster fades only
when every down site inside it is acknowledged.
Most fleet widgets narrow what they show from the gear. Each filter is one field that reads All regions, All FortiGates, All asset types or All tags until you narrow it, and then shows what you picked as pills:
- Click the field to open a picker with a search box, Select all / Clear (which act on what the search is showing) and the full list. Nothing changes until you press Save.
- Click a pill's × to drop one item picked by mistake. Removing the last one puts the field back to All.
| Filter | Narrows to |
|---|---|
| Regions | All regions, My regions (the regions your role is scoped to — not offered on the Dash wallboard, which has no viewer), or the regions you pick |
| FortiGates | assets behind the gates you pick; (No FortiGate) keeps devices with no gate. The list offers only gates in the regions you picked |
| Asset types | the types you leave ticked. The pills are the types shown |
| Tags (Active Alerts and Event Alerts) | alerts on assets carrying any of the tags you pick. An alert about Polaris itself, with no device, stays listed |
The filters combine: a widget narrowed by region and type shows what matches both.
"Monitored" means monitored. Nearly every widget counts only assets with
monitored = true. A device you stopped polling drops out of these counts —
that is the same gate that stops automations firing about it
(rule 37).
Down Assets and Packet Loss do not overlap. A fully-dark device reads 100 % loss by arithmetic, so Packet Loss excludes it and Down Assets owns it. If you see a device in both, something is inconsistent — check whether its loss window is still counting an outage that has ended (rule 29).
Dependency-down is not down. A device behind a dark parent is suppressed: its failures are rendered grey rather than red, and it is left out of Down Assets by default (rule 38). The gear can include them.
Maintenance is its own state, never an outage. A device inside a maintenance window shows a purple Maintenance pill and is not counted as down. That is why Active Maintenance exists: since every other widget leaves those devices out, it is the only one that says what is down on purpose and when it comes back. Its filter also works the other way round from the rest — a schedule is listed when any of its devices is in scope, and is then shown whole, so a window covering switches, APs and servers still appears on a board filtered to switches (with the in-scope share noted beside the device count). The times it prints are the Polaris server's wall clock, the same clock the schedule itself is evaluated against; the countdown beside each one is computed against your own, so the two agree wherever you are sitting.
The sort order also decides what the row limit hides. Every listing widget shows its rows in an order you choose (the ⇅ button, while customizing) and then cuts the list to its Row limit. So the order is not only cosmetic: on "Severity, then newest" a low limit hides the least severe rows, and on "Down longest first" it hides the most recent ones. Each widget's first option is its default order, and a widget you never touch keeps it.
Besides the default, the listing widgets offer Most recent first, Down longest / Longest outstanding first (the problem nobody has dealt with, which a severity-first list buries at the bottom), Hostname A–Z — worth choosing for a wall display, because rows then keep their places instead of jumping on every refresh — and, where the widget has one, its place: Site, Division or Gate, A–Z then severity. Active Alerts adds Unacknowledged first, and the ranked widgets (CPU, memory, response time, loss, disk, temperature, storage forecast) offer highest-first and lowest-first on their own value.
A widget that groups its rows follows you: pick an order and the groups re-order to match it, instead of staying on the biggest-group-first order they use by default.
Conflict Queue shows every pending conflict or none. It lists all of them
to anyone whose role holds discoveryConflicts at Read, and nothing at all to
anyone whose role does not — it never shows a partial list. If it looks empty
and you expected rows, check that grant before assuming there are none.
Capacity Health measures this install. The reasons behind the pill are
computed against real table sizes and the real retention configuration, not
against defaults. timescale_recommended fires at zero bytes with no size
gate — TimescaleDB's absence is a broken install from the first byte, not a
problem that begins at a threshold (rule 52).
The Active Alerts widget is not read-only. Each unacknowledged row carries:
-
Acknowledge (
alerts:write) — puts your name on the alert without leaving the dashboard. A note is collected in a proper modal, and is required when the automation demands one.An acknowledged row keeps an ack pill naming its owner; hover it to read the note they wrote. A dependency-down alert acknowledged along with the device that is actually down says so on the hover, above that alert's note (rule 78a). A down alert raised by a second down automation after the device's outage was already acknowledged keeps that acknowledgement, and its hover says it was carried over (rule 78b).
-
Clear (
alerts:fullwrite) — ends the alert. This stops escalation and runs the automation's reset actions, so it is confirmed first.
Both report the server's count back, so a no-op says "already cleared" rather than showing a success toast over nothing.
A grouped alert (one alert covering several ports or components on a device, from an Alert Group or an automation that groups by device) wears a GROUP pill after its title; hover it for the group name and how many components it covers. A grouped row does not print a port beside the hostname: its message lists every affected component. An ungrouped alert still shows its port there, which is what tells two rows from one per-interface automation apart.
Clicking a grouped row adds Show alerts in this group… at the top of its
menu (alerts:read). It lists every component the alert covers: its own
severity, its reading, and when it joined. Components still affected come
first, worst first. Ones that have recovered stay on the list, greyed, with
the time they came back, so you can see what is left. When an Alert Group
gathers several automations, an Automation column names which one raised
each component.
A TEST pill beside the severity marks a delivery test sent from the
automation wizard (Automations). It is about a made-up device
(EXAMPLE-SWITCH-01), not one of yours, and clears itself an hour after it
fired.
A purple MAINT badge marks an alert that is paused for planned work (rule 16): its device is in a maintenance window, or sits behind a device that is. The row is dimmed like an acknowledged one. A window does not clear an alert that was already open (only "device is down" alerts are cleared), because the problem started before the work did. It stays listed, but sends no reminders or escalation until the window ends. Afterwards it clears on its own once the condition recovers, or you clear it by hand. Hover the badge to see whether the device itself or an upstream device is in maintenance.
The Active Maintenance widget is the other one you can act from. A + New schedule button at the top of it opens the Maintenance editor to create one without leaving the dashboard — it is there over the empty widget too, which is usually when you want it. A schedule you create appears in the widget a few seconds later, once it is actually holding devices.
Clicking a schedule offers:
- Open schedule… — opens the Maintenance modal with that schedule loaded, for review or editing. It is the same editor the Assets page opens.
- Disable schedule — confirmed first, because it takes effect immediately: the window's open sessions end, held devices leave maintenance and resume polling, and the schedule stops firing until it is re-enabled.
Both need maintenanceManagement:write — the level the Maintenance modal
itself needs. A role that can only read maintenance still sees the widget;
its rows simply do nothing. See
Maintenance Windows.
A widget with more rows than fit scrolls itself — a slow creep through the list, then back to the top, the way a NOC wall display reads. It never moves while you are working in it: pointing at the widget pauses it, and so does opening a row's menu, which stays put until you pick something or dismiss it. The list settles for a moment after the menu closes before it starts creeping again.