Repository navigation
Dashboard
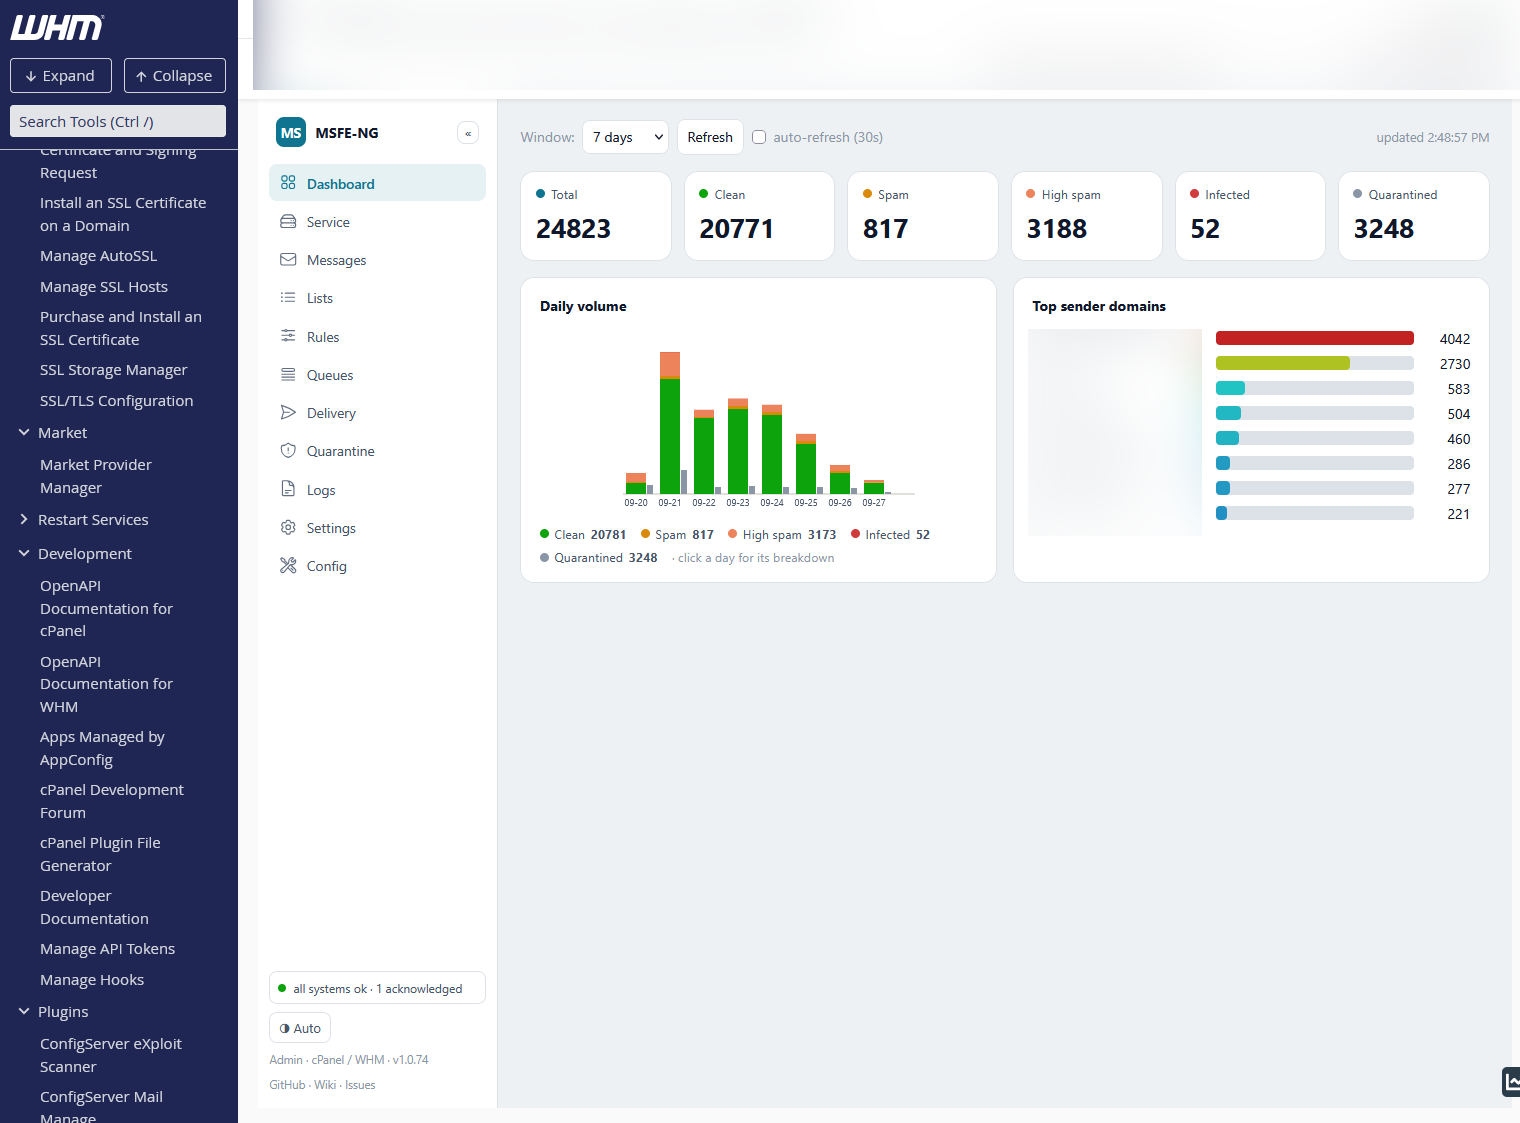
A summary of the mail log over a window of 7, 30 or 90 days:
- Tiles — Total, Clean, Spam, High spam, Infected, Quarantined.
- Daily volume — one stacked bar per day split into Clean, Spam, High spam and Infected (an infected message counts only as infected, so the parts add up to the day's total); the thin grey bar beside it is how many were quarantined. Hover a day for its counts; click it to see that day as a donut with counts and shares, and ← All days to go back.
- Top sender domains — the eight busiest sending domains in the window, coloured from cool (few messages) through green and yellow to red (the busiest). Click a domain to open Messages filtered on that sender domain over the same window.
Refresh reloads on demand; auto-refresh (30s) keeps it live while the tab is visible. The timestamp on the right shows the last update.
If the mail log is empty the tiles are replaced by the Finish setup card (see Installation). Statistics start from the moment logging is enabled — history before that is not imported.