YamlCardChart
The card type cardChart can be used to show a bar graph of the openHAB persistance data fo one item.
You can define the following card attributes and one slot with references to an items in openHAB:
| card attribute | default value | optional / Mandetory | Description |
|---|---|---|---|
| color | violet | O | color of the graph |
| period | 60min | O | Periods in minutes which will be shown in the chart. You can also use keywords like: h, 2h, d, 3d, w, m, to define an hour, 2 hours a day, 3days, a week or a month. see also: openHAB chart periods |
| past | 0min | O | Minutes in the past from where the defined perios starts. You can also use keywords like: 2h, 2M etc. See openHAB chart periods |
| life | False | O | When you set this attribute to True the cahrt is updated when the item change the state. Note: If the state is changes every few seconds this result in the sitation, that the screensaver is not activated. |
| Slot number | OH item type | slot types | default value | optional / Mandetory | Description |
|---|---|---|---|---|---|
| 1 | Number, Dimmer, Rollershutter | any | - | M | A char based on numbers will be genarated |
| 1 | String, Switch, Contact | any | - | M | A chart with a percentage of each state inside the defined period will be generated |
Simple example for a number chart:
  - name: PowerChart
    title: Stromverbrauch
    type: cardChart
    slots:
      - class: ohItem
        type: number
        item: Stromzaehler_power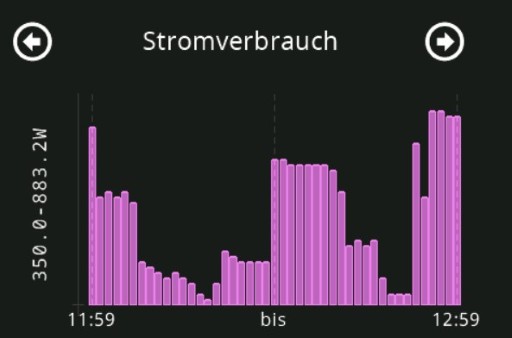
The y axis label is used to show the maximum and minimum values during the period. The minimum value in the chart is scaled that 0 on the y axis is equivalent to the minimum value in the defined period. The labels on the x axis show the start and end of the defined period. The date and time is formated dependant on the language you specified in the ini file.
Another example for a chart with the states of a Switch item:
  - name: StateChart
    title: Küchenlicht
    type: cardChart
    period: d
    past: w
    color: yellow
    slots:
      - class: ohItem
        type: switch
        item: Switch_Kueche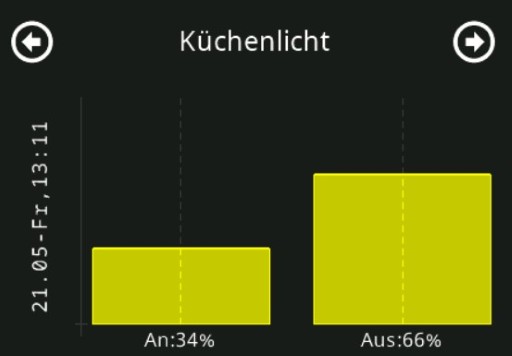
This example shows a yellow chart. You can see how long the kitchen light where active on the same day as today one week ago.


Introduction
NSPanel Preparation
- Preparation
- Prepare NSPanel (extern)
- Flashing Tasmota to NSPanel (extern german)
- Configuring NSPanel and flash HMI jobr99 (extern)
- Flash latest HMI versions of ticaki (extern german)
- NSPanel Emulator (external german)
Installation of the Bridge
Yaml configuration
Further Concepts
Compatible HMI projects
Usefull Links