Feature Efficiency and Range
🇩🇪 Deutsch
How much the car really uses, and how far that actually reaches — measured from your own charging history rather than taken from the car's own estimate. No REST quota: every figure comes from records the stream already produced.
Every charging session stores the odometer and the state of charge at the moment it ended. Two sessions therefore bracket a window in which both the distance driven and the energy that went in are known:
used     = energy delivered between the two readings
           − the charge still sitting in the battery at the end
distance = odometer at the end − odometer at the start
That deliberately reads nothing from your trips. Trip detection can miss a drive — a dead stream, an upgrade, a garage with no signal — and dividing a full month of charging by a partial month of driving produces a wildly inflated figure. On a real car, one such month read 86.8 kWh/100 km off the trip distance and 20.4 off the odometer.
A window needs two charges and at least ~50 km between them, so a fixed "last 30 days" would go blank for anyone who charges rarely, and "all time" would still be quoting last winter in June. So the shortest window that can answer wins: 30 days, then 90, then a year, then the whole ledger. The card and the sensor always say which one the number came from — last 30 days means something different from all records.
-
Battery-side (
from the battery) — what the car took out of the pack. This is the figure comparable with the car's own display, and the only one range may be computed from. -
Grid-side (
at the plug) — what came out of the wall, including charging losses. Available only when every charge in the window was actually measured at the grid (BMW's own charging history, or a wallbox energy entity you bound).
A figure is never a mix of the two. If one charge in a window can only be read on one side, that side simply reports nothing rather than summing a hole.
range on a full battery = usable capacity ÷ consumption × 100
range from here         = that, scaled by the current state of charge
The capacity is BMW's own usable-energy figure (maxEnergy), replaced by the
one battery health learned as soon as that estimate
becomes confident — the sensor says which it used.
Both halves must be present. If the car never reported a capacity, or the ledger can't yet support a consumption figure, the sensor stays unknown rather than showing a range built on an assumption.
The card shows the difference against BMW's remaining-range prediction
(kombiRemainingElectricRange — the number in the instrument cluster). Positive
means your measured consumption reaches further than the car promises.
BMW's figure is scaled up to a full battery only above 20 % charge: below that, dividing a small remaining range by a small percentage multiplies its own error with it.
One Real Range sensor per EV:
- State — how far it goes from the current charge, in km.
- Attributes — range on a full battery, the measured consumption with its side and window, the grid-side figure and the measured charging loss, the capacity and where it came from, BMW's own prediction and the percentage difference.
It is created for an EV that streams an odometer. Until the ledger can support a
figure it reads unknown, and the status attribute says which half is
missing: not_enough_history or no_capacity.
Note on the charging loss shown here. It is measured — grid-side consumption against battery-side consumption over the same window — and is a different thing from the charging loss % setting under Charging costs & history, which is an assumption you supply so cost can be grossed up when nothing measured the grid. If you have both, the measured figure is a good sanity check on the number you typed.
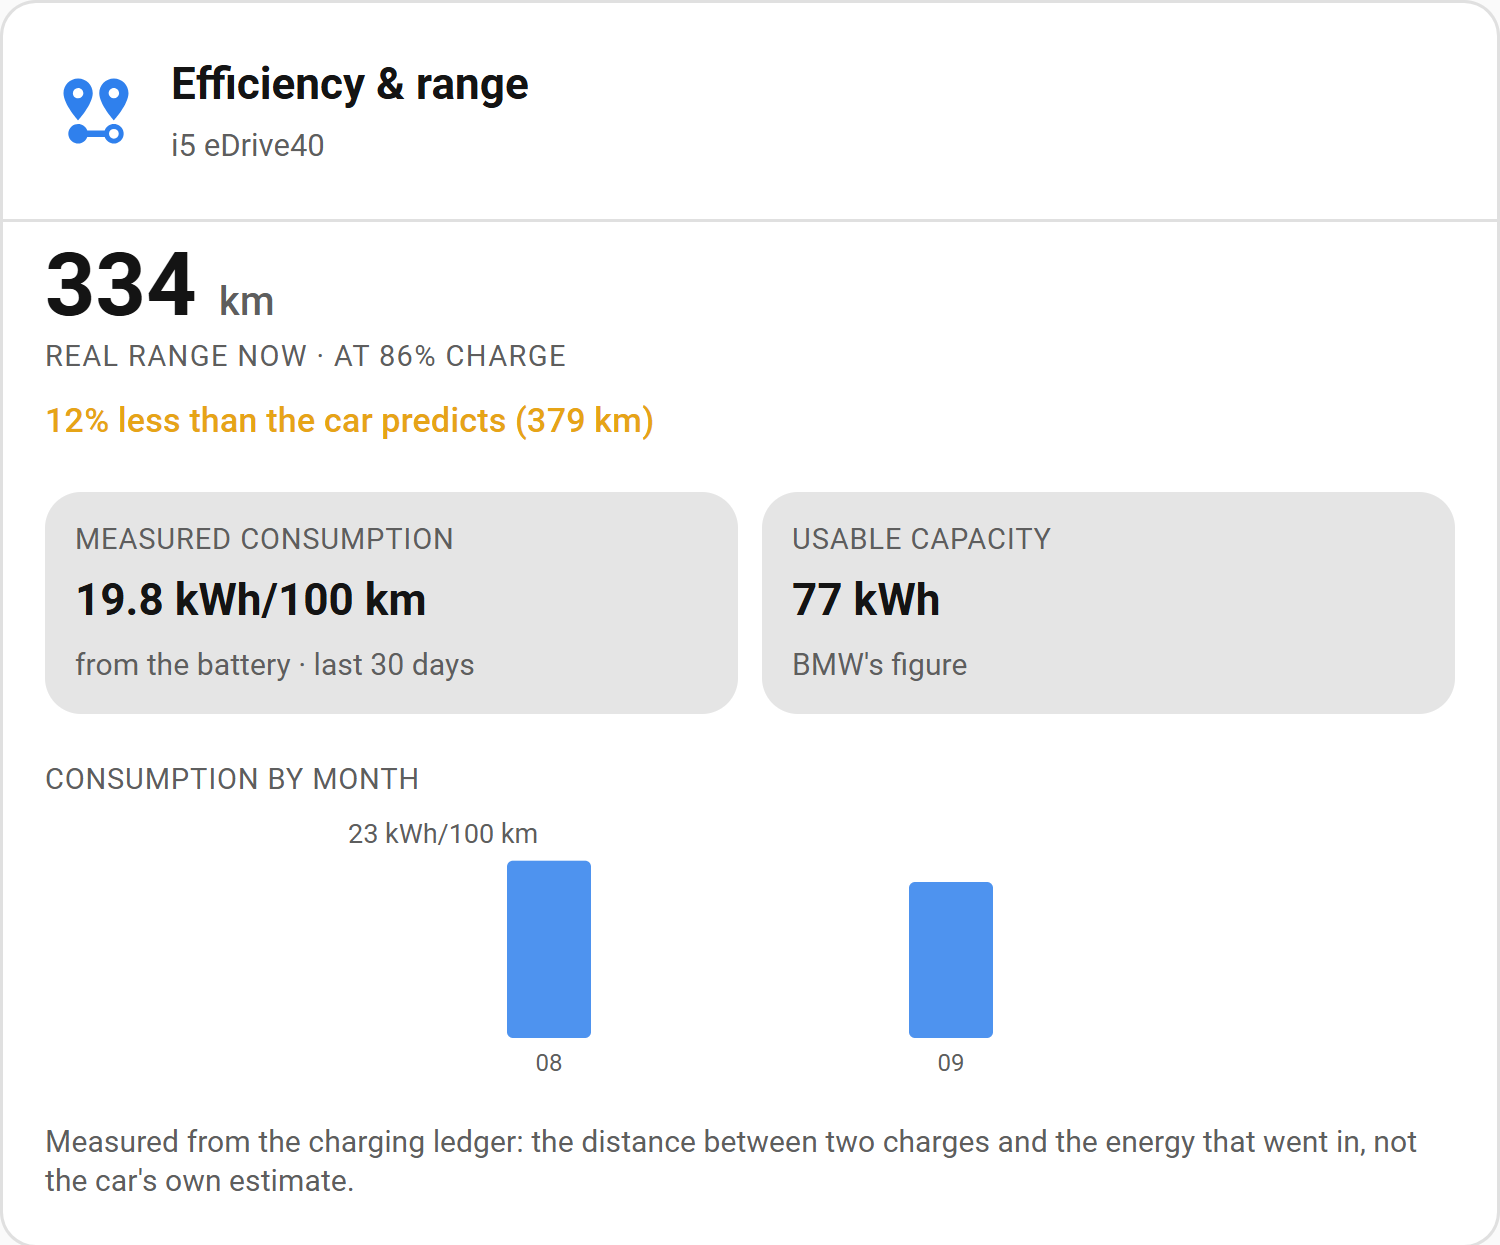
Use the view: efficiency card:
the real range from here, the measured consumption, the charging loss, the
capacity, your cost per 100 km with the month's solar share, and a bar chart of
consumption by month — which is where the seasonal story shows up, since winter
consumption on an EV is routinely a third higher than summer.
Or call bavariandata.get_efficiency
for the whole profile including the month trend.
- The car's display averages differently. BMW's own consumption readout resets and weights on its own terms; this one is a straight energy-over- distance sum across whole charging cycles.
- Grid-side reads higher than battery-side by the charging losses — a slow AC charge in the cold can lose 10–15 %.
- Short, cold trips cost more than the average. The figure describes the whole window, so a month of nothing but 5 km hops in January will read far above a summer average. That is the number being right, not wrong.