Repository navigation
Budgeting
Your plan for a month: what you mean to spend, earn and save. It starts at your Spending averages; change any number and the page updates. Save versions as budgets and compare them.
- Budgets
- The category table
- Credits and reimbursements
- Folding the cards
- Below the table
- Income
- Savings
- Annual expenses
- Emergency fund costs
- Buttons
- Where budgets show up
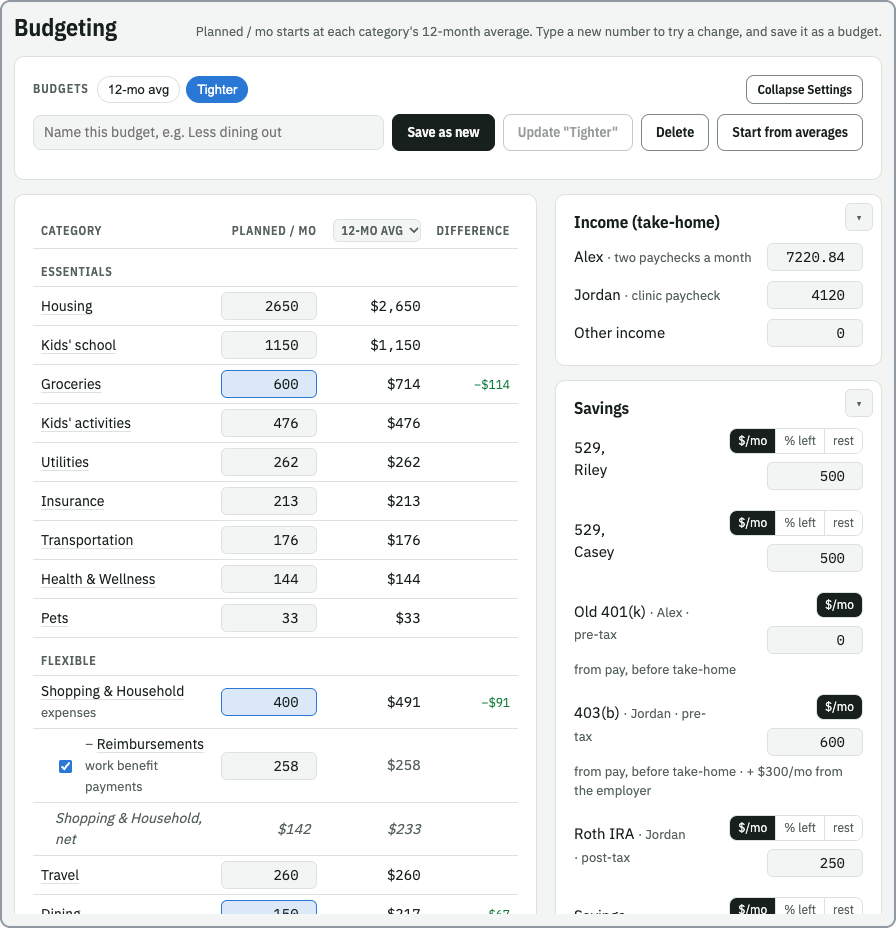
A budget is a named snapshot of everything in this section: planned categories, credit ticks, income, savings, annual expenses and emergency costs. (529 school and return settings and the retirement inputs are not part of a budget.)
| Control | What it does |
|---|---|
| 12-mo avg | Always first: the averages from your data. Click it to start from them. |
| A budget's button | Loads it. Blue means it's the one showing; • means unsaved changes. If switching would lose changes, you're asked to click again. |
| Name box + Save as new | Saves the current numbers under that name (Enter works too). |
| Update "…" | Saves your changes into the budget that's showing. |
| Delete | Removes it. Click twice. |
| Collapse Settings | Folds (or opens) the cards on the right; see Folding the cards. |
The line under the buttons only appears when there's something to say (unsaved changes, or "click
again"). Budgets are saved in the plan folder (.financial_planner/state.json). If a setting such
as a partner's pay changes later, budgets that never changed that number follow the new setting.
| Column | Meaning |
|---|---|
| Category | Click the name to see it in Spending. |
| Planned / mo | Your number. Starts at the 12-month average; type to change it. Changed boxes turn blue. The heading is a menu to fill the column. |
| Compare | Pick 12-mo avg or any saved budget in the column heading. Not editable. |
| Difference | Planned minus compare. Green = less spending (or more credit), red = more. |
Categories are grouped by their group (Categories) and sorted by size, with
Total regular spending at the bottom. Only regular categories appear; annual costs are in their
own box (below).
Pick a choice in the Planned / mo heading to fill the whole column at once:
| Fill from | Sets each category to |
|---|---|
| Spending chart: … | Its average over the period the Spending chart shows (a year, the months you selected…; for All data and Typical year: total ÷ months). |
| 12-mo avg | Its 12-month average (where every budget starts). |
| A saved budget | That budget's planned amount, and its credit ticks. |
Only the planned categories and credits change; income, savings, annual expenses and emergency costs stay as they are. A note under the buttons says what it was filled from.
Money coming in that offsets spending (work reimbursements, refunds) is a credit category. Tick it to subtract it.
- A credit that offsets a spending category appears under it, followed by a net line.
- A credit with no
offsets, or one that offsets an annual cost (a tax refund against income tax), appears below the total. - Credits against 1-time or emergency costs aren't planned (budgets have no line for those costs).
Whether each starts ticked comes from default_on.
Each card on the right (Income, Savings, Annual expenses, Emergency fund costs) has a ▾ / ▸ button that folds it to its title line. Collapse Settings / Expand Settings in the Budgets bar folds or opens them all. Folded cards are remembered in that browser.
Each line has Planned, Compare and Difference too:
- Net spending: planned categories minus ticked credits.
- Annual expenses: the annual list ÷ 12.
- Emergency fund costs: paid from the fund, so not counted in the total (unless there's no emergency fund).
- One line per 529, savings account, emergency fund and investment.
- Monthly total, spending + savings.
One row per partner (with the note you gave, e.g. "pay stub") plus Other income. Starts at the take-home pay in Settings › Household.
One row per child's 529, retirement account, savings account, emergency fund, stocks and bonds account (Settings › Household and Savings & income). Each row chooses how much goes in:
| Choice | Puts in |
|---|---|
| $/mo | A fixed amount every month. |
| % left | A share of what is left after spending, annual expenses and all the fixed amounts, kept between an optional min and max. The amount it works out to today is shown. |
| rest | Whatever is still left after the fixed and % rows. Several "rest" rows split it evenly. |
In Spending over time and Retirement, % and rest rows are worked out again each year, so they grow when the kids leave home or pay goes up.
Retirement accounts are pre-tax (a 401k / 403b: the money comes out of pay before take-home) or post-tax (a Roth IRA from take-home pay):
- Pre-tax rows on $/mo come out of pay. They don't change what's left over, and they aren't in the savings total or the monthly total (your take-home is already after them). The summary rows show them as "plus $… pre-tax from pay".
- Pre-tax rows on % left or rest, and every post-tax row, work like any other row: they take their share of the left-over.
- An employer match (set in Settings) is added to the balance on top; it isn't budget money.
- Contributions stop when that partner retires.
Savings accounts and emergency funds show their balance today. With a max balance, the note says the year it is reached (or that it won't be at this rate) and which investment gets the contributions after that.
Your own list of yearly costs: + Add, type a name (e.g. Taxes) and the yearly amount, × to
remove. Add as many as you like, or none. The box shows the total per year and per month, and that
monthly amount counts in the budget. Each budget has its own list; a new one starts from your
annual categories' yearly totals.
What you expect to take out of the emergency fund each month. Leave it empty to match what goes in (the fund holds steady); more makes it shrink, less makes it grow. The note says which. Whatever the fund can't cover comes out of that month. With no emergency fund, it counts as spending.
| Button | What it does |
|---|---|
| Reset to averages | Everything in this section back to the 12-month averages. |
| Try 10% less on flexible spending | Sets every category marked flexible to 90% of its average. |
- The same budget buttons sit at the top of College 529s and Retirement. They're one control: switching anywhere switches everywhere (529 and retirement savings come from the budget).
- The summary rows at the top of the page compare the Actuals (the period selected on the Spending chart) with any budget (Tour of the App).
- Spending can attach a budget to its chart.