Repository navigation
Spending
What your transactions actually show: month by month, by category, by merchant and transaction by transaction. Nothing here is a plan (that's Budgeting); every number comes from your CSVs.
- The chart
- Periods
- One month, day by day
- Attach a budget
- The category card
- Transactions
- Top merchants
- Recategorize mode
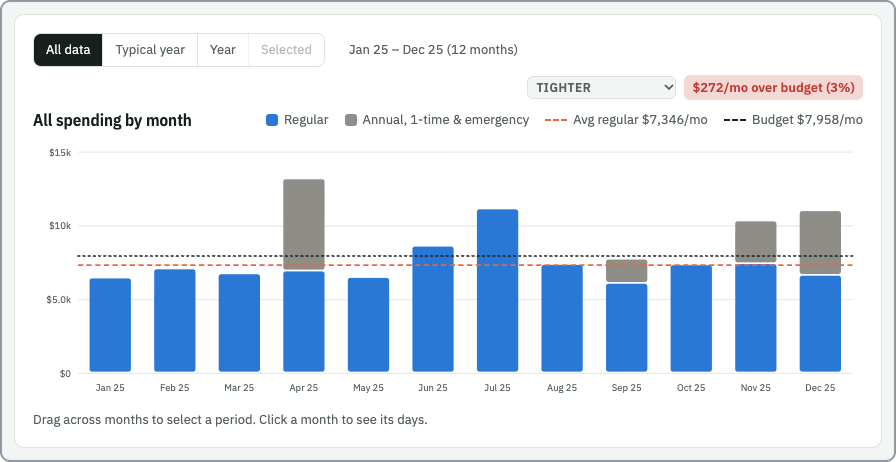
- All spending: blue bars for regular spending, gray for annual, 1-time and emergency costs. The orange dashed line is average regular spending for the period shown.
- Credits and Both (chosen in the category card): credits as their own bars, or below the line under spending.
- One category (click it in the category card): its bars and its average.
- Hover a bar for its breakdown.
The buttons above the chart choose the period. The category card, the transactions and top merchants all follow it.
| Period | Shows |
|---|---|
| All data | Every month in your CSVs. Drag across months to select some of them. |
| Typical year | Jan–Dec: each calendar month's average across all your data, with a line from its lowest to its highest year. Most useful with more than a year of data. |
| Year | The latest 12 months (the default with more than a year of data). Drag sideways or use ‹ › to move it back in time. |
| Selected | The months you dragged across in All data. |
The plan's averaging window (plan.months, usually 12) still decides Budgeting's starting averages;
the chart can show more than that.
Click a month to see a bar for each day of it. The transactions and top merchants switch to that month. ← Back to months returns.
Pick 12-mo avg or any saved budget in Attach a budget… (top right of the chart):
- a black dashed Budget line shows the budgeted amount per month (per day in the daily view);
- a badge says how far over (red) or under (green) budget the period shown was, e.g. "$272/mo over budget (3%)", or for one month "… in Jun 25";
- the category card gets a vs budget column.
The comparison is like for like: regular spending plus annual costs, against the budget's planned categories plus its annual expenses. Budgets have no line for 1-time purchases, and emergency costs come out of the emergency fund, so those are left out. So are the "Replace …" set-asides for property: that money is put aside, not spent. For one category, it compares that category with its planned amount. For credits, more than planned is green.

Spending / Credits / Both chooses the rows. Each row shows the average per month, the lowest and the highest month in the period, and (with a budget attached) vs budget: its % over (red) or under (green).
- Regular categories by group, with a Regular spending total.
- Annual, 1-time & emergency costs, each with a tick box (on by default).
-
Savings & transfers:
ignorecategories where money went out (transfers to savings, 529 contributions…), off by default. Card payments can be in here too; ticking them would count those purchases twice. - Credits: in Both, under the category they offset (or as Other credits); in Credits, all of them. Each has a tick box.
- The last row totals what is ticked. With a budget attached, a line under it gives the like-for-like % (above).
Click a category to see it in the chart; click the total to go back to everything.
- Search by description, pick a month, sort Largest first or Newest first.
- With no category picked, each row has a tag with its category.
- Up to 400 rows are shown; the count says how many matched and their total.
The ten biggest merchants in the period, with totals and counts. Store numbers and payment-processor
prefixes (SQ *, TST*…) are merged, so "SQ *TACO TRUCK 123" and "SQ *TACO TRUCK 456" count as one.
Click Recategorize (top of the Transactions card) to turn editing on. While it's on, clicking a transaction opens the rule dialog, where you can set its category or make a rule from it. Click Recategorize again to turn editing off.
It's off by default so that clicking around never changes anything by accident. After you save a rule, the page reloads with the new categories, and your place on the page is kept.
For the full transaction table and the rule list, use Settings › Categorize.