Repository navigation
Extra Layers
🇮🇱 עברית
These tools live in the toolbar's 🗂 Extra layers section. They are planning aids layered on top of the route — none of them change the route itself. The original IMS charts (SIGWX, wind/temp) open from the Charts section; the on-map overlays toggle here in Extra layers.
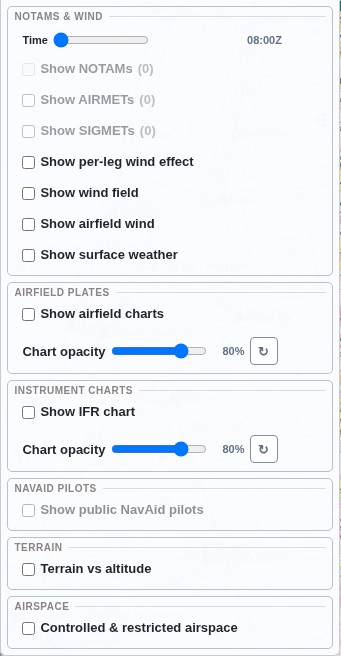
Every layer is a uniform card: a Show … toggle on top, its controls (sliders / selects) below, with identical spacing and widths across all of them. The cards render flat in dark mode and bordered in light, matching every other toolbar menu.
Nothing in the next 24 hours? The NOTAM, AIRMET and SIGMET toggles here and their list buttons in Charts dim when nothing is in force at any time across the time slider's range (24 h) — and stay lit for something that starts later in it (a list opened then shows those). Dimmed means not usable: a dimmed toggle does not switch, and a tap on it (or on a dimmed list button) says why. Your on/off choice is kept, so the layer shows by itself once something comes into force.
All map-layer toggles read consistently: Show NOTAMs, Show AIRMETs, Show SIGMETs, Show wind effect, Show wind field, Show wind/temp, Show SIGWX.
International SIGMETs (turbulence, icing, mountain wave, volcanic ash, dust, tropical cyclone, thunderstorm) for the Tel Aviv FIR and its neighbours: Nicosia, Beirut, Damascus, Amman, Cairo and Ankara. Most days there are none; then the map toggle and the list button are dimmed, and a tap says why.
-
On the map — toggle Show SIGMETs (next to Show AIRMETs) to draw every active SIGMET
that has a usable area — valid coordinates with at least part of the area in the region, so a
neighbouring FIR's SIGMET that reaches well beyond it (Jeddah's, say) is drawn and counted
like any other, and the count here always matches the list in Charts. Off by default (
defaultShowSigmet; your choice isnavaid.showSigmet, synced). Tap an area to open that SIGMET's card; the area flashes. -
The list — a ⚠ SIGMET button in Charts. It is built exactly like the
NOTAM list: the title with the count, one Raw / Decoded switch for the whole
list, the Updated line (when the feed was fetched), and a card per warning. The card's
header reads
SIGMET 8 · LTAA · 03 14:25Z → 03 18:25Z; below it the decoded headline ("Embedded thunderstorms — observed") and one line with the rest: levels, area, movement, change, FIR. Click a card with an area to close the list, turn the layer on and frame the area on the map. - Decoded — the raw ICAO text is read into plain language in the UI's language (English or Hebrew): validity, FIR, the hazard (qualifier and phenomenon), observed or forecast, the area (inside the drawn polygon, one side of a line, or the whole FIR), levels, movement, change, and cancellations. Raw shows the original text instead, one view at a time.
- The FIR name is not the place. A SIGMET names the FIR that issued it: LTAA ANKARA FIR covers almost all of Turkey, so an "Ankara" SIGMET can sit over Van or Batman. Read where it is from its area, not its name. The same holds for LLLL TEL AVIV FIR over the Negev.
-
Source: NOAA Aviation Weather Center, refreshed ~every 20 min by
aviation-data.ymlto thesigmet-databranch. The app also re-fetches it every ~10 min in-session, so a new or expired SIGMET updates without a page reload. A warning whose corner is mistyped in the feed (a live one gave E00356 for E03556, in the Atlantic) is listed but not drawn or framed.
(Israeli AIRMETs — a different product, issued by the IMS — are the AIRMET layer below.)
Toggle Show AIRMETs to overlay active IMS AIRMET hazard areas for the Tel Aviv FIR — mountain obscuration, IFR, surface wind. These are not in the SIGMET feed above: that reads NOAA, which carries international SIGMETs, not Israel's domestic AIRMETs. They come straight from the IMS.
-
On the map — each AIRMET is a dotted polygon (distinct from the SIGMET dash),
labelled with its hazard (e.g.
MT OBSC), in one tunable colour (airmetColor). The toggle is dimmed while no AIRMET is active — most days there are none — and a tap says why. -
Reading the text — the hazard label is only the headline. For the validity (in Zulu),
the exact phenomenon and the movement (
STNR,WKN, …), open the card: the ⚠ AIRMET button in Charts lists every active AIRMET, and a tap on an area opens just the ones at that spot, flashing the area. The list is the same as the SIGMET list: a Raw / Decoded switch, the Updated line, a card per warning (AIRMET 23 · LLLL · 02 19:00Z → 02 23:00Z, then "Mountains obscured — forecast" and the rest), and a click on a card frames it on the map. -
Source —
ims.gov.il/he/aviation_data. A browser cannot read the IMS cross-origin, so a scheduled Action (aviation-data.yml) fetches it, parses the phenomenon, the polygon (theWI …coordinates) and the UTC validity out of the raw ICAO text, and publishesairmet.jsonto theairmet-databranch — the same path the SIGMET and IMS-chart feeds use. Planning aid only — confirm against an official briefing. The app re-fetches the feed every ~10 min in-session, so a newly issued AIRMET appears — and an expired one drops — without a page reload. -
AD / WS — the IMS also issues aerodrome (
AD WRNG) and wind-shear (WS WRNG) warnings. Those are point/aerodrome products, not FIR polygons, and are not shown on this layer; the feed reads the product type from the text so they are never mislabelled as AIRMETs. -
Gist —
defaultShowAirmetsets the default;navaid.showAirmetremembers your choice;airmetColorsets the area colour.
Toggle Show NOTAMs to overlay active NOTAMs for the Israel FIR (LLLL).
- Map geometry — polygons, circles, route-closure lines, and a count badge at airfields for NOTAMs that carry no coordinates.
- Click / hover any area, line, or badge to open that NOTAM's text. Where a NOTAM overlaps another marker (VOR / airfield / nav-WP), it appears in the Choose point picker.
- Decoded view — the NOTAM text is decoded from the ICAO Q-code (subject + condition) with abbreviations expanded to plain English; a Raw toggle in the list modal shows the original source text.
- Look-ahead slider (0–72 h) under the toggle scrubs which NOTAMs are active at a future time — one unified slider also drives the wind-effect and wind-field look-ahead. Set forward, it points at a fixed Zulu instant and counts itself back toward live as time passes (+3 h → +2 h → … → now), snapping to live once now catches up. The panel also shows the feed's last-update time.
- Live refresh — the NOTAM feed is re-fetched in-app every ~10 min, so a NOTAM issued or cancelled mid-session appears (or drops) on the map, in the list and in the count without a page reload.
-
NOTAM list — a full-text list button lives in the Charts section. It opens sorted by
relevance: NOTAMs whose geometry touches your planned route first, then ones at your
departure or destination, then FIR-wide (
LLLL), then the rest — soonest-mattering first inside each band. A Sort dropdown offers NOTAM number, start time and end time instead. Airfield names are shown beside the codes, the list includes NOTAMs that have not started yet, and the sheet remembers the size you drag it to (navaid.notamModalSize, device-local). An airfield's own NOTAMs open the same sheet, filtered. Drag the sheet by its title to move it; it opens again where you left it (navaid.notamListPos, per language). The SIGMET and AIRMET lists move the same way, and like the NOTAM list resize from their bottom-right corner (navaid.sigmetListSize/navaid.airmetListSize). -
New since you last looked — the list is identical every time it opens, which makes
"what changed?" a re-read of the whole thing. Every NOTAM this device has already been
shown is remembered, so anything else is badged NEW and counted in the title —
Active NOTAMs (LLLL) — 3 · 2 new. The first look badges nothing: with nothing
stored, every NOTAM in the country would be new. Marking happens when you close the
sheet, not as it draws, so the badges stay readable while you read them — and everything
shown is marked, not only what a filter left visible. Ids are forgotten after
notamSeenDays(90). Kept innavaid.notamSeen, device-local and never synced: it records what you have read, and a new phone has read nothing. -
CVFR route closures that name fixes (e.g.
BTN NEGEV-HOVAV) are drawn as lines by resolving the fixes against the nav-waypoint / airfield / VOR data; reroute (DIVERTED VIA …) paths draw in a distinct colour. -
Border-buffer NOTAMs (e.g. "FM LEBANON BOUNDARY TO 8KM") carry no
coordinates, so they're geocoded from an Israel border dataset
(
data/notam-borders.json) into a buffer polygon. -
Source: the IAA Mobile AeroInfo site (
brin.iaa.gov.il/MobileAeroinfo), the authoritative national source — refreshed bynotam.ymlto thenotam-databranch. It carries the domestic C-series (airfield / CVFR / UAS / airspace closures) that international feeds like autorouter and FAA SWIM do not. Planning aid only — confirm against an official briefing. -
Straight from the source, never via another service. Other Israeli flight-planning sites
publish the same NOTAM, and some of them receive that data under agreements that forbid
passing it to a third party. Reading it from them would make NavAid that third party, so
every aviation feed here is fetched from the body that publishes it —
tests/no-third-party-flightplan-api.spec.jskeeps it that way across the app, the data, the scripts and the workflows.
The feed is FIR-wide (one LLLL source, ~120 NOTAMs) with no per-chart field, but two things are now chart-aware:
-
Ultralight NOTAMs go to the Low Alt chart. NOTAMs whose text names an ultralight bubble (
ULTRALIGHT BUBBLE CLSD HAHULA (BHULA), powered paragliding, microlight, hang gliding) are shown on Low Alt only — they are that chart's business and clutter a CVFR plan. Everything else appears on every chart. -
Helicopter NOTAMs are deliberately not separated. Most
HELmentions in this feed are general closures that merely name it ("AD CLSD TO ALL FLT INCLUDING HEL"), so filtering on them would hide FIR-wide NOTAMs from CVFR — worse than showing a heli route closure everywhere.
Show NOTAMs is remembered per chart (navaid.showNotam.<cvfr|lsa|heli>): CVFR cross-country can keep the airspace NOTAMs up while an LSA or helicopter chart is flown without them. A chart you have never set inherits whatever you chose last, so nothing disappears the first time you switch; the charts diverge only once you actually toggle one. On Satellite / OSM / Navigation the choice follows whatever Nav waypoints from is showing.
Toggle Show wind effect to draw per-leg wind arrows, the route-wide wind readout, and the wind-triangle row in the leg inspector (wind correction angle, ground speed).
-
Route-wide wind defaults to calm (
000° / 0 kt); tunable (windDir/windSpeed). Fetch wind pulls forecast winds aloft per leg.
Toggle Show wind field for an animated winds-aloft field (~3000 ft) from a live Open-Meteo grid, with altitude / time / opacity controls. It works anywhere in the world:
- The grid follows the map — the area in view plus a 30% margin.
-
Its spacing follows the zoom, keeping about 200 points (
windFieldMaxPoints): 0.25° close in, then 0.5 / 1 / 2 / 5° over a region or a continent, up to 20° for the whole world. It is snapped to that spacing, so a small pan asks for the same points. - It reloads once the view settles (0.7 s) when you pan outside the fetched area or zoom in well below its spacing; zooming out redraws over the whole new view.
- It stops at the world's edge: zoomed far out, nothing is drawn over the grey beyond 180° E/W.
- It turns with the map: on a rotated or heading-up map the particles still flow the way the wind blows over the ground, including a field switched on, or reloaded, while the map is turned.
The gist switch windFieldFollowMap (default on) set to off brings back the fixed box over Israel
(windFieldWest/East/North/South).
Toggle Show wind/temp to lay the IMS PWX wind & temperature forecast over the map.
- Flight levels — all published levels: FL030, FL050, FL100, FL180, sorted low→high and defaulting to FL030.
- Valid time — auto-selected to the forecast closest to now (Zulu); the period is kept when you switch level. The dropdown (shared with SIGWX) refreshes live: newly published valid times are added and the auto-selection advances as Zulu passes — no page reload — while a time you pick yourself is left alone, and is only released if it ages out of the feed.
- Opacity slider (default 60 %, ↻ reset). In dark mode a footer backdrop band keeps the chart's footer legible.
-
Source:
ims-charts.yml(hourly) →ims-databranch (pwx.json). -
Fine-tune alignment in Tuning Panel → Weather (IMS)
(
imsPwxLatOffset/LngOffset,imsPwxLatScale/LngScale,imsPwxRotationDeg).
The original full charts open from Charts → 🌬 Wind/temp charts (image viewer by level + valid time).
Toggle Show SIGWX to overlay the IMS low-level significant-weather prog-chart on the map by valid time (also auto-set to nearest now).
- The chart is split into two: the map frame is georeferenced over Israel
(aligned to the LLHA, LLBS and LLIB airfields), and the legend — the
title/valid-time header over the weather table, blank paper cut out — is one
square image parked east of Israel, its top edge at
sigwxLegendTopLat(33°N) and its west edge atsigwxLegendWestLng(36°E),sigwxLegendWidthDeg(3.5°) wide. -
The legend stays readable on a turned map. It does not turn with the map: it
turns back in quarter turns (
sigwxLegendStepDeg, 90°), so it is always upright or on its side, never at an odd angle. Being square, it covers the same patch of map either way. 0 makes it turn with the map.sigwxLegendSquareoff lets it be as tall as its content;sigwxLegendGapPctis the gap left where paper was cut. - Tapping the overlay does nothing — no popup; the full chart is in Charts.
- In dark mode the map panel's pale paper + terrain are knocked out so the base layer (CVFR, etc.) shows through — only the coloured hazard areas + labels overlay.
-
Fine-tune everything in Tuning Panel → SIGWX overlay
(panel offset / scale / rotation / opacity / white-knockout, and the
sigwxLegend*settings). The oldsigwxTbl*offset and scale no longer apply;sigwxTblOpacitystill sets the legend's opacity.
The original full chart opens from Charts → 🌐 SIGWX charts (image viewer by valid time). Pinch to zoom in the viewer, drag to pan, double-tap to zoom in or back out.
Extra layers → Terrain + the leg MSA row. The one question a chart cannot answer: does the ground reach the altitude I am planning to fly?
It shades only the ground that threatens the plan:
| Shading | Meaning |
|---|---|
| Red | Ground at or above the planned altitude |
| Amber | Ground within the clearance below it — the margin is thin |
| nothing | Everything else. A route planned well clear paints nothing at all |
The altitude it measures against is the selected leg's, or if nothing is selected, the lowest planned altitude on the route — the leg that decides whether the plan is flyable.
terrainWarnClearanceFt ships at 500 ft, the rule outside congested areas. Over built-up
ground the rule is 1000 ft above the highest obstacle within 2000 ft horizontally; set the
knob to 1000 to see that stricter picture.
It deliberately does not use the MSA buffer. MSA is terrain + 1000 ft on every leg regardless — a planning figure, not a limit — and warning on it marks routes that are flown every day: the LLHZ→LLHA coast run at 1000 ft passes over ~200 ft of ground. A warning that fires on the ordinary case is the one nobody reads on the day it matters.
The grid's own resolution helps: each cell carries the maximum elevation over roughly a kilometre, so sampling along a leg approximates the highest thing within about 2000 ft of track rather than the elevation of one point beneath it.
A leg whose planned altitude fails the clearance gets a casing under the route line, and the waypoints at each end get a ring — those are the points you read when deciding what to file. Red where the ground is above the plan, amber where the margin is thin; a waypoint on both takes the worse. It is drawn beneath everything, so the line, its kites and its labels are untouched.
Legs with no altitude typed are not marked: there is nothing to contradict.
It judges the line you draw. A direct leg sketched where the published corridor bends around terrain is flagged — correctly, but that is the sketch, not the route. (A straight BOREN→LLHA line crosses the Carmel at 1578 ft; the published arrival, BOREN→HOTRM→DAROM→GALIM→LLHA, never exceeds ~900 ft and is silent at a normal altitude.)
There is no obstacle data: masts, antennas and cables are not in the grid, and a ridge narrower than a cell can hide in the average. Outside the covered box nothing is drawn at all.
Planning aid only — not a terrain-awareness system. Verify against the current chart.
The flight-plan profile strip draws the same grid as a ground silhouette under the altitude line, with a dashed safe-altitude line at terrain + MSA buffer, so a leg planned into rising ground is visible rather than arithmetic.
Toggle Show LSA bubbles to overlay LSA airspace areas — "bubbles" — as filled rings under the waypoints. This control only appears on the Low Alt base layer; the bubbles exist nowhere else, so on other layers the toggle is hidden. The toggle defaults on and its state is remembered.
-
Legend colours — matching the official chart:
- always = green outline + pale-green fill (in force every day);
- weekend = black outline + tan fill (in force on the Israel weekend, Fri–Sat, only).
-
Named bubbles — a bubble's name is drawn at its centroid once you're zoomed in enough to read it (Hebrew name on the Hebrew UI, English otherwise).
-
📋 LSA bubbles — a list button in the Charts section (shown only while the overlay is on and areas have loaded on the Low Alt layer). It opens a list of the bubbles (weekend ones tagged); click a row to zoom to that bubble, which flashes amber briefly so you can spot it.
-
Activity sites — drawn with the bubbles (same toggle): 6 parachute drop zones (Rosh Pina, Akko, Ramat David, Habonim, Masada, Teyman) and 24 hang-glider / paraglider launch points, read off the LSA chart's legend. Hidden below zoom 9 (
activityMinZoom). -
Legend — on Low Alt the map legend adds the chart's own rows: frequency change, bubble every day, bubble weekends only, parachute drop zone, hang-glider / paraglider launch.
The bubble data comes from data/lsa-areas.json.
The airfield-plate overlays below (circuit / training / CVFR / helicopter / comm-failure / aerodrome chart) are one Show airfield charts toggle with a Which chart picker — one type at a time — and share one Plate opacity slider and a Show plates for picker at the top of the Airfield plates group. Because two nearby fields' full-page plates can overlap (e.g. LLKS and LLIB), the picker limits which airfields' plates are drawn:
- All airfields (default) — every field's plate for each enabled overlay.
- Auto (route start + end) — only the plates for the first and last airfield on your current route; updates live as you edit the route.
- A single airfield — show only that field's plates.
The choice applies across all the plate types and is remembered
(navaid.plateAirfield).
Toggle Show circuit patterns to lay each airfield's official circuit / VFR plate on the map, georeferenced in place, so you can see the published traffic pattern against the live chart and your route. An opacity slider (default 60 %, with a ↻ reset) fades the plates against the base map; the toggle and opacity are both remembered.
- Coverage — Israeli GA airfields with a georeferenced circuit plate: LLHZ, LLHA, LLIB, LLBS, LLAR, LLBO, LLEY, LLMZ, LLFK, LLKS, LLKZ, LLMG, LLRS. Airfields whose only plate is a text sheet (not a map) are omitted.
- Georeferencing — each plate is cropped to its map neat-line and pinned so its runway sits on the real runway (anchored to the OSM runway / the plate graticule), i.e. it registers with the CVFR base map.
The plate images live in docs/circuit-img/; the bounds are the
circuit_overlay field on each airfield in data/airfields.json.
Toggle Show training areas to overlay each airfield's training-area (אזורי אימון) plate — the numbered training zones, entry/exit routes and holding areas around the field. Independent of the circuit toggle, with its own opacity slider (default 60 %, ↻ reset); both remembered.
- Coverage — airfields with a training-area plate: LLHA, LLHZ, LLIB, LLBS, LLMG, LLRS.
- Georeferencing — bounds are derived from the plate's labelled meridians/parallels (the same true-coordinate grid the CVFR base uses), so the zones register with the base map.
Images live in docs/training-img/; bounds are the training_overlay field in
data/airfields.json.
Toggle Show CVFR entry/exit routes to overlay each airfield's official CVFR entry/exit route plate (נתיבי כניסה ויציאה CVFR) — the published low-level transit routes into and out of the field. Own opacity slider (default 60 %, ↻ reset); both remembered.
-
Coverage — every field that publishes a route plate: LLAR, LLBO, LLBS,
LLEY, LLFK, LLHA, LLHZ, LLIB, LLKS, LLMG, LLMZ, LLRS. Four of those plates are
not printed north-up — LLFK, LLIB, LLMG and LLRS — so their overlays carry three
corners (
tl/tr/bl) instead of a north-up box (sw/ne). - Georeferencing — cropped to the neat line, bounds fitted to the plate's own labelled graticule, snapped to the minute ticks in the gutter between the double neat line (only one of the two label rows is centred on them). Two checks before a plate ships: the degrees-per-pixel ratio must equal cos(latitude) — true only if the projection was read correctly — and the airfield must land where the plate draws it.
-
Tool —
scripts/georef-plate.pydoes the fit and the crop:python3 scripts/georef-plate.py "docs/byop/<plate>.pdf" <ICAO> --write. Plates whose labels are drawn as outlines (LLBO) carry no readable text; measure their label centres off the render and pass--lon/--lat.
Images live in docs/cvfr-img/; bounds are the cvfr_overlay field in
data/airfields.json.
Toggle Show comm-failure joining to overlay the radio comm-failure joining chart (הצטרפות בתקלת קשר מנתיבי CVFR) — the routes to fly to rejoin the field after a radio failure. Own opacity slider (default 60 %, ↻ reset).
- Coverage — LLHA (dedicated comm-failure plate) and LLHZ (its own loss-of-comm chart). Fields whose comm-failure procedure is text only (no map) are omitted.
Images live in docs/commfail-img/; bounds are the commfail_overlay field in
data/airfields.json.
Pick Aerodrome chart (תרשים שדה) under Which chart to lay the AIP Annex A aerodrome chart on the map: runways, taxiways, aprons, holding points and the field's own notes.
- Coverage (11) — LLAR, LLBS, LLEY, LLFK, LLHA, LLHZ, LLIB, LLKZ, LLMZ, LLRS, LLER. LLBG and LLMG are left out: their charts could not be placed reliably.
- Placed on the airport the VFR chart draws — the CVFR and Low Alt charts draw an airport as a runway symbol larger than the real runway, and often 100–300 m from it. Each aerodrome chart is scaled, moved and turned so its runway lands on that symbol, so it reads against the chart you fly. Over Satellite or OpenStreetMap it is therefore larger than the real runway.
- Readable from about zoom 15.
Images live in docs/adc-img/; corners are the adc_overlay field in data/airfields.json,
built by scripts/georef-adc.py and refitted to the chart symbol by
scripts/adc-vfr-capture.js + scripts/adc-fit-vfr.py. defaultShowAdc / navaid.showAdc.
Toggle Show helicopter entry/exit routes to overlay each field's helicopter
entry/exit route plate (נתיבי כניסה ויציאה מסוקים). Own opacity slider
(default 60 %, ↻ reset). It ships off (defaultShowHeli) — switch it on when you
need it. This is separate from the Helicopters base chart, which the live site does not
offer at all (see Map Layers).
- Coverage — LLBS, LLHA, LLHZ, LLIB. (LLMG's only "helicopter" sheet is its training-areas chart, already covered by the training overlay.)
Images live in docs/heli-img/; bounds are the heli_overlay field in
data/airfields.json.
Moved: the CAA's ENR 6.1 sheet is a chart, not an overlay drawn on one, so it lives in the Layer picker with CVFR, Low Alt and the rest — see Map Layers. To read it over another chart, pick it there and set Base map in Display to what you want underneath.
Its own frame, below the airfield plates. Show IFR chart draws one instrument sheet and Which chart says which — LLBG alone publishes twenty that can be placed, so a single toggle would stack twenty pictures of the same few miles.
- Coverage — 23 sheets: LLBG (ILS 08/12/30, LOC 12/21, six RNPs, seven SIDs, STAR 12-1, VAC 30-2), LLIB (SID 15/33, VOR approach) and LLHZ's נספח ח׳ departure to the ATS routes.
- One at a time, and it cancels the VFR plates as they cancel each other: an approach plate and a CVFR entry sheet are two pictures of the same ground.
- "Show plates for" does not reach it. That control narrows layers which draw a sheet per field; this one draws the sheet you named, at the field you named it for.
- Picking a sheet takes the map to it — unless a fix is driving the map.
- The positions the sheet prints in full become chart points while it is showing: tap one for the inspector, or put it in a route. Twenty of them across thirteen sheets — a VOR, an IAF, the field. A fix the sheet names without a position is not invented.
Not every instrument sheet can be drawn. Every LLER SID, IAC and STAR, four LLBG STARs and Haifa's STAR are schematics with no graticule: nothing to place them by, and a plausible guess on an approach chart is worse than none. They stay in Charts.
Images live in docs/ifr-img/; bounds, designation and points are the ifr_overlays field in
data/airfields.json, built by scripts/build-ifr-overlays.py and
scripts/extract-plate-points.py.
Any plate the map can draw carries 🗺 Show on map in its viewer, beside Open and Download. It switches the right layer on, points Show plates for at that field and goes there; for an instrument sheet it selects that sheet rather than leaving you to find it in the list. A text page or a parking chart has nothing to draw, so it has no button.
Extra layers → Controlled & restricted airspace draws 50 areas from the AIP: the 15
prohibited areas (LLP*) and 22 restricted areas (LLR*) of ENR 5.1, the nine
Ben-Gurion TMA sectors of ENR 2.1, and the four CTRs of AD 2.17 — Haifa,
Ben-Gurion, and Eilat Ramon north and south. Prohibited red, restricted amber, TMA blue,
CTR teal, each labelled with its identifier and vertical limits from zoom 9 up.
Four different things share the layer, which is why it is not called "blocked airspace":
| Means | |
|---|---|
LLP12 |
Prohibited — closed |
LLR24 |
Restricted — conditional: published hours, an activating NOTAM, or a live-fire / parachuting window |
BG TMA W |
Controlled — Ben-Gurion's own airspace, entered with a clearance |
LLHA CTR |
Controlled — the airspace around a field, entered with a clearance from its tower |
The outline is only half the answer. These boundaries are lateral: a leg that crosses one on the map may be thousands of feet above or below it. That is why every area is labelled with its limits, and why the inspector compares them against your route.
The Inspector shows what the AIP prints beside the boundary: class in words, vertical limits, activity (training, live fire, parachuting…), the schedule with active now / not active now where the printed hours decide it, Activation: by NOTAM with any live NOTAMs naming the area, the area's own quoted name ("Eilat" (LLR27)), its size, its distance and bearing from you, and the AIP edition it was read from. TMA sectors also carry their controller's frequencies — APP/DEP control 120.500, TMA control 119.500 and the secondaries.
With a route loaded it also says where that route stands: clear of it, crosses it, inside its limits, or crosses it, below the base (4000 ft).
Active now is only claimed where the text decides it. H24, and windows like
Sun 04:00 (UTCW) – Thu 19:00 (UTCW), are read in UTC. Anything resting on sunrise, sunset
or the holiday calendar shows nothing rather than guessing — a confident "not active" over a
live-fire area is the one wrong answer that matters.
docs/data/airspace.json, built by scripts/extract-airspace.py from the AIP PDFs kept in
docs/byop-enr/. The AIP describes a boundary the way a controller reads it out — corner
lists, "A circle radius 6 KM centered on…", "then a clockwise arc radius 47 NM centered
on…" — and the script turns that into closed rings.
It refuses rather than guesses: LLP20 prints no coordinates at all and is left out by name,
and a boundary that follows a national border is reported instead of invented. Re-run it
after an AIRAC update and bump ?v= in loadAirspace().
Tunables: defaultShowAirspace, airspaceProhibitedColor, airspaceRestrictedColor,
airspaceTmaColor, airspaceFillAlpha, airspaceLineWidthPx, airspaceLabelMinZoom,
airspaceLabelFontPx.
Every overlay the map draws — a circuit, a CVFR sheet, an instrument chart, the ATS plate — carries a small ✕ at its top-left corner. It turns that layer off from the chart itself, without going back to the menu to find which of several tick-boxes put it there. It hides the whole family, not the one sheet: that is what "put this away" means when you are looking at it.
The airfield-plate overlays (circuit / training / CVFR / helicopter /
comm-failure) can be nudged, scaled and rotated by eye against the base map — a
hidden developer / power-user tool, off by default (like the
Tuning Panel). Enable it with ?align=1 in the URL (e.g.
https://navaid.supino.org/?align=1); an Align overlays toggle then
appears in the Airfield plates group.
- Turn on the overlay layer you want to fix (e.g. Show circuit patterns).
- Tick Align overlays, then click the overlay on the map to select it.
- Drag to align: centre = move, corner squares = scale, top dot = rotate.
- The floating panel shows the live corners; every drag auto-saves to
localStorage["navaid.overlayBoundsOverrides"](survives reload). -
Copy coords exports the adjusted geometry as JSON to bake into
airfields.json; Reset this / Reset all discard overrides.
An override wins over the airfields.json bounds for that plate until reset.
Overlays can be axis-aligned (sw/ne) or rotated (three corners
tl/tr/bl, rendered via L.imageOverlay.rotated) — e.g. the LLHZ and LLBO
circuit plates are stored rotated.
The Extra-layers menu is organised into titled, bordered frames, each grouping related toggles: NOTAMs & wind (NOTAMs, per-leg wind effect, wind field), Weather charts (wind/temp PWX, significant weather SIGWX), Airspace (LSA bubbles), Airfield plates (the six georeferenced IAA-plate overlays above) and Enroute charts (the ATS routes sheet, which is not a plate and says so by having a frame of its own). Frames whose layers are unavailable on the current base map collapse out of the menu.
- IMS / NOAA / IAA data is advisory and may lag; always confirm against an official briefing.
- A scheduled monitor (
charts-monitor.yml) checks each data feed's freshness and opens a tracking issue if a feed goes stale.
Show public NavAid pilots draws everyone sharing their position publicly (Share → Public), from the NavAid relay — not ADS-B. Works while you share publicly yourself, or on the secret viewing link. See Follow me → Public share.