The Graphical User Interface
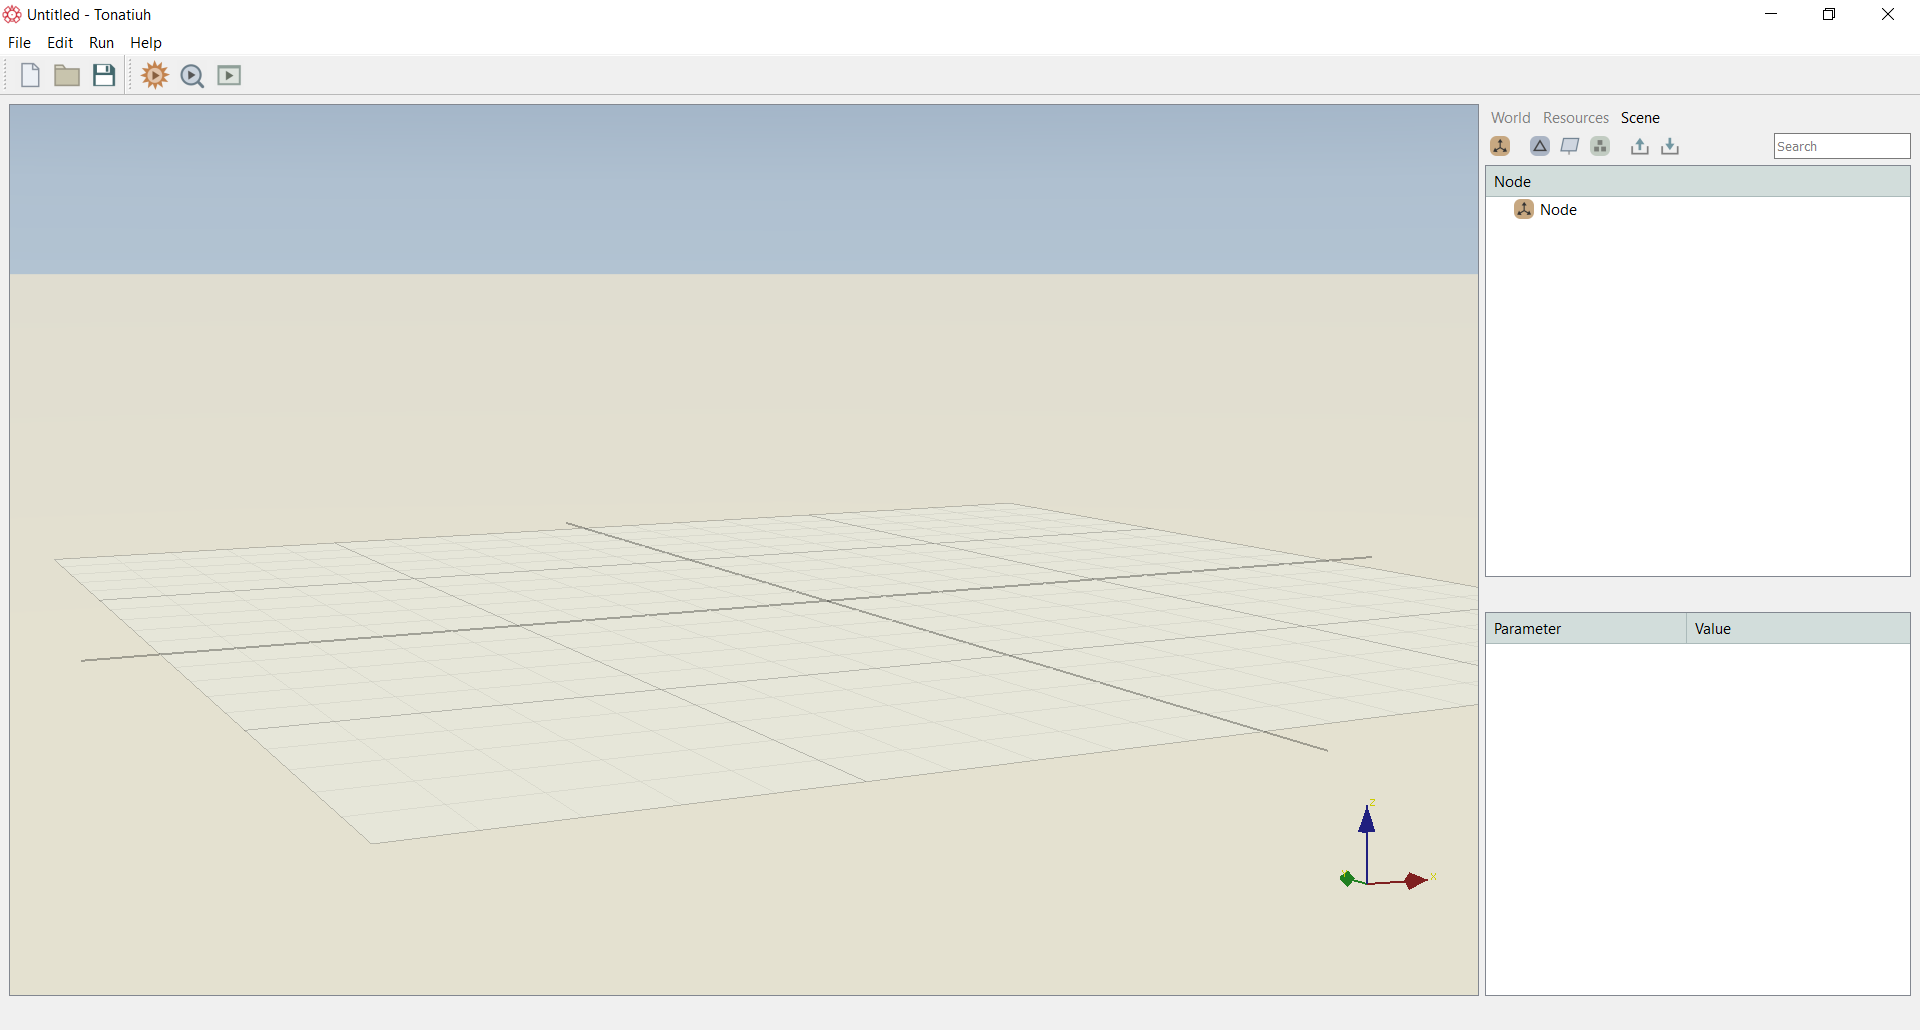
The Graphical User Interface (GUI) of Tonatiuh++ is shown in the figure below. It consists of two main regions, the main graphics window and the vertical panel at the right of the screen. The main window is used for the visualization of the scene, while the vertical panel on the left is used for setting up the scene and all related parameters necessary for performing ray tracing simulations. The right vertical panel is divided into two panels, the top and the bottom panel where the user can add the simulation's parameters as seen in the figure.
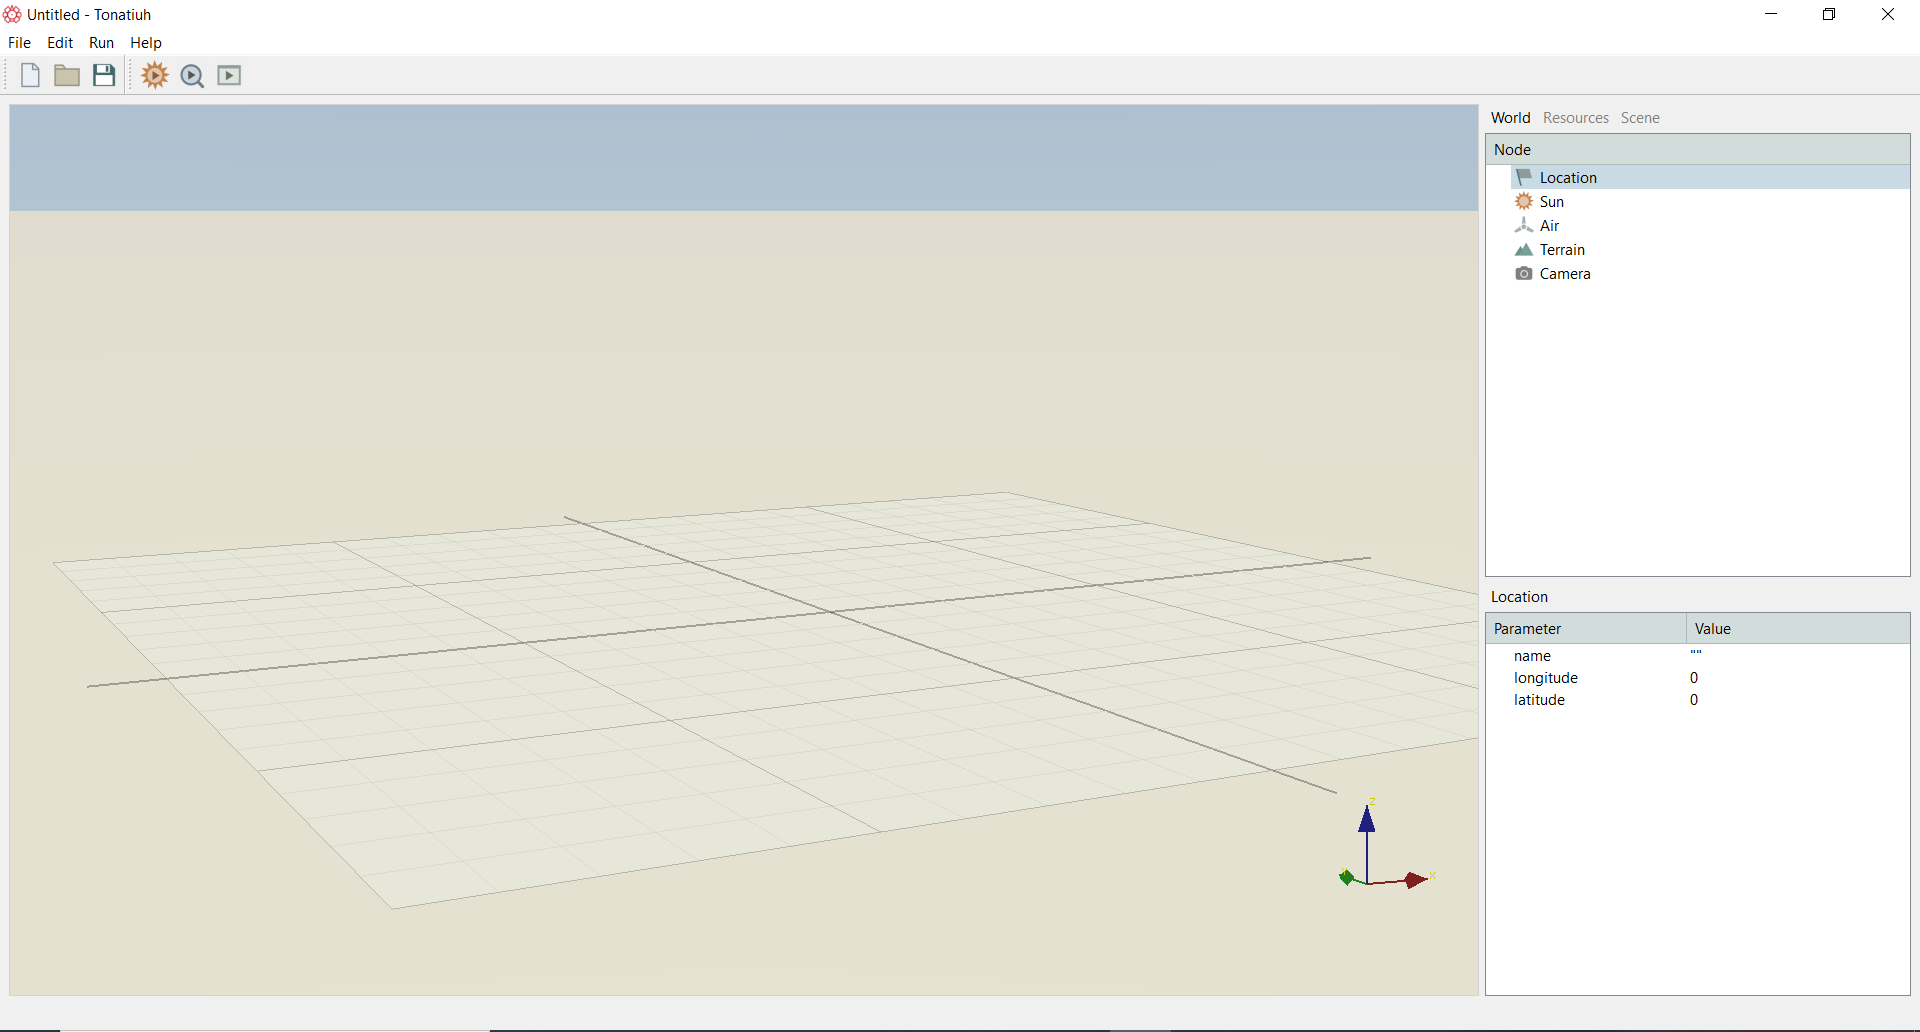
The vertical window on the right has three tabs named: World, Resources and Scene. Figure below shows the contents of the World tab. This includes the nodes that are related to the Location, Sun, Air, Terrain and Camera settings of the simulation. Pressing one of the nodes, i.e. Location , enables its parameters in the bottom vertical panel. For this example related to the Location, the user can add the name of the simulation along with the longitude and magnitude of the location.
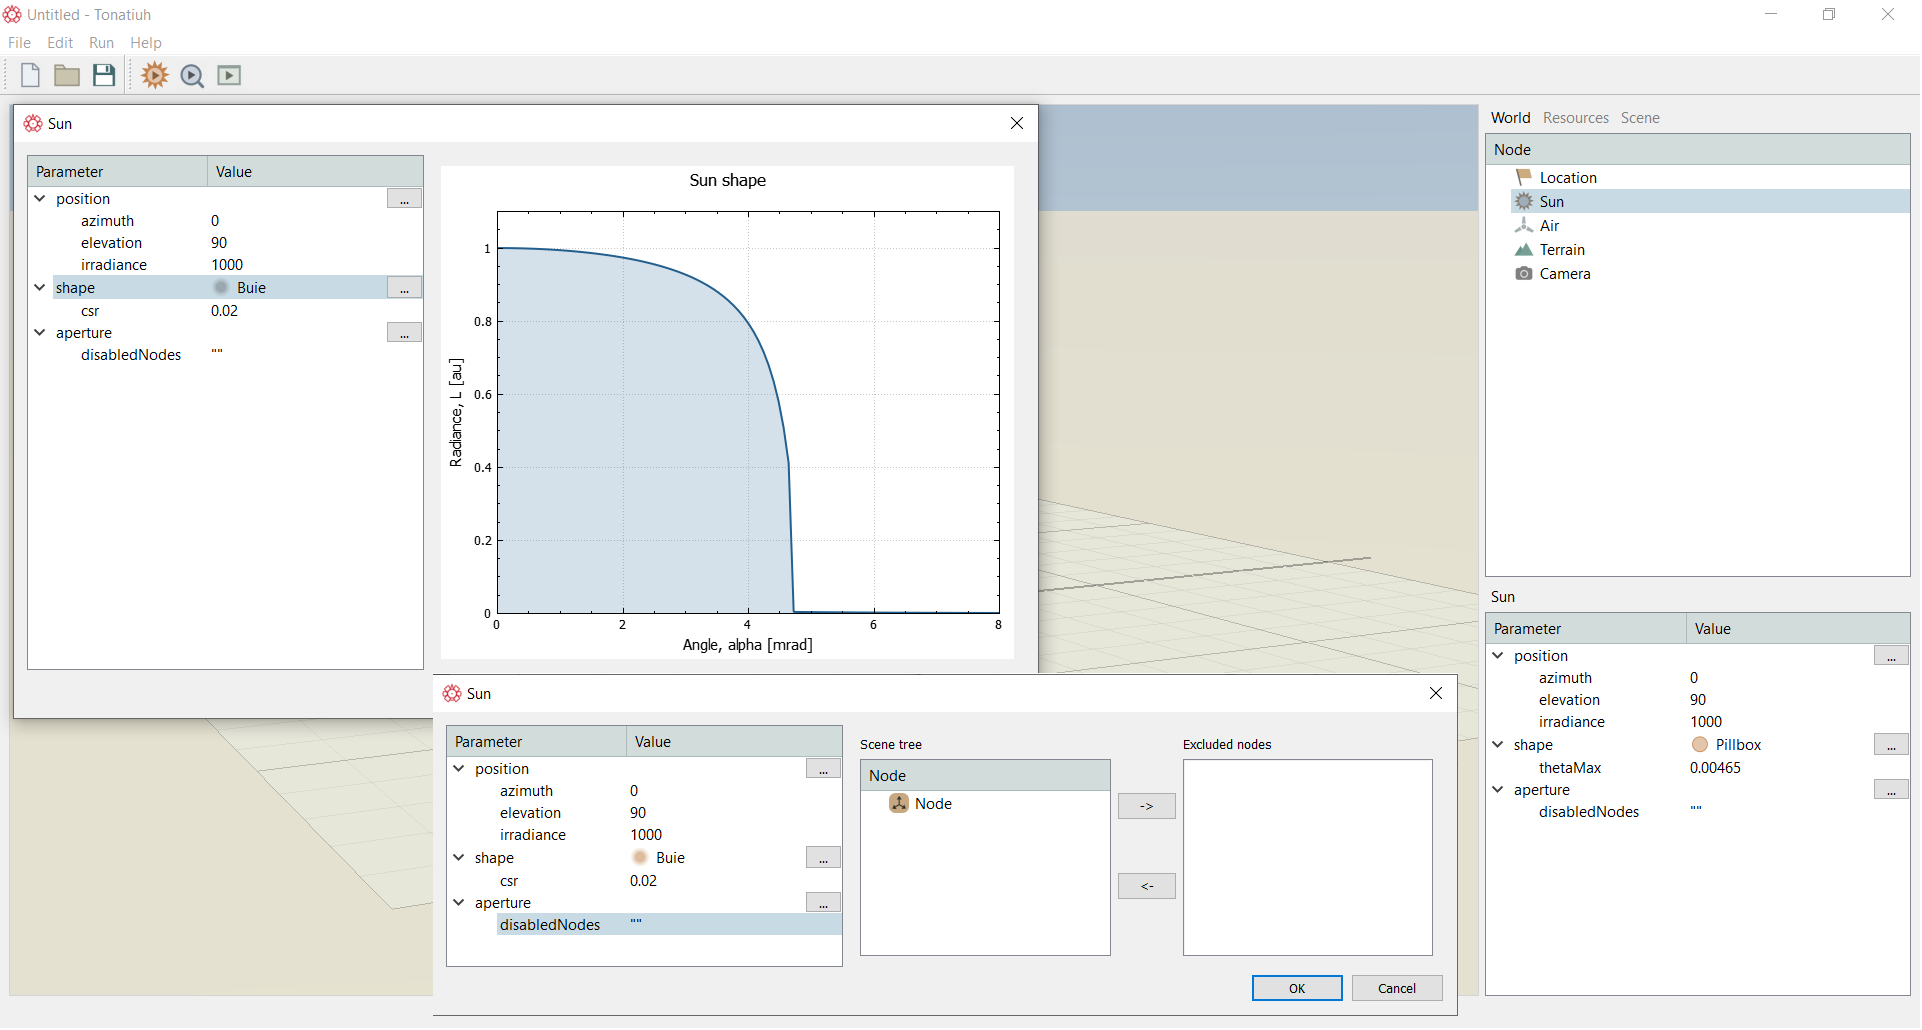
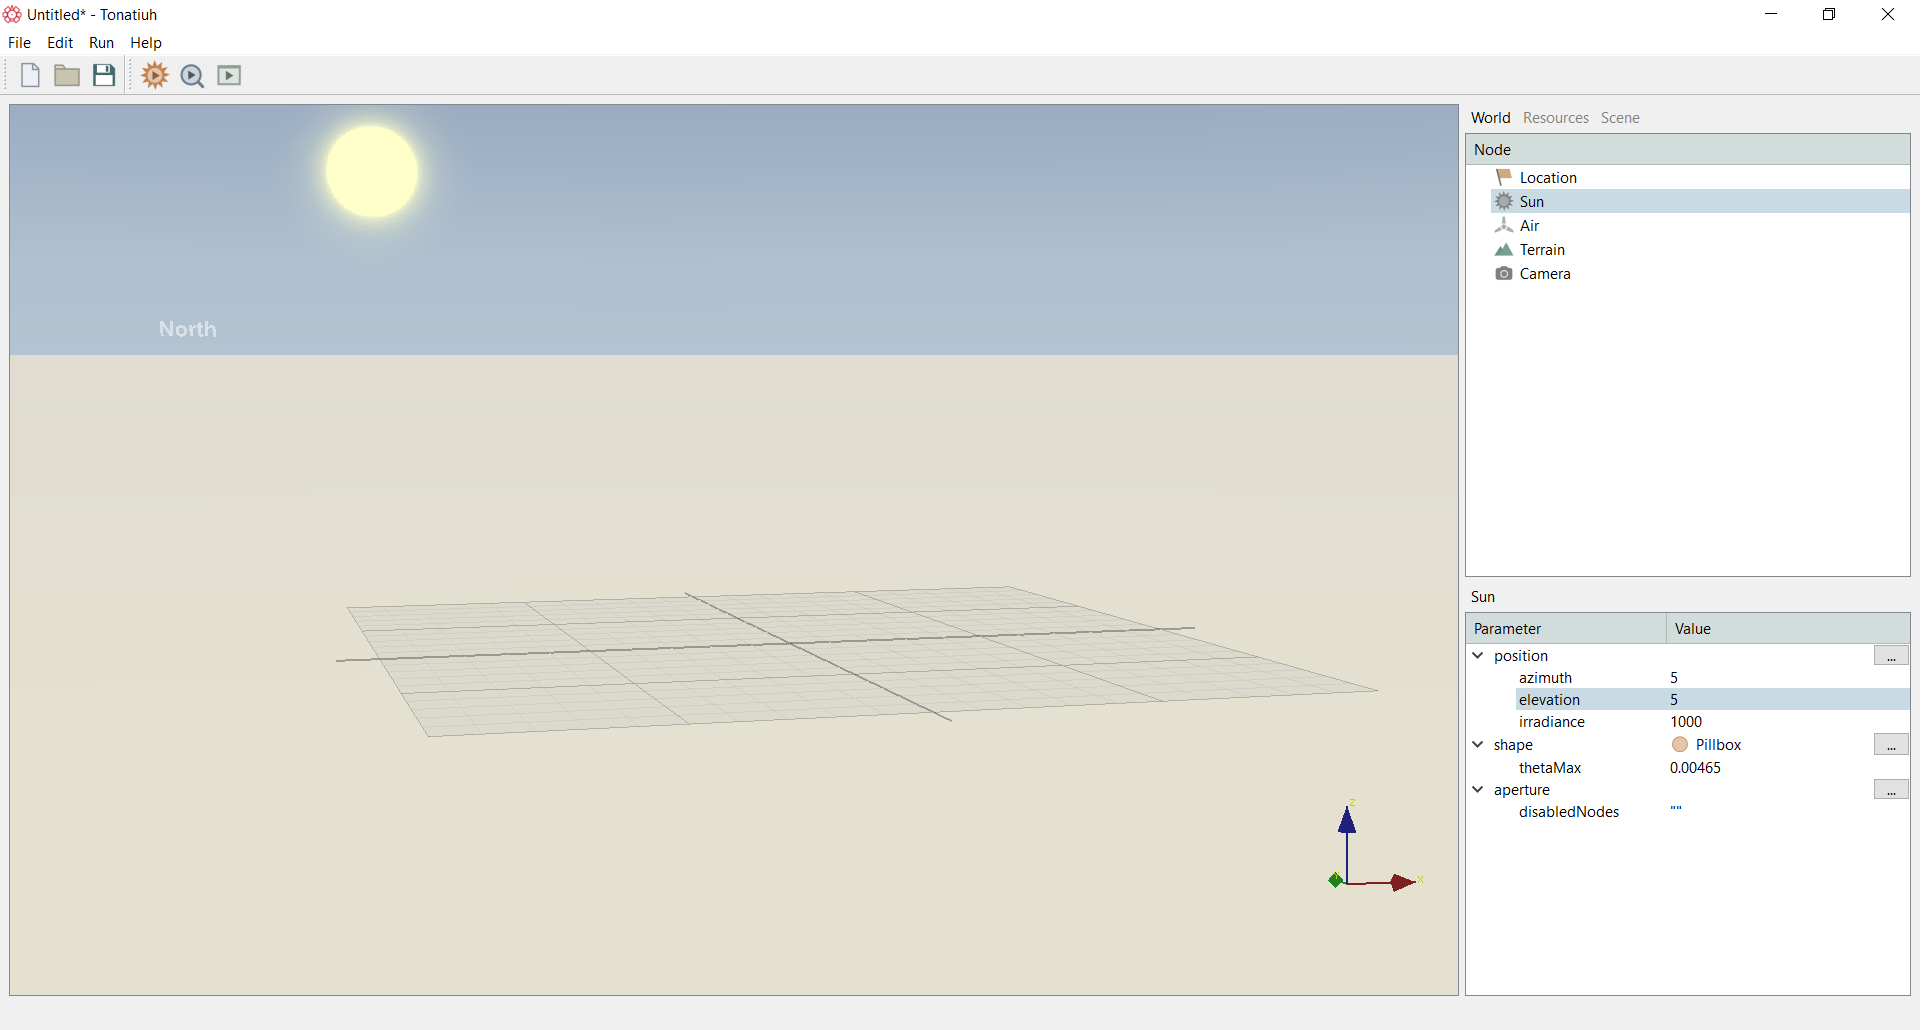
The Sun node enables the user to fill in the parameters related to the sun position and characteristics as shown in Figure below. This can be done either directly in the bottom vertical panel or by double-clicking on the Sun node. This will open a new pop-up window that can be used for selecting the sun position parameters. For disabling components from being ray-traced, the user can double-click the disabledNodes parameter and this will bring up another pop-up window where the user can exclude components from the simulation as shown below.
In Tonatiuh++ an actual sun can be seen in the graphics window as shown in Figure below. The position of the sun actually moves according to the settings of the azimuth and elevation in the Sun panel.
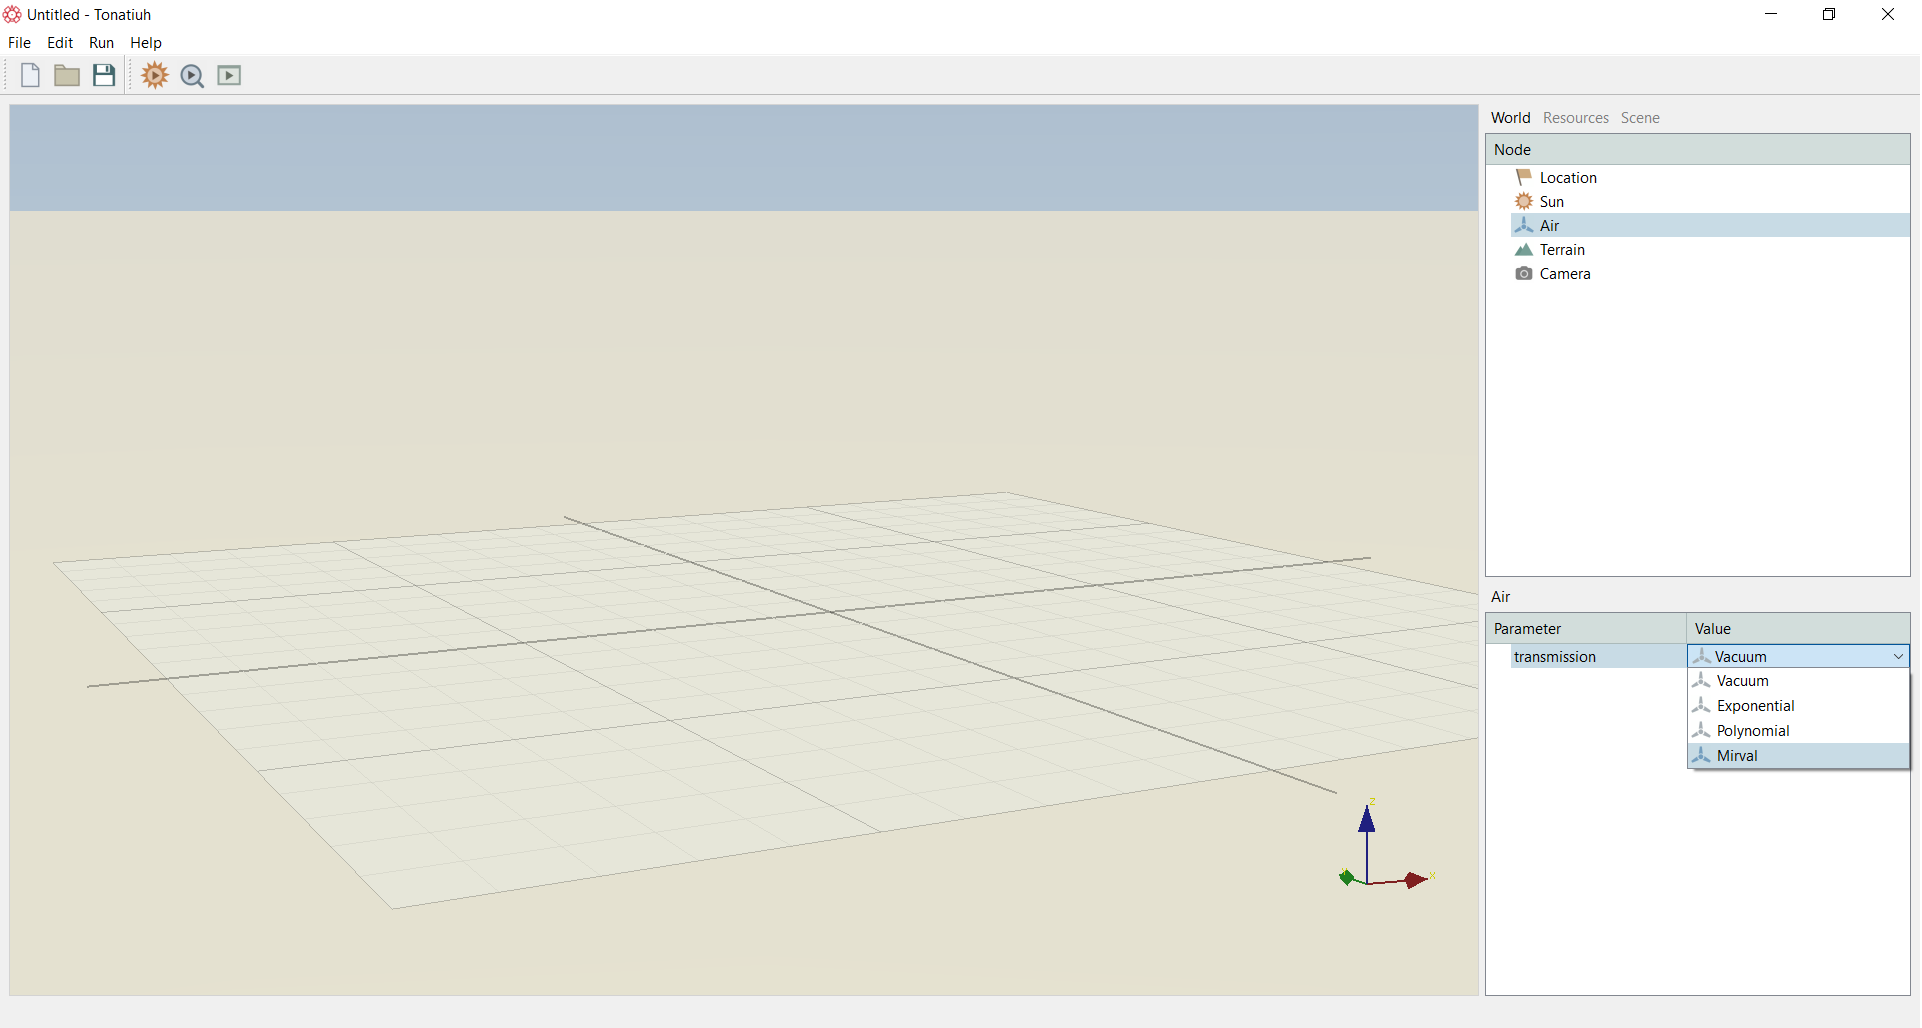
Within the Air node, the user can select the air attenuation model that will be used in the ray tracing simulations as shown in Figure below.
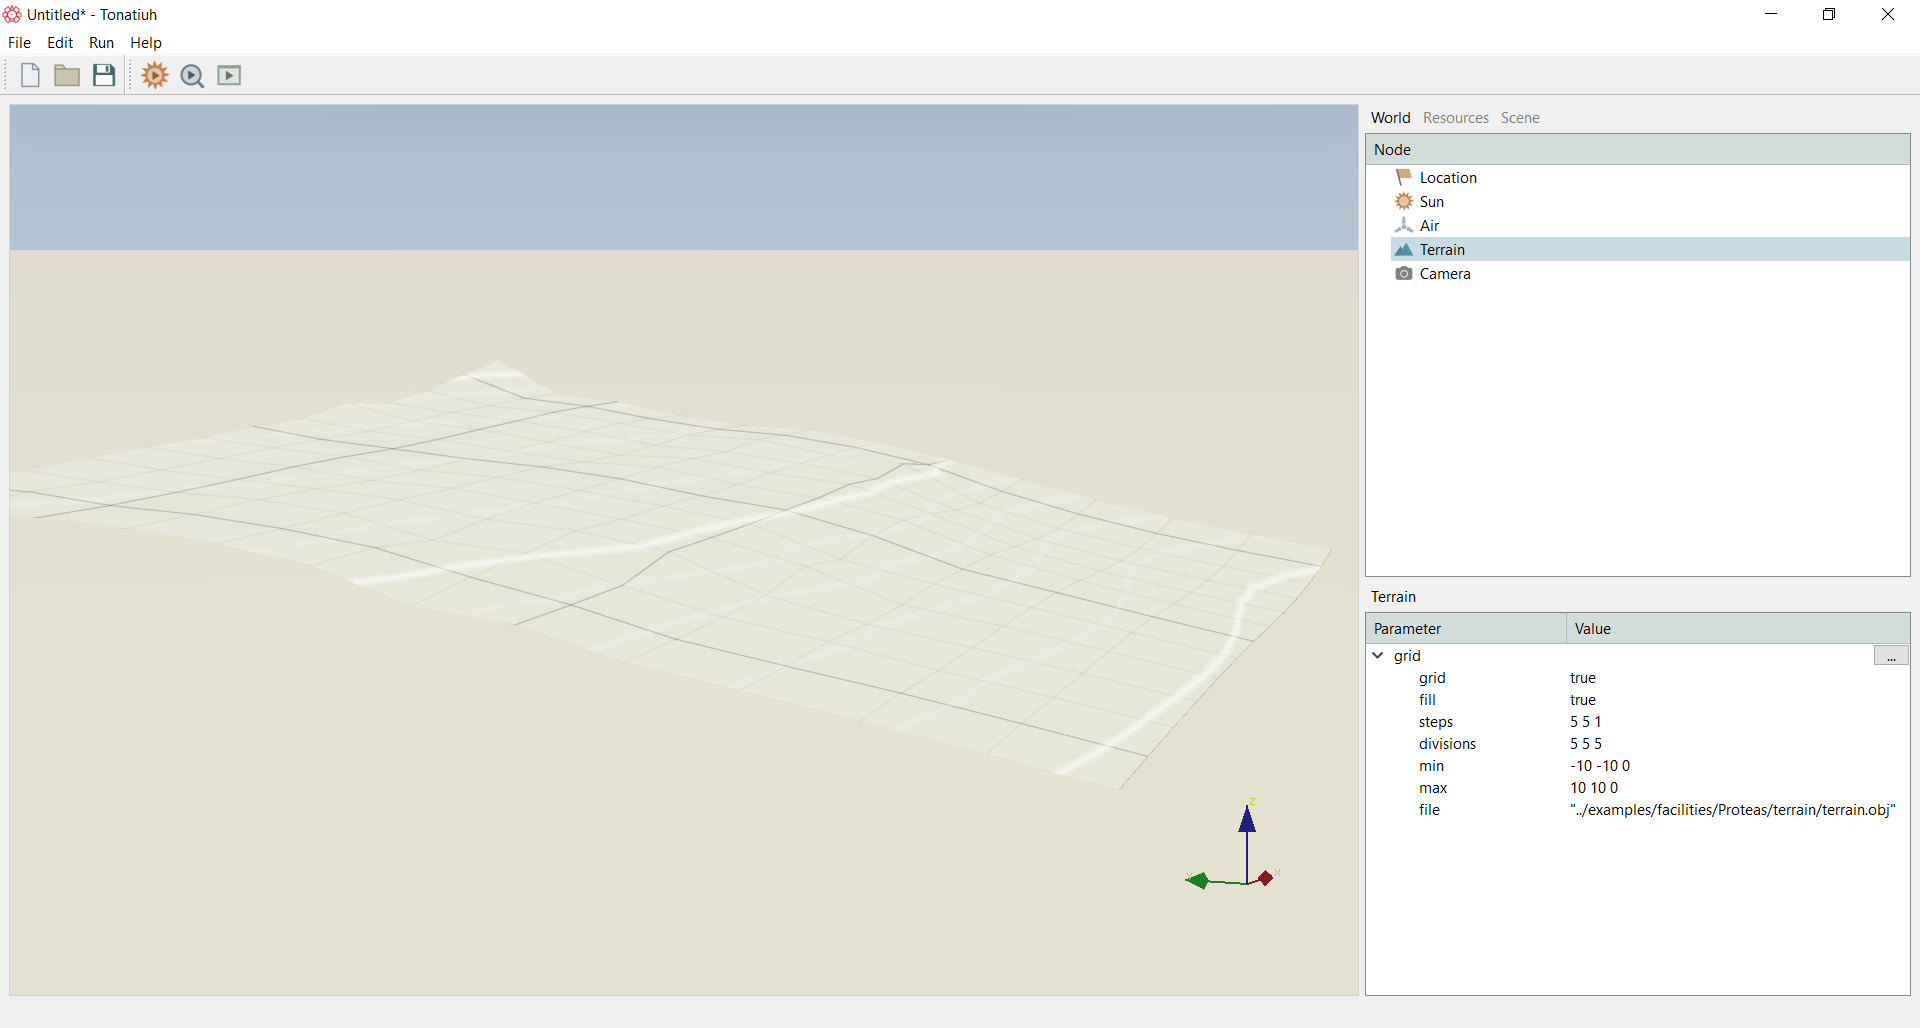
The Terrain node is used for setting up the land glyph related to the simulation. The default terrain is a rectangular flat grid. The user can define a user defined terrain by importing a desired terrain that is described as a .obj file. The example shown in Figure below shows an imported .obj terrain of a hilly area.
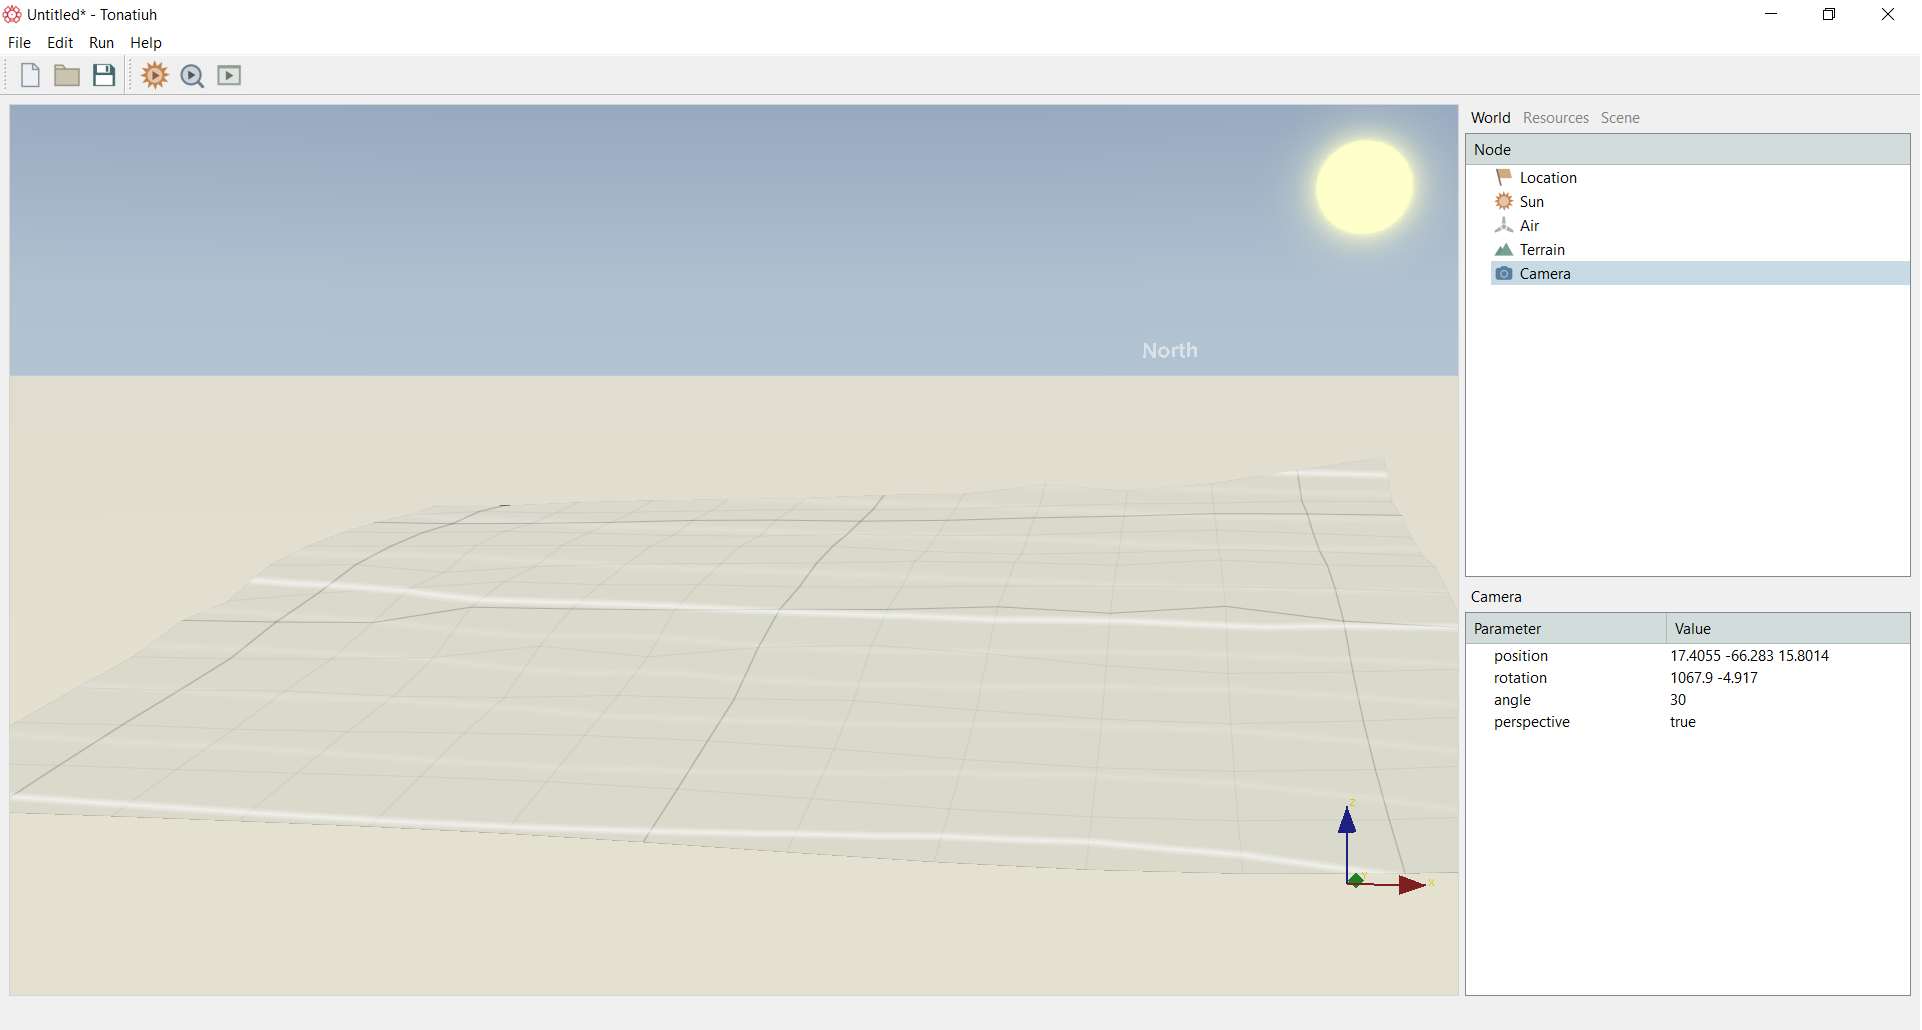
Finally, the Camera node indicates the scene viewing characteristics as shown in Figure below.
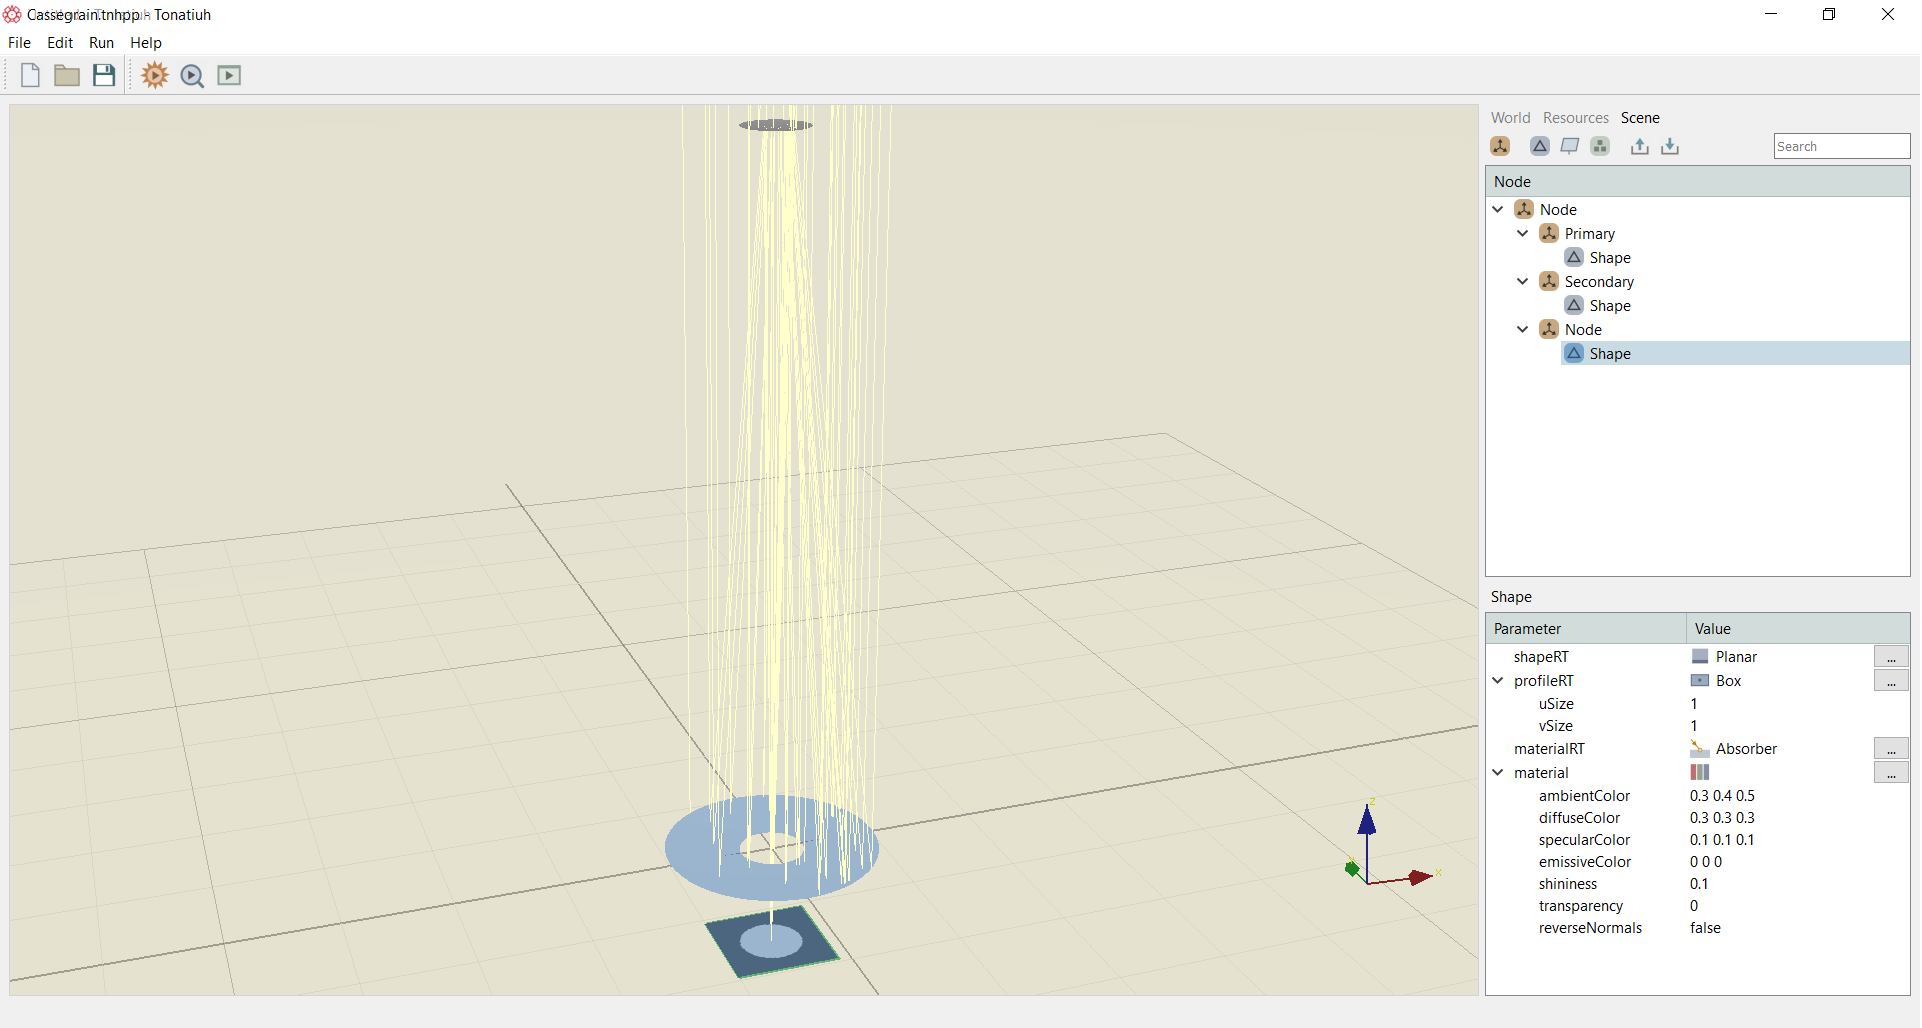
Within the Scene tab at the top of the right vertical panel the user can develop the scene for the ray tracing simulations. This is the place where the user can add all the components of the simulation, select the materials, geometrical shapes, define the optical characteristics etc. as shown in Figure below. The figure shows a simple example of a Cassegrain reflector set-up and simulation.
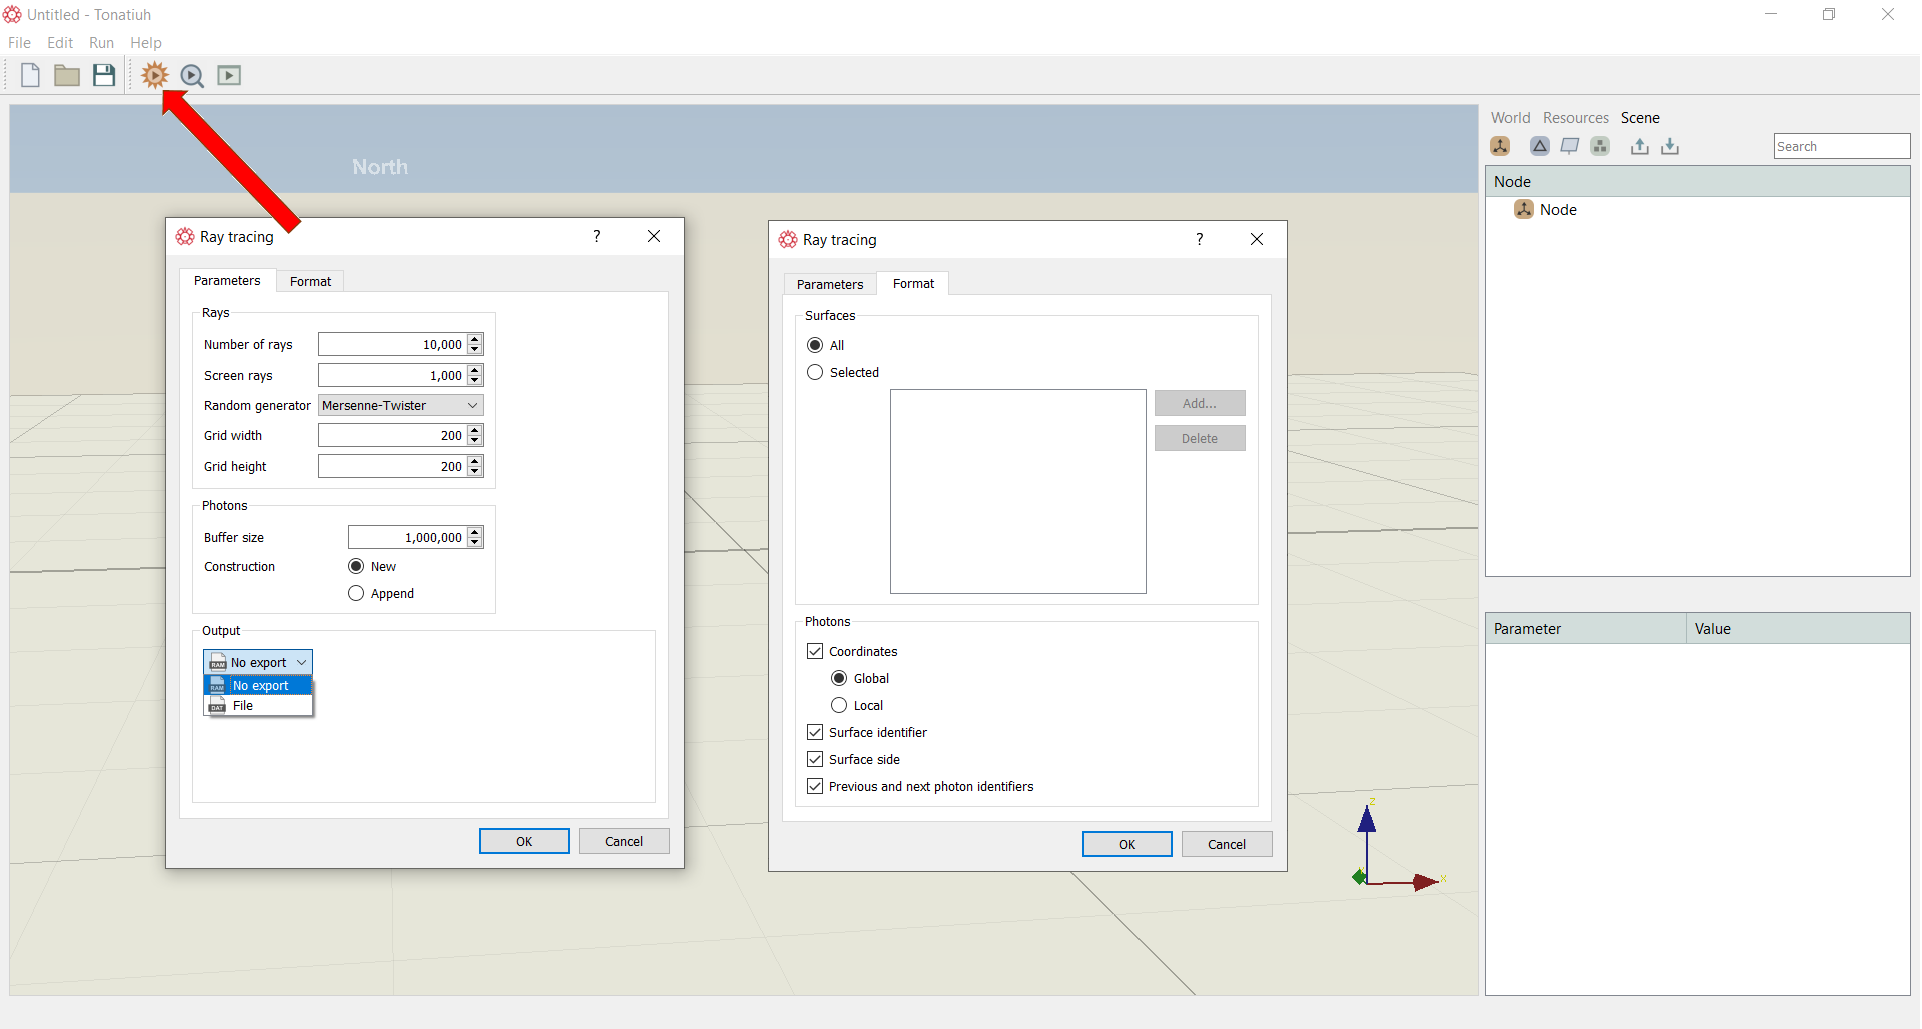
On the top left corner of the screen, three significant buttons can be found, the Run simulation button, the Flux Analysis button and the Scripting button. Figure below shows the dialog-box that comes-up when pressing the run button. The ray-tracing characteristics as well as file exporting characteristics can be set-up here as shown below.
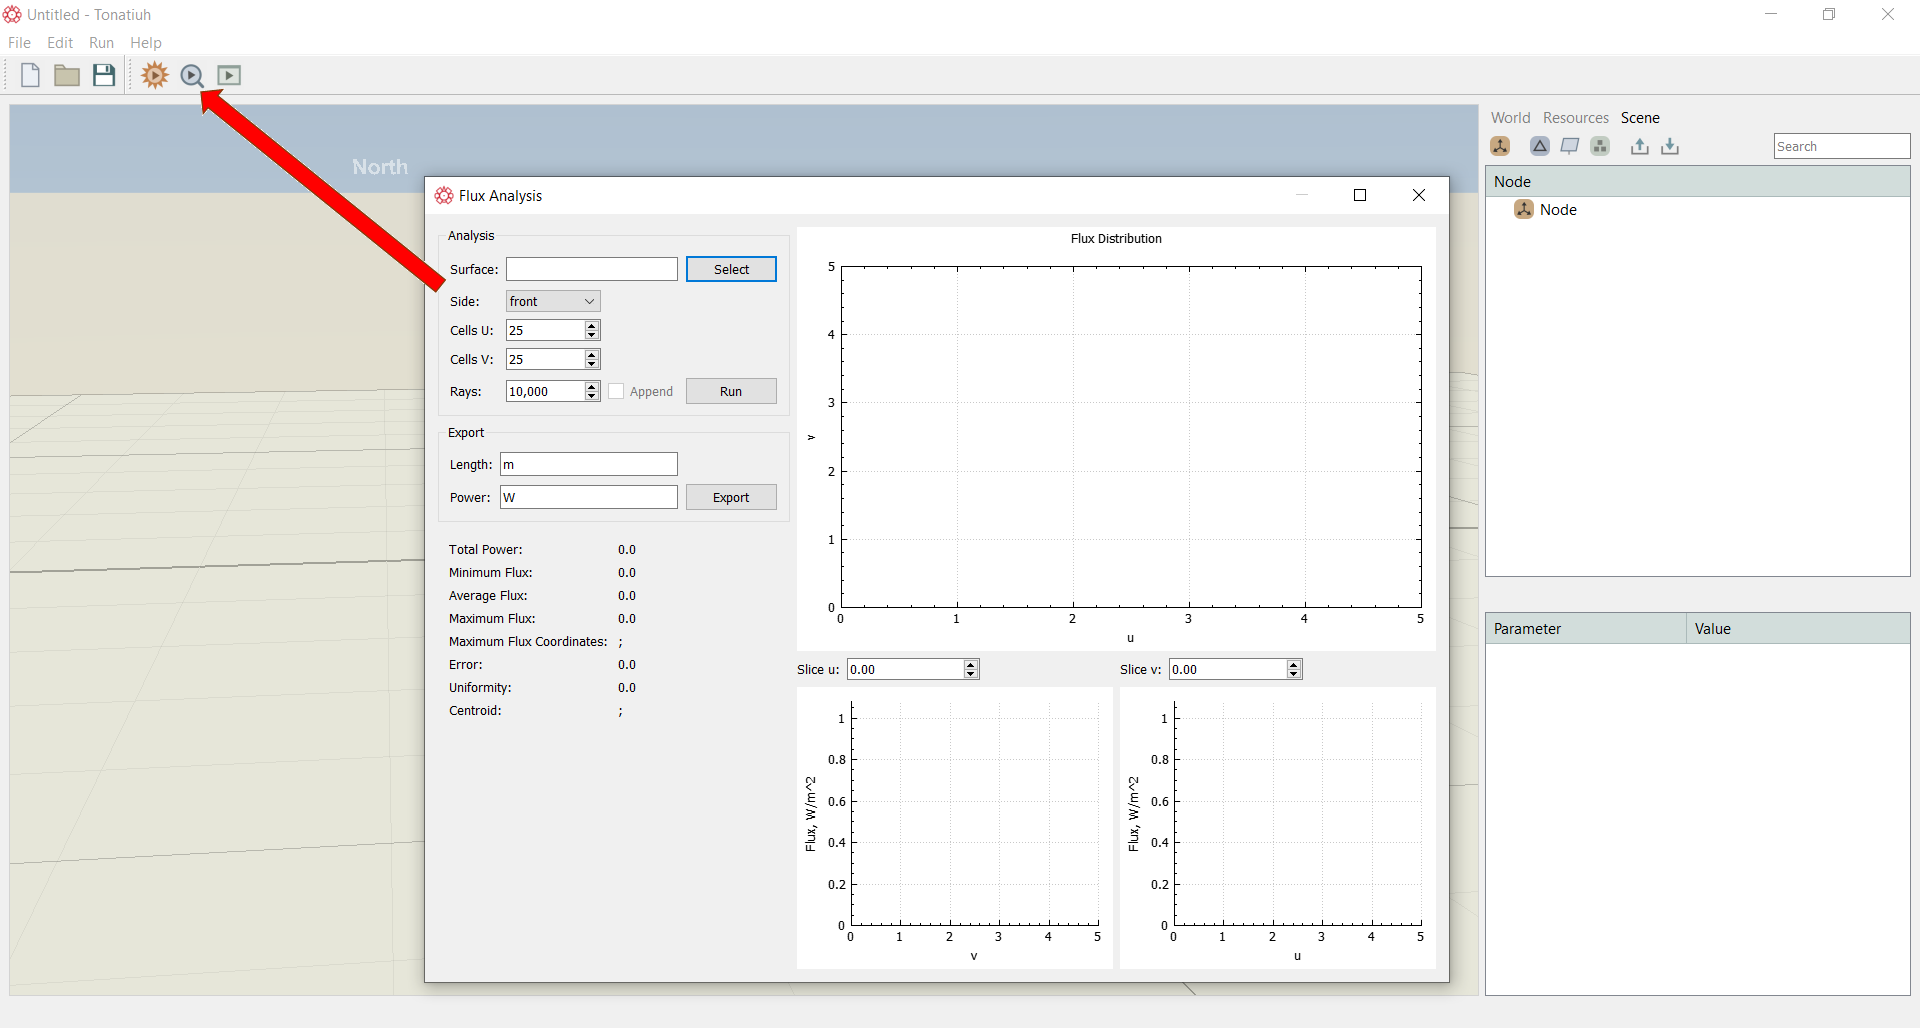
The Flux Analysis button will also bring-up a new window where the user can perform flux analysis on surfaces as shown in Figure below.
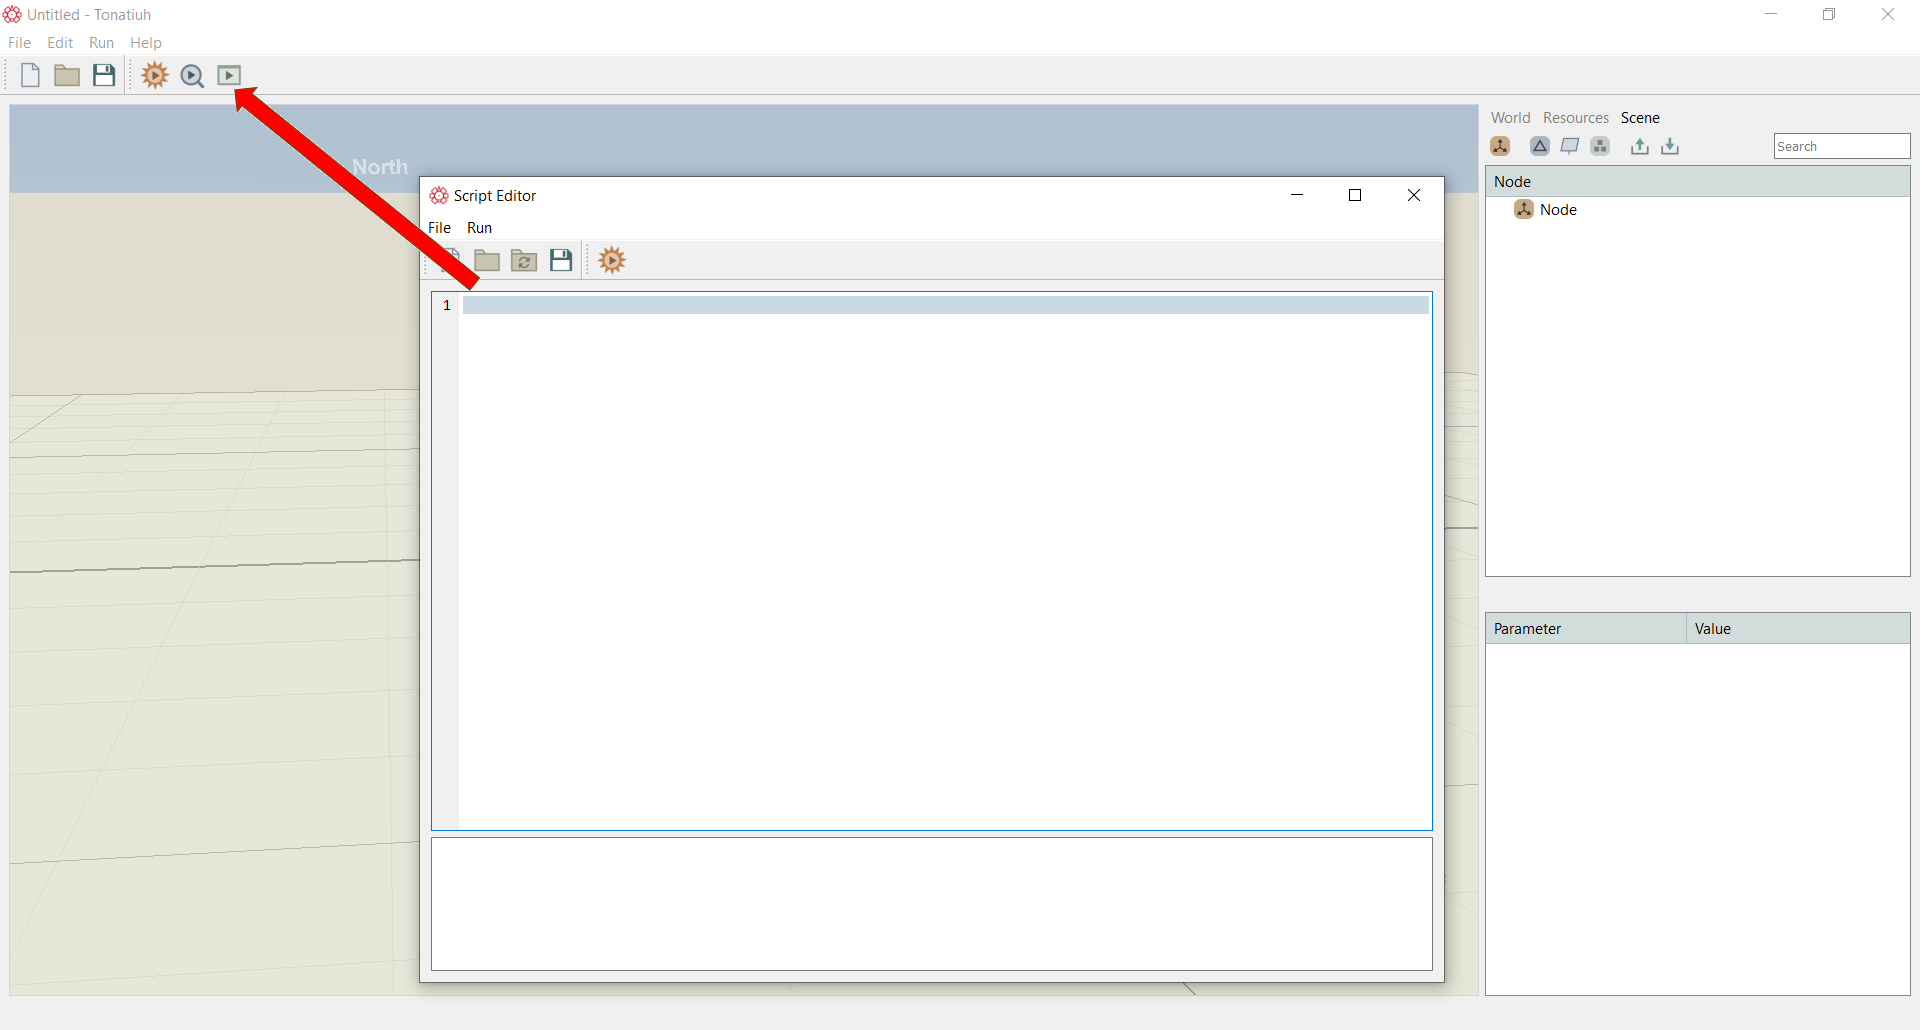
The Scripting button brings-up a window where the user can write a script to automatically design fields, perform simulations, alter and change parameters of the simulations interactively etc.