Dashboard
The Dashboard gives you an at-a-glance summary of your dictation activity. It combines the upstream usage tiles with Linux-specific additions that surface how reliably your text is landing and how your individual dictations break down.
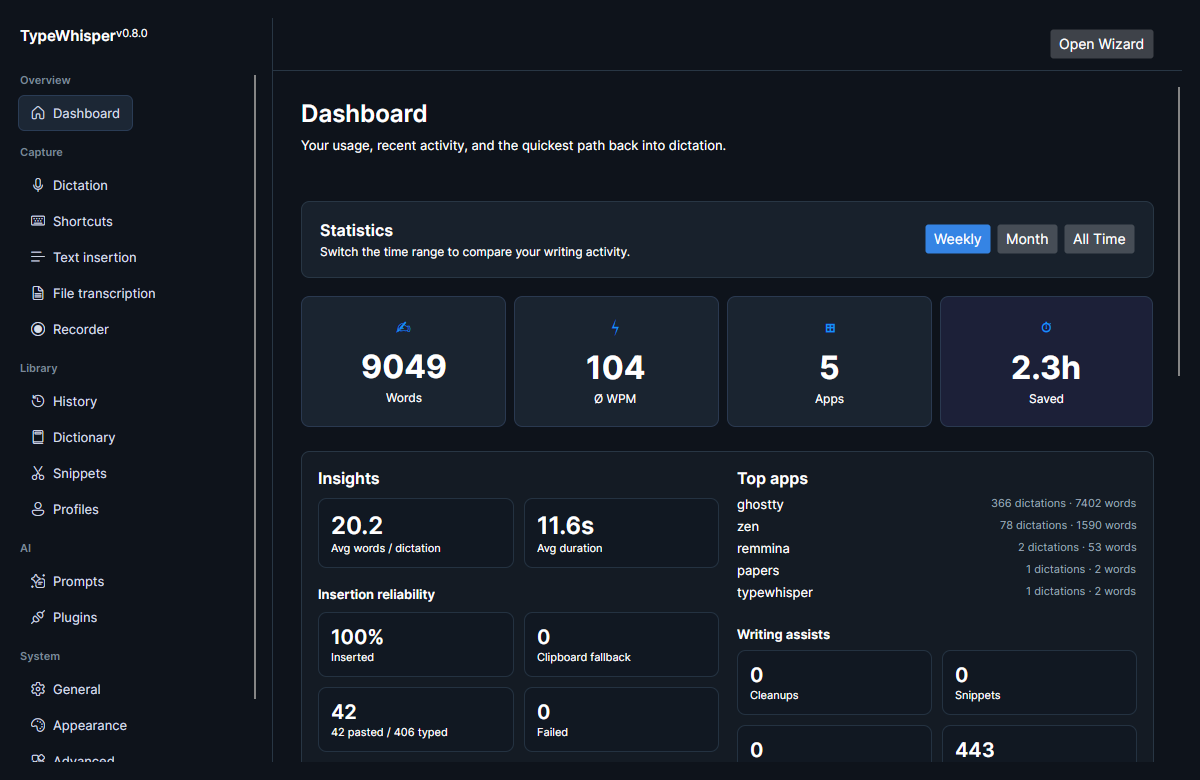
A Weekly / Month / All Time selector at the top scopes every tile on the page. Weekly counts the last 7 days, Month the last 30, and All Time the full history. Your choice is remembered between sessions.
A row of four headline tiles sits below the selector:
| Tile | What it means |
|---|---|
| Words | Raw total word count across the selected period. |
| Ø WPM | Your dictation throughput — words produced per minute of speaking, over the period. |
| Apps | The number of distinct applications you dictated into. |
| Saved | Estimated time saved versus typing the same text by hand. |
Time saved is the estimated manual-typing time at 40 WPM minus the time you actually spent speaking, floored at 0.
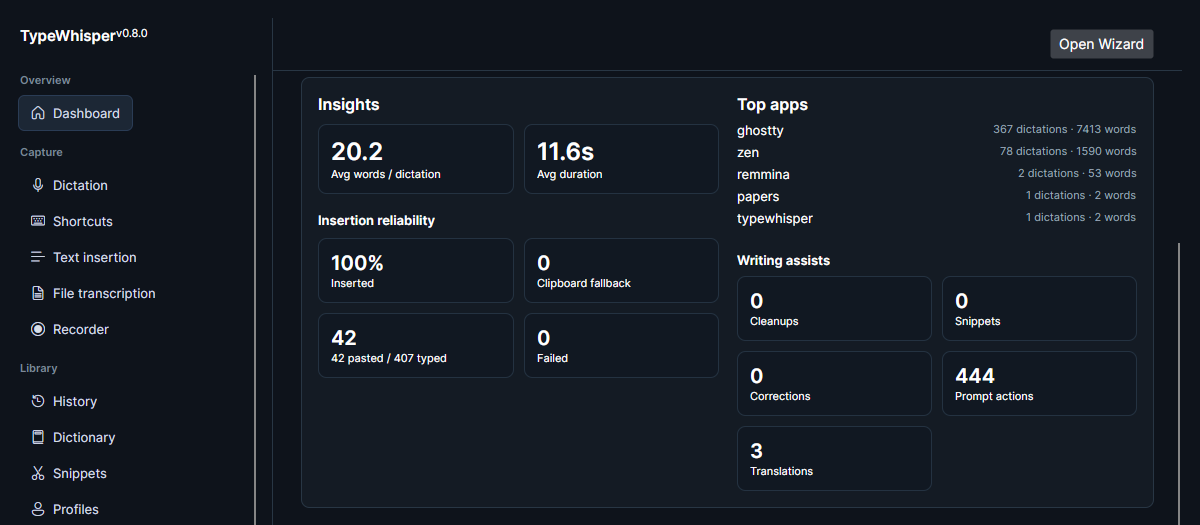
Below the headline tiles, the Insights panel breaks each dictation down further:
- Avg words / dictation — the mean word count per dictation.
- Avg duration — the mean length of a single dictation.
Because Linux insertion depends on the active session and tooling (see Text insertion and Wayland notes), this group helps you spot when text is failing to land. The headline Inserted percentage is the success rate:
(pasted + typed) ÷ (pasted + typed + clipboard-fallback + failed) × 100
Four sub-metrics sit alongside it:
| Metric | What it means |
|---|---|
| Inserted | Success rate (above) as a percentage. |
| Clipboard fallback | Count of times text was left on the clipboard instead of inserted. |
| Pasted / typed | Breakdown of successful insertions by strategy. |
| Failed | Count of insertions that failed outright. |
A set of counters tallies how often each post-processing feature ran in the period:
| Counter | Counts |
|---|---|
| Cleanups | Transcripts that had a cleanup pass applied. |
| Snippets | Transcripts where a snippet expanded. |
| Corrections | Transcripts where a dictionary correction applied. |
| Prompt actions | Transcripts where a prompt action ran. |
| Translations | Transcripts that were translated. |
The applications you dictate into most often, each with its dictation and word counts. Pairs well with Profiles and per-app Text insertion strategies.
A list of your most recent transcriptions in the period, each showing a preview, the time, and the target app.
A card at the bottom re-runs the Setup Wizard to reconfigure your model, microphone, and hotkeys.
- Dictation — the workflow that feeds these metrics.
- Text insertion — affects the insertion-reliability metric.
- History — the underlying record of your transcriptions.
- Profiles — per-app and per-URL behavior reflected in top apps.
| Date | Change |
|---|---|
| 2026-06-17 | Initial version. |
| 2026-06-17 | Added Dashboard screenshots. |
| 2026-06-17 | Removed the Origin column from the tiles table. |
| 2026-06-17 | Corrected the insertion-reliability definition to the success-rate formula; documented the time-range selector, the Words headline tile, the four insertion sub-metrics, the writing-assist counters, the Activity list, the Open-Wizard card, and the 40-WPM time-saved calculation. |