Repository navigation
visualize_skeletons
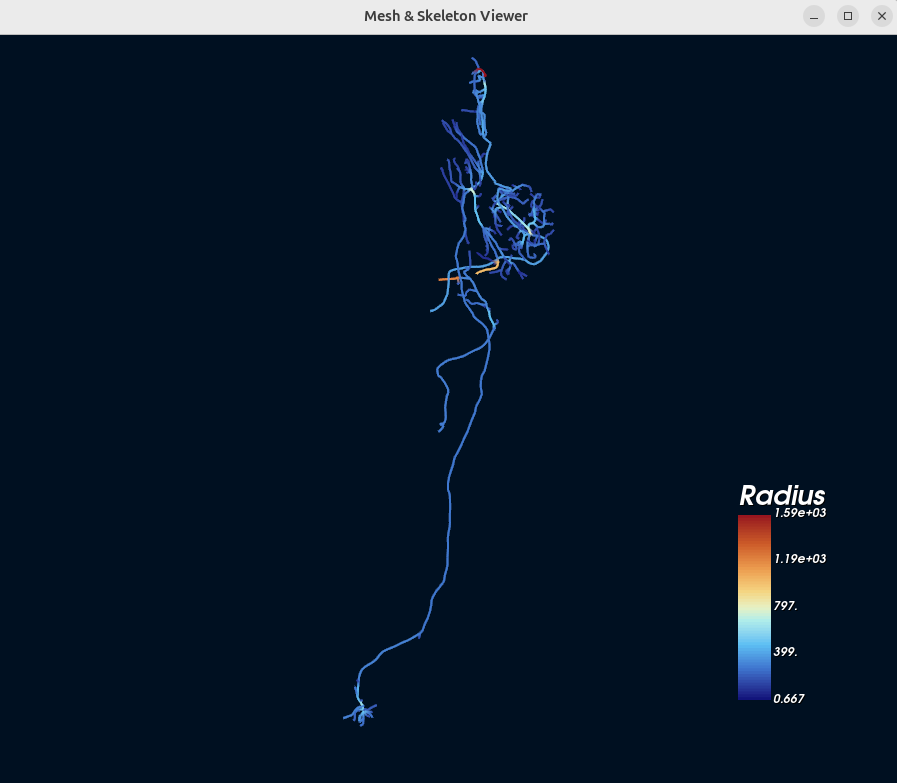
This function generates a visual representation of the skeletons for a list of neurons using the microviewer Python package. Thicker parts of neuronal processes are represented by red/orange coloration, thinner by blue. Since skeletons are always stored as line segments, somas will generally show up as stubby, bright red branches (though this is also true of mergers and other "blobby" structures).
Arguments:
-
datastack(string, mandatory)- the name of the datastack the segment IDs come from
-
seg_ids(list of integers, mandatory)- a list of segment IDs to visualize the skeletons for
Returns:
- opens microviewer window with skeleton renderings
Note
The viewer may occasionally refuse to close when clicking on the X button or using force-quit hotkeys, requiring the script that initiated it to be interrupted/killed manually. It's unclear at present (2026/10/07) what causes this issue, and is low-priority for debugging as it appears to be harmless, if a bit inconvenient.
INPUT:
import tracertools as tt

tt.visualize_skeletons(
    datastack="brain_and_nerve_cord",
    seg_ids=[
        720575941441350235,
        720575941519923628,
        720575941703820762,
    ],
)
OUTPUT: