28017247
Created by Josianne Lachapelle on Sep 05, 2018
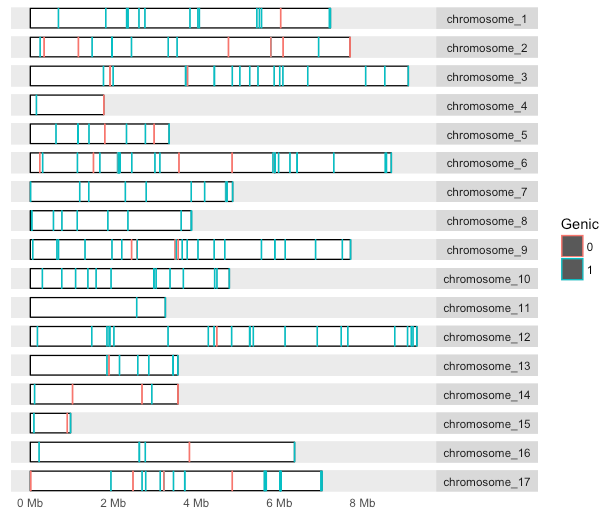
The following code allows you to plot events according to their position on each chromosome. For example, you might want to plot the position of *de novo *mutations, or the position of TEs across the genome.
- You will need the following R packages:
library(GenomicRanges)
library(ggbio)
library(ggplot2)
2. Create a data frame containing a column for each chromosome name, and a column for the size of each chromosome.
chr.data<-data.frame(chromosome = c(paste0('chromosome_',1:17), paste0('scaffold_',18:54), c('cpDNA','mtDNA', 'mtMinus')),
                     size = c(8033585, 9223677, 9219486, 4091191, 3500558, 9023763, 6421821, 5033832, 7956127,
                              6576019, 3826814, 9730733, 5206065, 4157777, 1922860, 7783580, 7188315, 271631,
                              219038, 200793, 189560, 163774, 127913, 127161, 102191, 80213, 55320, 55278,
                              52813, 52376, 48183, 42264, 39192, 33576, 32450, 25399, 24537, 24437, 22408,
                              22082, 21325, 21000, 20974, 17736, 16939, 16627, 14746, 14165, 13462, 12727,
                              11225, 6241, 2479, 2277, 203828, 15758, 345555))
or in this case I only want to plot the chromosomes, not the scaffolds or the plastids and so I use the following code:
chr.data<-data.frame(chromosome = c(paste0('chromosome_',1:17)),
                     size = c(8033585, 9223677, 9219486, 4091191, 3500558, 9023763, 6421821, 5033832, 7956127,
                              6576019, 3826814, 9730733, 5206065, 4157777, 1922860, 7783580, 7188315))
3. Import your data. Make sure your data is in the long format (as shown below). At minimum, your data needs two columns: 'chromosome', and 'position'. Make sure the levels of your 'chromosome' factor are the same as in the chr.data.
all.mutations<-read.csv("my.mutation.data.csv", header=TRUE)

all.mutations$chromosome<-factor(all.mutations$chromosome, levels=chr.data$chromosome)

View(all.mutations)
|
|
Gene.primaryIdentifier | chromsome | position | mutation | type | mutant_sample | genic | exonic | intronic | intergenic | utr5 | utr3 | fold0 | fold4 | fold2 | fold3 | CDS | mRNA | rRNA | tRNA | FPKM | Nonsyn_V_Syn | X | nessID | FPKM_per_transcript | cluster |
|---|---|---|---|---|---|---|---|---|---|---|---|---|---|---|---|---|---|---|---|---|---|---|---|---|---|---|
1 |
g88 |
chromosome_1 |
678032 |
T>A |
SNP |
./S26/ |
1 |
1 |
0 |
0 |
1 |
0 |
0 |
0 |
0 |
0 |
0 |
1 |
0 |
0 |
0.457298757 |
n/a |
265 |
26904017 |
4.572988e-01 |
non-cluster |
2 |
Cre01.g009750 |
chromosome_1 |
1815972 |
A>G |
SNP |
./S30/ |
1 |
1 |
0 |
0 |
0 |
1 |
0 |
0 |
0 |
0 |
0 |
1 |
0 |
0 |
0.318886874 |
n/a |
247 |
26903734 |
3.188869e-01 |
non-cluster |
3 |
Cre01.g012700 |
chromosome_1 |
2318299 |
G>A |
SNP |
./S31/ |
1 |
0 |
1 |
0 |
0 |
0 |
0 |
0 |
0 |
0 |
0 |
1 |
0 |
0 |
. |
n/a |
261 |
26903906 |
2.224498e+01 |
non-cluster |
4 |
Cre01.g012700 |
chromosome_1 |
2326644 |
G>A |
SNP |
./S21/ |
1 |
1 |
0 |
0 |
0 |
1 |
0 |
0 |
0 |
0 |
0 |
1 |
0 |
0 |
22.24497799 |
n/a |
261 |
26903906 |
2.224498e+01 |
non-cluster |
5 |
Cre01.g012900 |
chromosome_1 |
2355468 |
T>A |
SNP |
./S26/ |
1 |
1 |
0 |
0 |
0 |
0 |
1 |
0 |
0 |
0 |
1 |
1 |
0 |
0 |
0.876146117 |
nonsynonymous |
257 |
26903837 |
8.761461e-01 |
non-cluster |
6 |
Cre01.g015200 |
chromosome_1 |
2615733 |
A>AC |
indel |
./S21/ |
1 |
0 |
1 |
0 |
0 |
0 |
0 |
0 |
0 |
0 |
0 |
1 |
0 |
0 |
. |
n/a |
266 |
26904033 |
2.583813e+00 |
non-cluster |
4. Make the plot. Here I'm going to colour the mutations according to whether the mutations are in genic regions or intergenic regions. You can choose whichever factor interests you to distinguish different types of events. You can also leave out the colours all together by removing the last argument of the GRanges object.
all.muts.ranges<-GRanges(seqnames=all.mutations$chromosome,
                         IRanges(start=all.mutations$position,
                         width = rep(1,length(all.mutations$position))),
                         Genic=factor(all.mutations$genic))

seqlengths(all.muts.ranges)<-chr.data$size

pdf('my.mutations.karyogram.pdf')
autoplot(all.muts.ranges, layout="karyogram", aes(colour = Genic))
dev.off()
Plotting events longer than one base
If you want to plot blocks (such as haplotype blocks, or TEs, or indels) that are longer than one base, you can change the width argument of your GRanges object. In this particular example, I used the number 100,000 in my width argument because each block is 100,000 bases long. The haplotype blocks are composed of one or more blocks of 100,000 bases, and their start and end positions is specified by the columns 'Start.location' and 'End.location'.
haplotype_ranges<-GRanges(seqnames=blocks.data$Chromosome,
                          IRanges(start=blocks.data$Start.location,
                          width=rep(100000, length(blocks.data$End.location))),
                          haplotype=blocks.data$Haplotype)
Layering plots
You can layer different karyograms. For example, you might want to layer the haplotype blocks onto the single nucleotide mutations. To do so, you create separate GRanges objects for each layer. And then you add them up at the time of producing the plot.
haplotype_ranges<-GRanges(seqnames=blocks.data$Chromosome,
                          IRanges(start=blocks.data$Start.location,
                                  width=rep(100000, length(blocks.data$End.location))),
                          haplotype=blocks.data$Haplotype)

mut_ranges<-GRanges(seqnames=muts$chromosome,
                    IRanges(start=muts$position,
                            width = rep(1,length(muts$position))))

pdf('my.layered.karyogram.pdf')
autoplot(seqnames(haplotype_ranges), layout="karyogram") +
 layout_karyogram(data=haplotype_ranges, geom="rect", ylim=c(0, 10000), aes(fill=haplotype)) +
 layout_karyogram(data = mut_ranges, geom="rect", ylim=c(0,10000))
dev.off()
 [image2018-9-5_16-2-4.png](attachments/28017247/28017245.png)
(image/png)
[image2018-9-5_16-2-4.png](attachments/28017247/28017245.png)
(image/png)
Document generated by Confluence on May 22, 2024 11:44