Repository navigation
Reading reports
On this page
- Dashboard, Holdings: Positions, Analysis: Allocation
- Look back
- Stock detail
- Trades
- Statistics by year
- Returns
- Technical analysis
- Dividend records
- Exchange rates
- Calculator
- Funds
- Bonds
- Warrants
- Investment scope (only what you use)
- Currency exchange calculator
- Backtest
- Tax summary
The row at the top holds the main areas; choose one and the actual pages appear underneath:
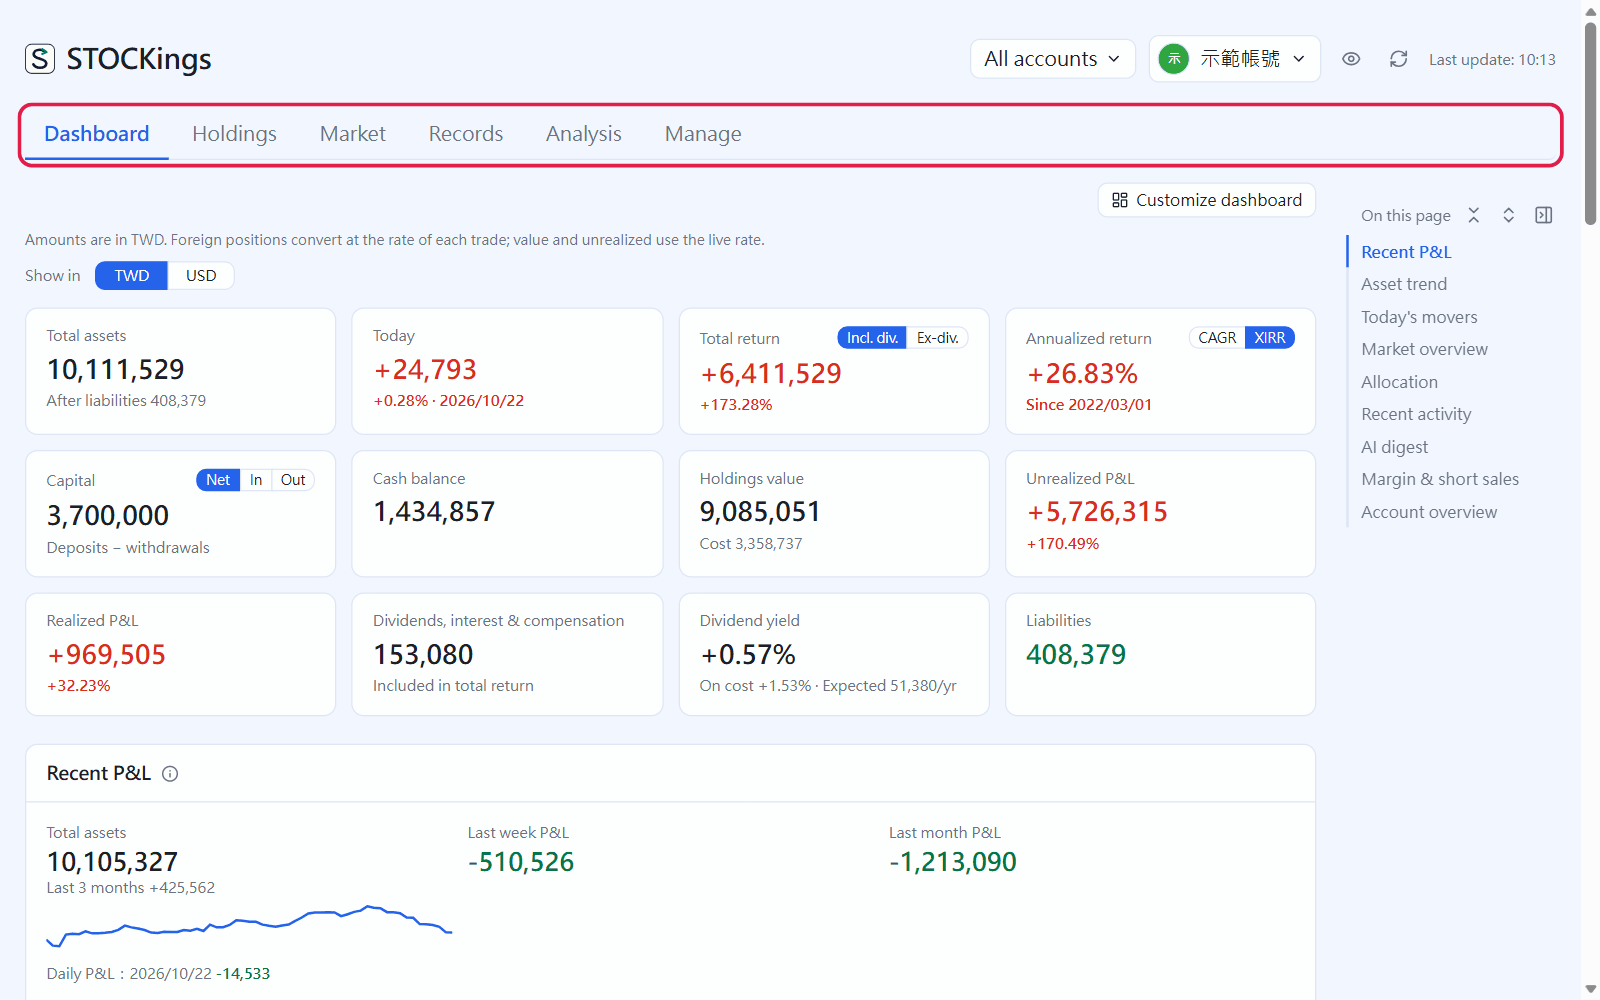
Choose a main area on the top row and that group's pages are underneath; on a wide screen the "On this page" list at the right scrolls to a section when clicked (sections can be collapsed, see the end of this chapter)(click the image to enlarge)
| Area | What is under it |
|---|---|
| Dashboard | The home page you see first (a single page, no tabs underneath) |
| Holdings | Positions, Stock detail, Look back |
| Market | Market (watchlist), Technical analysis, Exchange rates, Calculator, Backtest |
| Records | Trades, Dividend records, Regular investing, Cash ledger, Lending, Pledge loans, Futures & options, IPO subscriptions, Employee grants, Investment journal |
| Analysis | Allocation, Statistics by year, Returns, Tax summary |
| Manage | Instruments, Accounts, Import / Export, Data check, Account, Settings |
To find something, first think "is this what I hold now, the market outside, records to enter, my own past analysis, or management", then pick from that group; that is much quicker than twenty-odd tabs in one row. The order inside a group can be changed in Settings (see "Settings → Tab order").
Before sharing your screen or a screenshot, click the eye at the top right to hide amounts: amounts and share counts become **** while percentages such as returns and weights still show; click again to restore, and it is remembered when you reopen.
Pages with many sections have an "On this page" list: on a page such as Settings, Account or Trades with three or more sections, a list at the right on a wide screen shows each section's title; clicking scrolls to it, and it marks the section you are looking at as you scroll; on a narrow window (or a phone) it becomes a "Jump to…" menu above the content. The left edge of the list can be dragged to change its width (double-click restores the default, and dragging it very narrow collapses it), the button beside the title can collapse it, and the button in the same place expands it again; the width and collapsed state are remembered. Pages with few sections have no list.
Every section can be collapsed (with or without the list): click a section's title and only the title row remains (with a > after it); click again to expand; each tab remembers which are collapsed (after you change the interface language they return to all expanded). In the list, collapsed sections are paler with a ▸ after them, and clicking expands the section and then scrolls to it; the two buttons above the list are "Collapse all" and "Expand all".
Tabs you do not use can be hidden (the eye beside each tab in "Settings → Tab order"). Hiding deletes no data; it just keeps the tab out of the navigation bar. When you need it, click "More" at the far right of the group row, which lists all hidden tabs, click one to go there, and the eye beside it restores it. A hidden tab you are viewing temporarily appears in the sub-tab row (with a dashed frame). When all of a group's tabs are hidden, that group's button is also hidden, and you again go in from "More".
"Holdings" has four pages: Dashboard (the home page), Positions, Stock detail and Look back. Allocation is under "Analysis" and is also covered in this section.
The Dashboard puts what you look at most on one page, section by section. "Customize dashboard" at the top right turns sections off, moves them up or down with the arrows, and "Reset to default" brings back the original layout (remembered per login). On a wide screen "Today's movers" sits beside "Market overview", and "Recent activity" beside "AI digest"; on a narrow screen each takes a full row. Sections with nothing to show (for example margin and short when you have none) are hidden.
| Section | What it shows |
|---|---|
| Summary cards | See the table below |
| Recent P&L | A 3-month sparkline of total assets, the P&L over the last week (5 trading days) and month (20 trading days), and bars for each of the last 20 days (hover for the amount). Each day's P&L = that day's total return minus the previous day's; deposits and withdrawals do not count |
| Asset trend | See below |
| Today's movers | The 5 holdings up the most and the 5 down the most today (against the previous close) with today's P&L; click a code to open the stock detail |
| Market overview | The latest close of the TAIEX and TPEx index and the number of stocks up, unchanged and down (TWSE and TPEx open data, common stocks only; the same data as "Market pulse" on the Market page) |
| Upcoming ex-dividend | See the dividends chapter; hidden when nothing is coming up |
| Holdings split | The same holdings pie as on Allocation |
| Recent activity | The latest trades and dividends in date order, with links to all trades and all dividends |
| AI digest | The latest result of each AI task (set up on the Market page); long ones can be expanded. AI-written content is for reference only and is not investment advice |
| Margin and short, Account overview | See below |
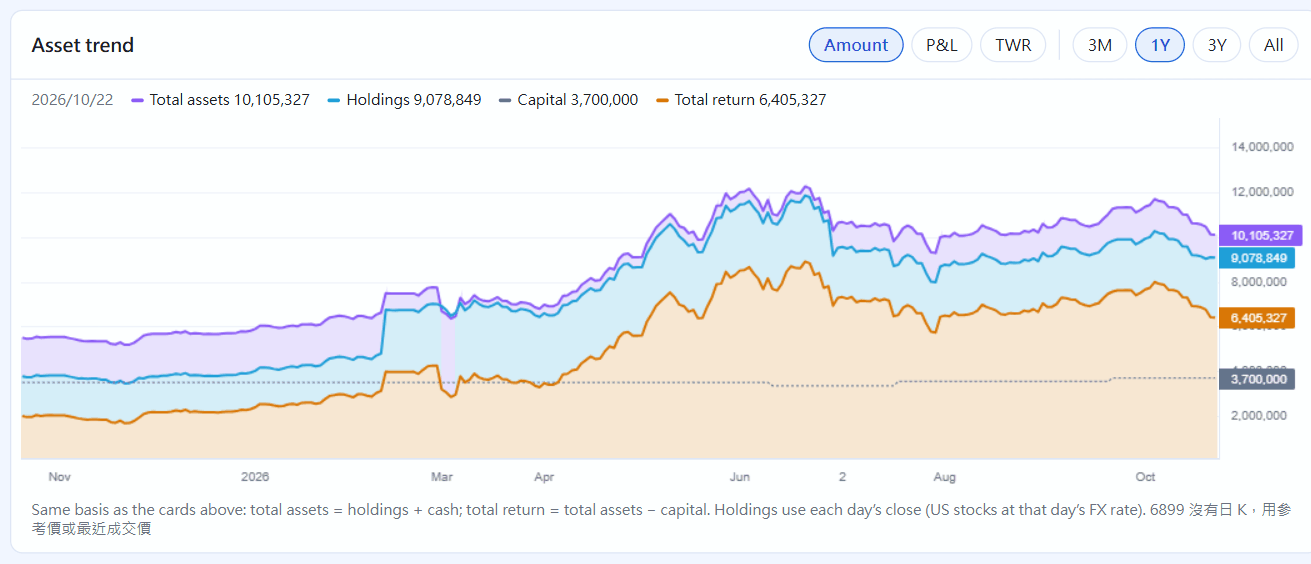
Asset trend(click the image to enlarge)
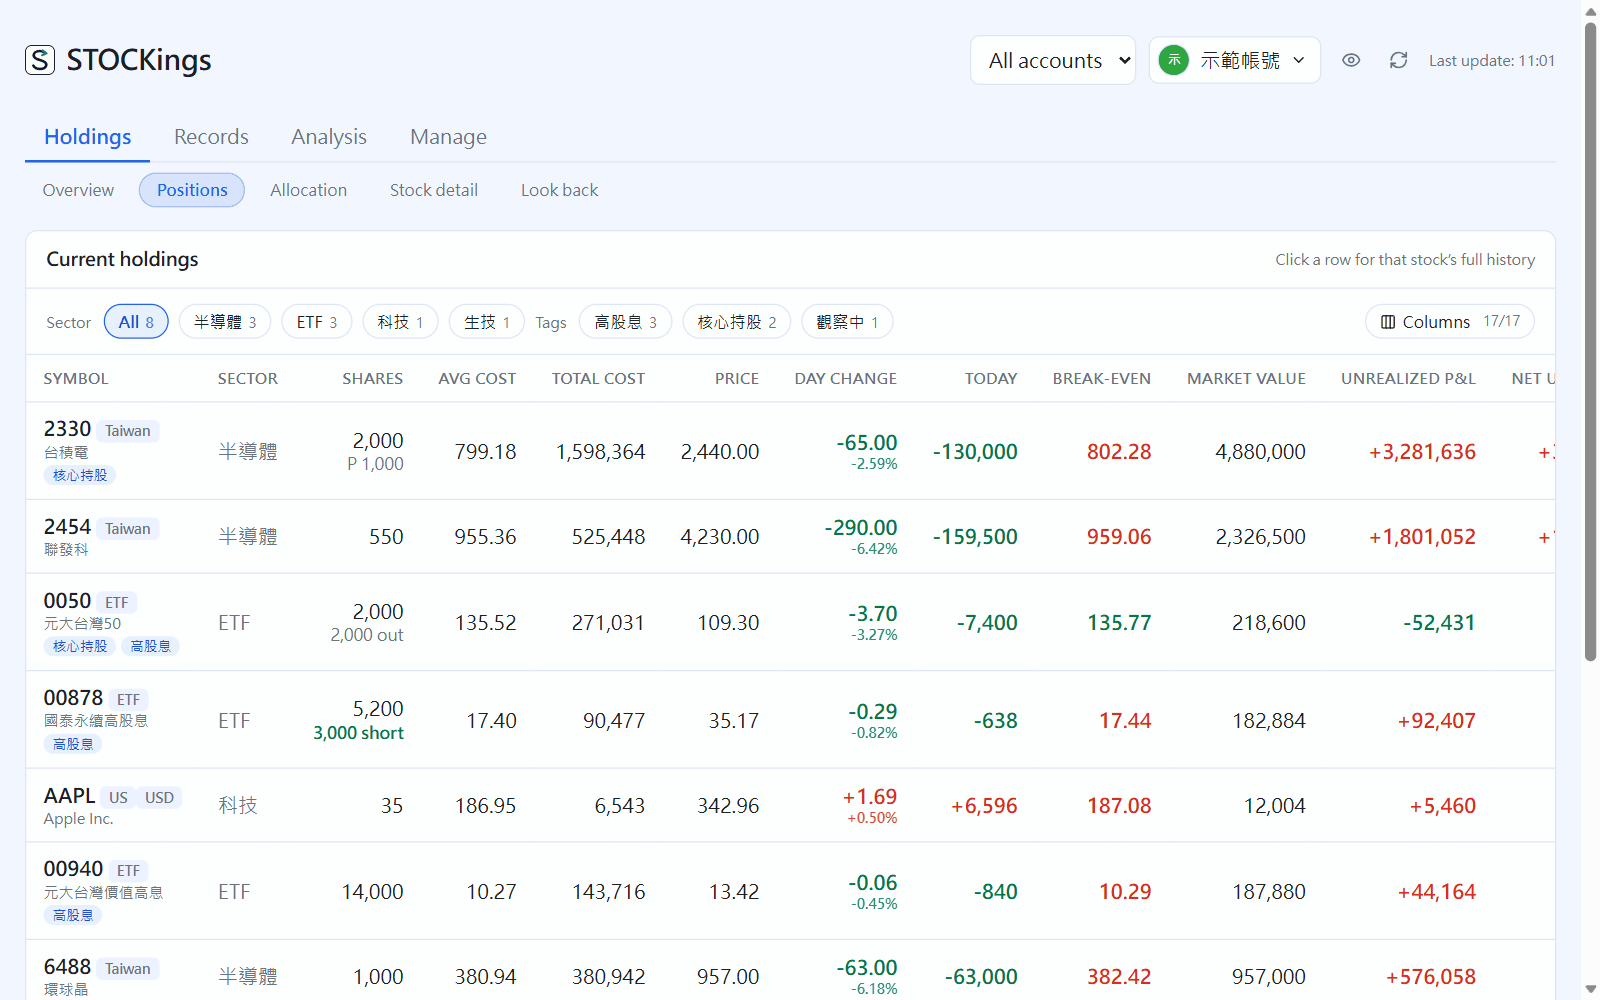
Current holdings; "Closed positions" is below(click the image to enlarge)
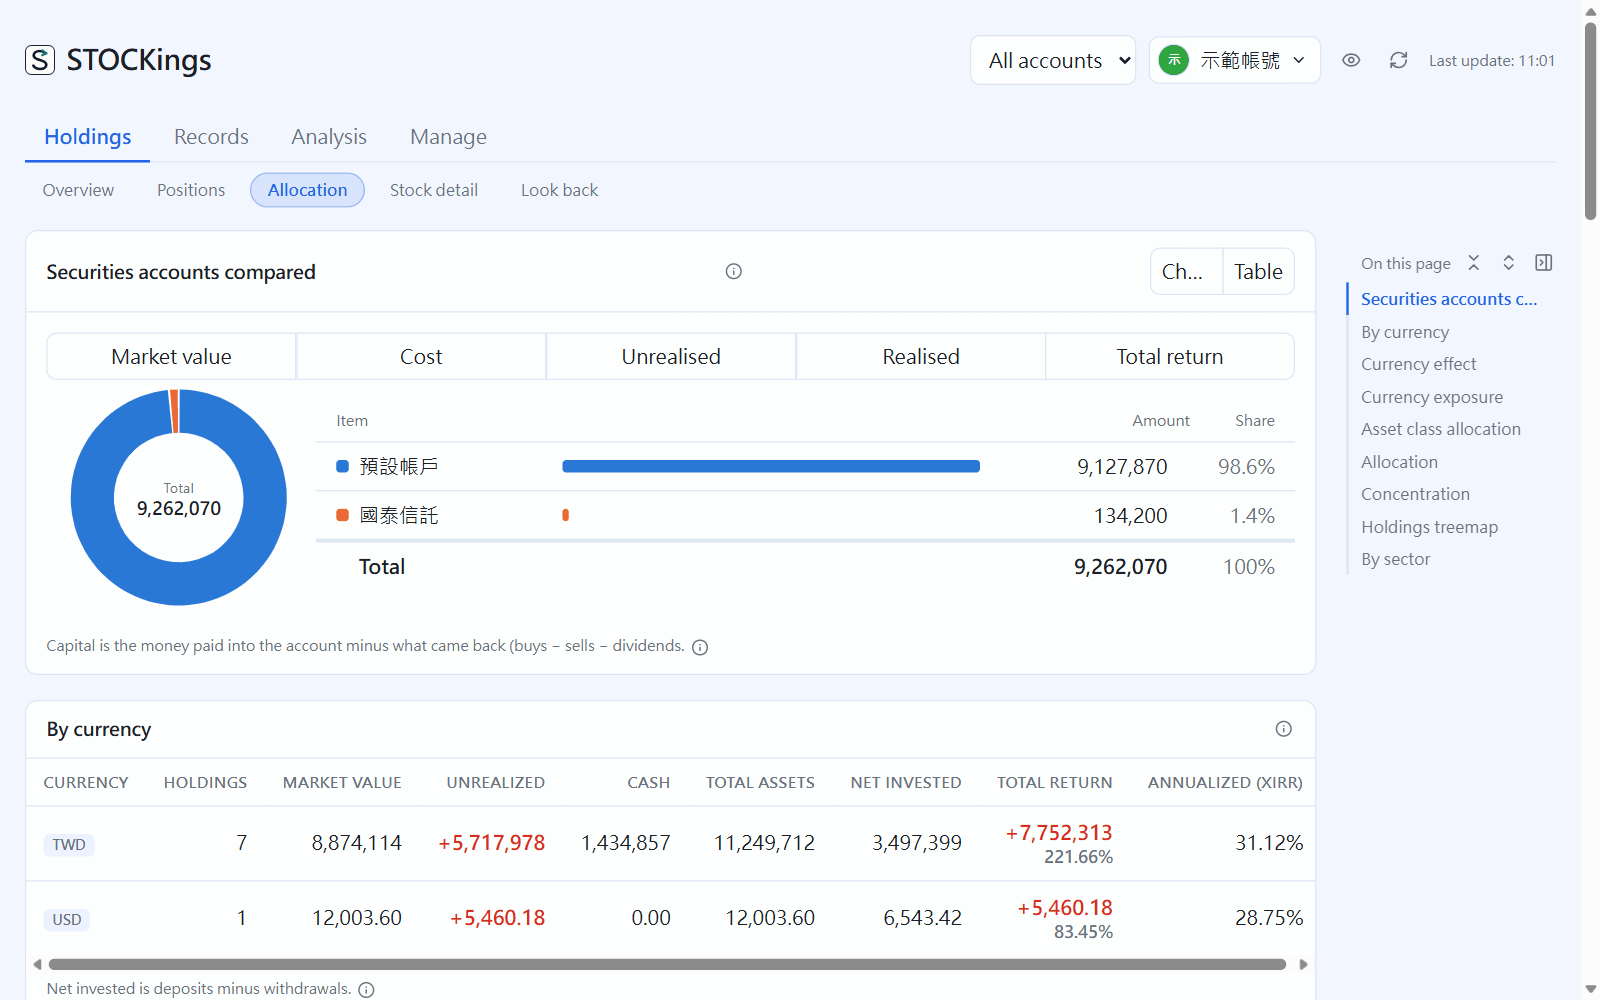
Allocation(click the image to enlarge)
At the top of the Dashboard are the summary cards, four in a row:
| Card | Meaning |
|---|---|
| Total assets | Market value of holdings + account cash + short collateral − liabilities (see "Liabilities" below) |
| Today | How much you gained or lost in the latest trading day: current market value − the previous close's market value − the net of today's trades. Today's buys are valued at the buy price and sells at the sell price; for something going ex-dividend today, the dividend receivable is added back; for US stocks the day's exchange-rate change is included. Fees and taxes are not included. Before the market opens it looks at the previous trading day |
| Principal | Switchable: Net (deposits − withdrawals, default) / Deposits / Withdrawals. This is the money you really put in from your pocket; trades and dividends move money inside the account and do not count |
| Cash balance | The cash ledger's balance |
| Market value | Market value of current holdings at the current price |
| Total return | Total assets − principal. You can switch with / without dividends (without subtracts cash dividends and compensation, looking only at price movement); the percentage uses principal as the denominator |
| Annualized return | You can switch ordinary annualized (compound) / XIRR (which takes the timing of each deposit and withdrawal into account) |
| Dividends and compensation | Cash dividends plus compensation received to date |
| Realised P&L | How much the part you sold gained or lost; the percentage's denominator is the cost of those shares |
| Unrealized P&L | Market value of holdings − cost; the percentage uses cost as the denominator |
| Dividend yield | Cash dividends per share that went ex in the last 12 months ÷ current price (main number), ÷ average cost; estimated annual dividend = dividend per share × current shares. Hover for the annualized amount actually received: cash dividends actually received during the holding period ÷ the average cost invested over the period, converted to one year |
| Liabilities | Shares owed for borrowed-share or short sales not yet covered (at the current price) + margin loans + pledge loans (principal + accrued interest). It appears only when you have liabilities, and total assets already deduct it |
Switches on the cards are remembered. Moving the mouse over a card shows an explanation.
At the bottom of the dashboard is the "Account overview", grouped like a broker app's account overview: listed / OTC / emerging, on loan, trust holdings, overseas securities, TWD cash, foreign-currency cash, funds, bonds and futures, each with its present value (TWD) and weight, with a donut chart beside it; short collateral counts as an asset too. Below that are the liabilities (shares owed on borrowed-share or short sales, margin loans, pledge loans), the asset subtotal, the borrowing subtotal and Net worth (the same as the summary card's total assets). Futures is the total equity of the futures margin accounts (account balance + value of open positions), and the money in those accounts no longer counts in TWD cash.
The "Asset trend" shows the daily changes of total assets, market value of holdings, principal and total return, on the same basis as the cards; the top right switches between 3 months / 1 year / 3 years / all. Switching to "TWR" (time-weighted return) draws returns instead: deposits and withdrawals are cut out so only the investing itself shows, counted from the leftmost day on screen, with a year-or-longer period also labelled annualized. Look at TWR when comparing with the market or with other people; total return shows how much money you made and is affected by when and how much money you put in, so the two numbers differing is normal. Switching to "P&L" draws the cumulative profit trend: total return split into Realised (incl. income) and Unrealized lines, plus total return itself. Unrealized = that day's market value of holdings − the cost of holdings still held that day; Realised = total return − unrealized (profit on sales, dividends, interest, fees and exchange differences are all here), and the two lines add up to total return. All three are cumulative amounts from the first record (not from the leftmost day on screen), with the total return % (total return ÷ principal) shown above; for a percentage trend switch to TWR. Market value of holdings uses each day's closing price (US stocks use that day's exchange rate), so the first time you open it each instrument's history has to be fetched, which takes longer.
Positions:
- Current holdings — what you still hold. At the top are sector chips and tag chips; click one to see only that sector's (or tag's) holdings, and the two can be used together; tags are also listed under each instrument's name. There are three more columns: Day change (current price − previous close, and the percentage), Today (profit) and Dividend yield (last 12 months, current price; hover for yield on cost, estimated annual dividend and the annualized amount actually received) Pin to top: click the ☆ left of the symbol and it turns solid; that holding then always stays at the top (when you sort by a column, pinned and unpinned rows are each sorted that way), and clicking again unpins it. Trades have the same star, and trades of pinned instruments come first (across pages too). Each account has its own pinned list, saved in this browser with the other preferences
- Closed positions — held once and now all sold. The realized profit and the dividends received still count in your performance, so there is a section for them. An instrument that only had day trades is marked "Day only"
Clicking any row jumps to that stock's full history. The form for adding trades is on the "Trades" page.
Allocation: securities accounts compared, split by currency, the currency effect, currency exposure (at each month end how much of your assets are in TWD, USD and so on, stacked to 100%; with only TWD it is a single line), asset class allocation, holdings allocation (a pie chart that can switch between market value / shares / cost, the first 7 instruments each with a colour and the rest merged into "Other"), concentration (how much of the holdings' market value the largest one, the top 5 and the top 10 take; effective holdings = 1 ÷ the sum of squared weights, that is "how many equal-sized holdings this is equivalent to"; below it a cumulative weight line from largest to smallest, the dashed line being equal sizes), holdings treemap (each cell's area is market value and its colour the return, darker means a bigger move, ±20% and beyond equally dark; hover for the amount), and by sector (how much each sector takes by market value and how much it gained or lost).
Asset class allocation (stock / bond ratio): total assets are split by class into individual stocks, ETFs, bond ETFs, funds, bonds, cash, futures and warrants, a donut chart plus a table (amount, number of holdings, weight). The class follows each instrument's asset class (chosen when creating it; for funds and bonds it follows the market), market value uses the current price and today's exchange rate; cash includes short collateral; futures = the futures margin accounts' balance + the value of open positions. Liabilities (margin, shorts) are not deducted, so the total is total assets, not net worth. A line below says how much of the stock position is ETF (ETFs and bond ETFs ÷ individual stocks + ETFs + bond ETFs), to see the proportion of ETFs to individual stocks. Holdings with no quote are not listed (the note below says which). It follows the securities account chosen at the top.
The columns of "Current holdings" are yours to choose. Click "Columns" above the table and untick the ones you do not use and they disappear from the table, and the choice is remembered on this computer. The instrument column is always shown — without it the other numbers cannot be told apart.
The weight column at the far right gives both a bar and a number (for example 46.36%), the share of the portfolio's market value this holding takes.
At the bottom of the table is a total row. Because you may have both Taiwan and US stocks, the total is always converted to TWD (the heading says "Total (TWD)"). Instruments with no quote are left out of market value and unrealized, since otherwise those two numbers would not reconcile. Per-share columns (average cost, price, break-even) are left blank — averaging an average means nothing.
When a holding is lent out or sold short, an extra line under the share count marks it, for example "Lent 2,000" or "Short 3,000".
Tables can be sorted. Click a column heading to sort by it, again to reverse, and a third time to return to the original order. It works on "Current holdings", "Closed positions", "Share count by year", "Returns by stock", "Dividend records", "Cash ledger", "Lending" and "IPO subscriptions"; in the Trades list click "Date" to switch between newest-first and oldest-first.
Records can be filtered. The tables of Trades, Dividend records, Cash ledger, Lending, IPO subscriptions and Regular investing have a filter row above them: a search box (symbol, name, note; for the cash ledger note, account and type, and several words separated by spaces must all match), type chips (several can be chosen; Lending and IPO subscriptions have two groups, so choosing "Lend out" and "Open" gives the loans still out), start and end dates, and "This year" and "Last 12 months". While filtering it shows "N of M matching", and amount-type records also show a total; click "Clear filters" to return to all. Filters are not saved, and changing page or refreshing clears them.
"Holdings → Look back": choose a past day and see how things were at the end of that day: total assets, market value of holdings, cash, liabilities, principal, total return, and for each holding the shares, average cost, total cost, closing price, market value, unrealized profit and weight.
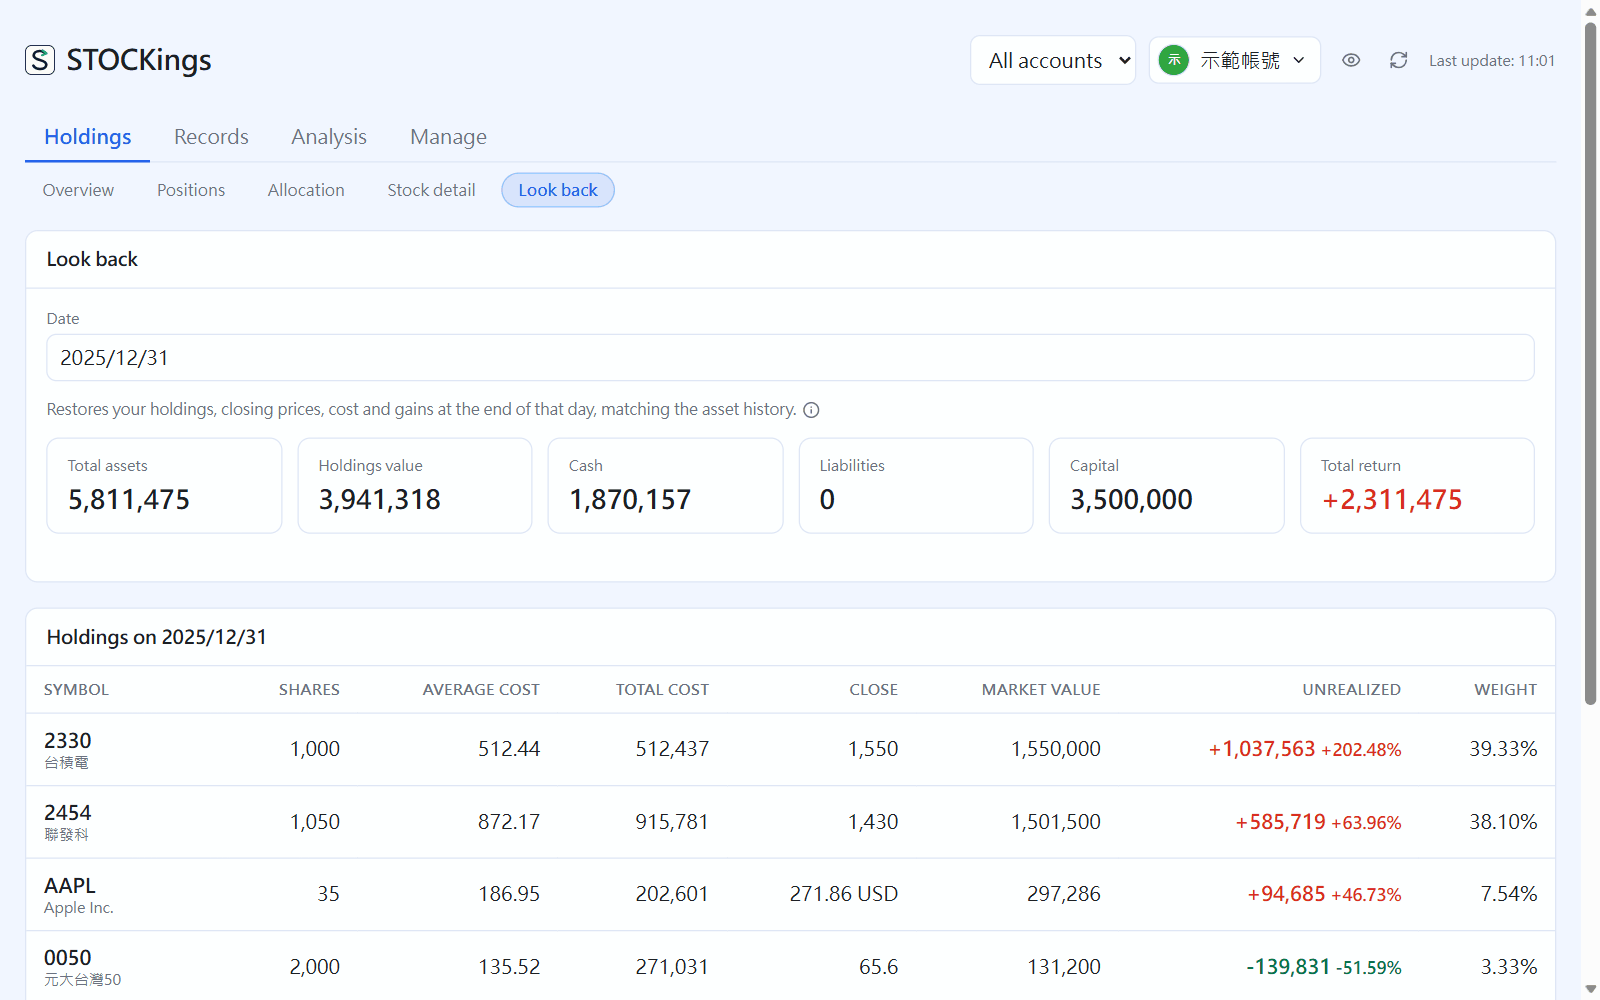
Holdings → Look back(click the image to enlarge)
- The numbers are the same as the "Asset trend" for that day; cost is replayed to that day by first-in-first-out, and later trades do not affect it
- If that day is not a trading day (a weekend or holiday) the previous day's close is used, and the screen says so
- It is only for viewing and changes no records; when some securities accounts are ticked at the top right it looks only at those (several are combined)
- The first time you open it the whole asset trend has to be worked out first, so it waits a moment (quick if the Returns page has already computed it); after that, changing the day computes only that day and comes out quickly
You can switch instruments at the top, and clicking the symbol in the title jumps to "Technical analysis" for it (funds and bonds have no daily candles and cannot be clicked). While you hold it, the first two cards are today's: the current price and today's change (amount, percentage), and this holding's Today profit and Today's rate (today's profit ÷ the market value at the previous close, on the same basis as "Today" in Positions). It looks at one stock's: cost, break-even (plus a break-even incl. dividends card once you have received cash dividends, see "Glossary"), each trade, inventory lots (which lot is not yet sold and its cost), dividend records, and at the bottom this stock's investment journal (see "Investment journal").
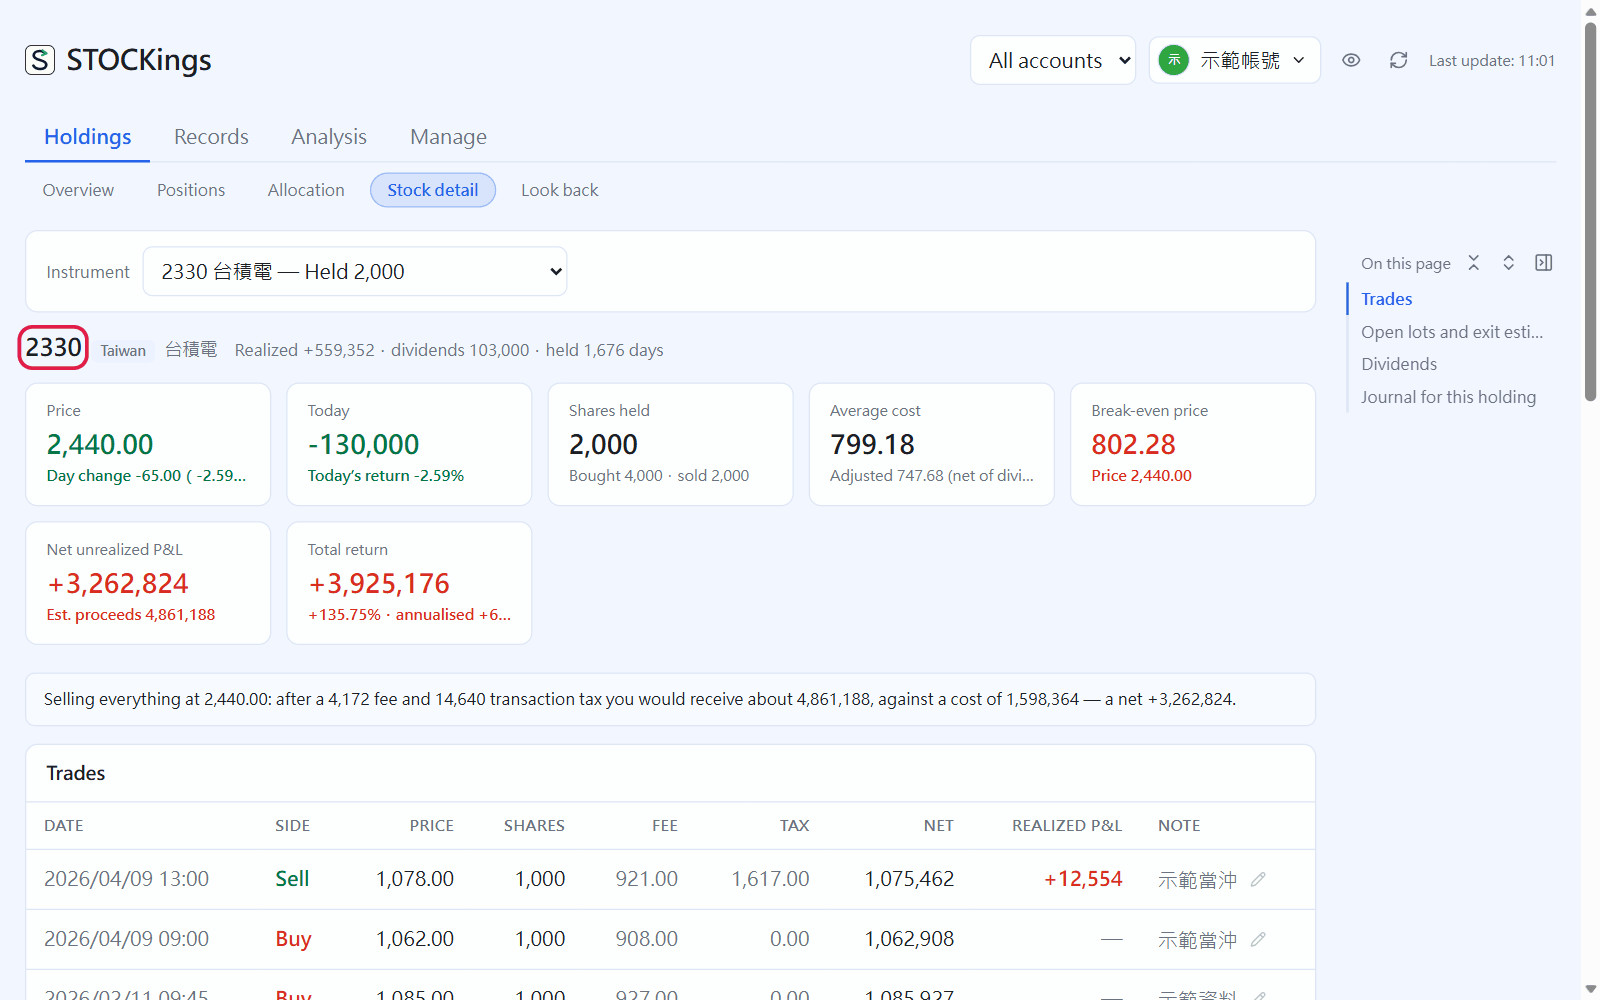
Stock detail; click the symbol in the red box to open technical analysis(click the image to enlarge)
The note on trades and dividend / stock dividend tables can be edited right here: hover over the note column and click ✎, Enter to save, Esc to cancel. The other fields (price, shares, date, amount) are changed on the "Trades" and "Dividend records" pages, where inventory and profit are recalculated.
At the top is the New trade form: the trade types are Cash, Margin loans (M), Day trade (D), Lending (L) and Short sale (S), matching the "M, D, L, S" in a broker app; types that do not apply to this instrument are greyed out (for example margin and short sales are for Taiwan stocks only), with an explanation on hover. Below are all the trades, which can be paged (10 to 200 per page).
The "Columns" button above the table works like the one for current holdings: turn off the columns you do not use and the choice is remembered. Dividend records have it too.
The "Write a note" at the far right of each row opens an investment journal entry linked to that trade; one you have written about shows the icon in the accent colour (see "Investment journal").
Column widths can be dragged: move the mouse to the right edge of the header and drag to change that column's width, which is remembered; double-click the handle to restore automatic width. Trades, Dividend records and Current holdings all support this.
Two charts and two tables:
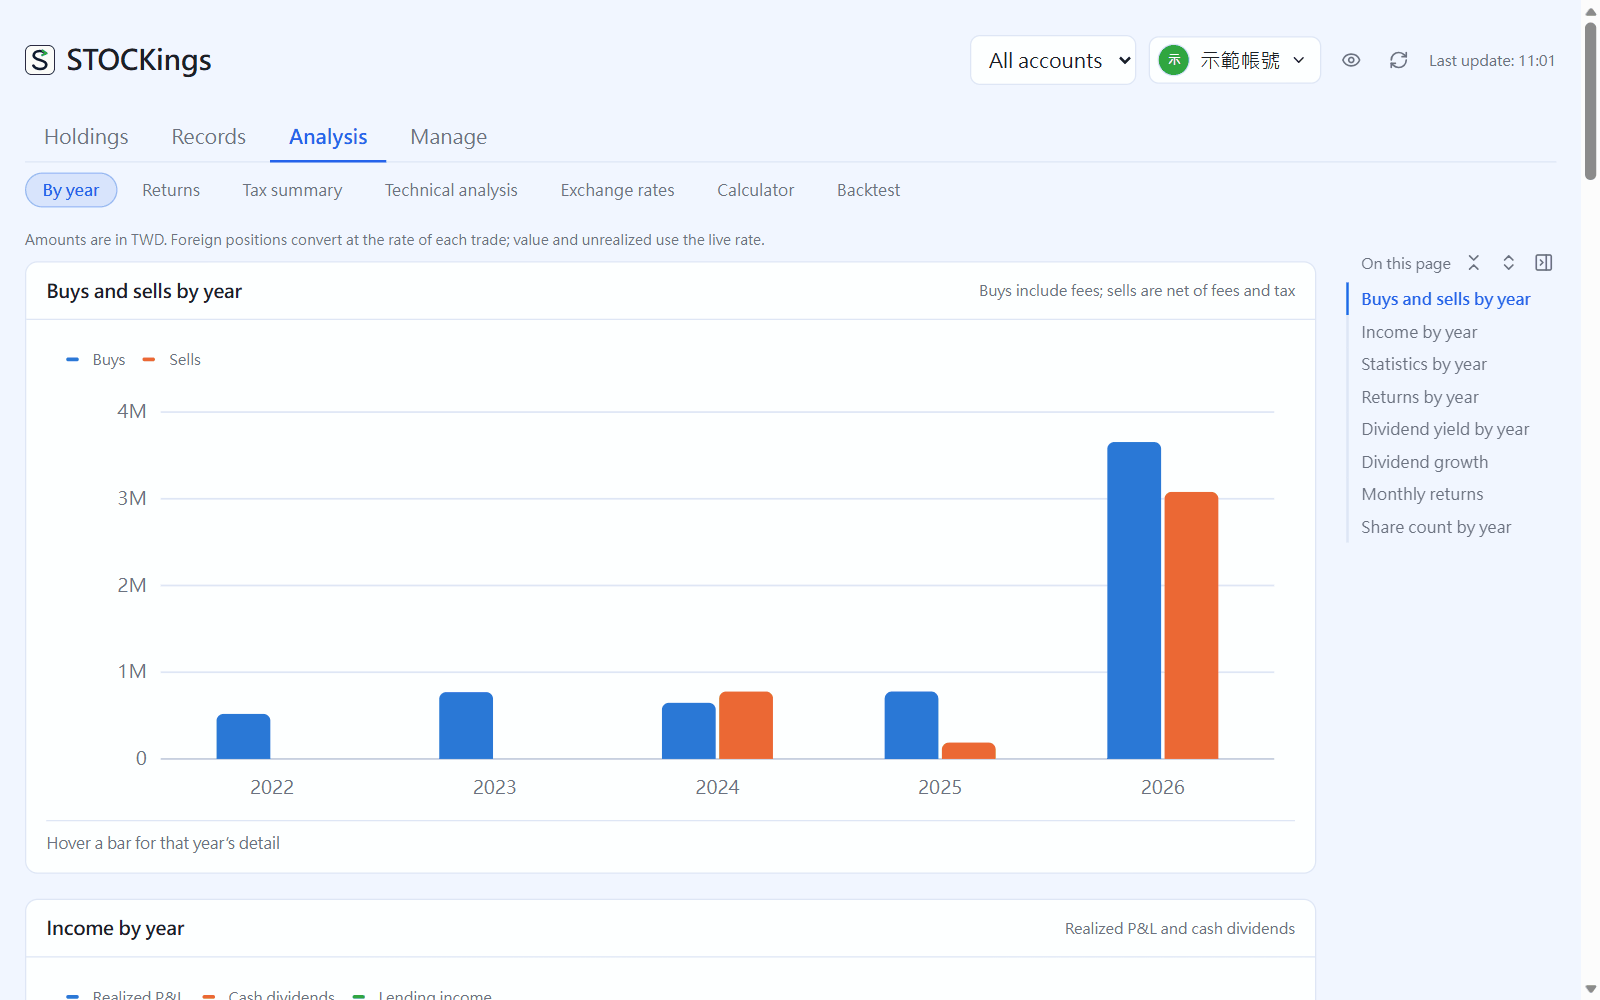
Analysis → Statistics by year(click the image to enlarge)
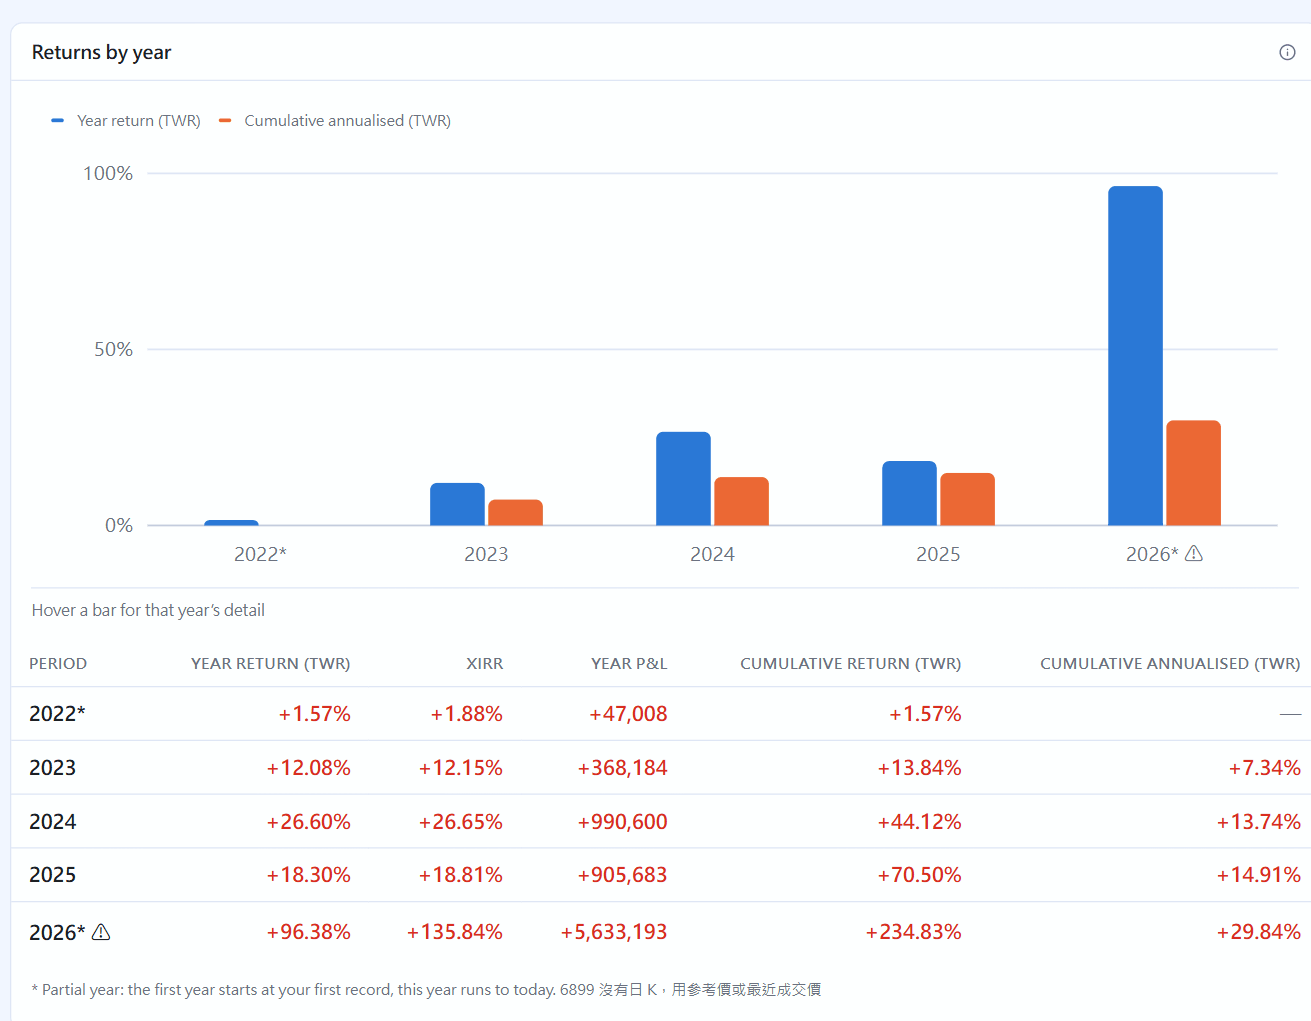
Returns by year(click the image to enlarge)
- Buys and sells by year — how much was bought and sold each year
- Income by year — each year's realized profit and cash dividends
- Statistics by year — detailed numbers, including fees, tax and cumulative amount invested
- Share count by year — how many shares of each stock were held at each year-end
Moving the mouse over a bar shows that year's numbers. Click any year in the "Statistics by year" table and the full detail for that year opens: all trades and dividends in it. Press Esc or click the background to close.
The top right can switch to quarters or months, and the charts and tables follow. Which period a record falls in: trades by trade date, dividends by pay date, lending by settlement date.
Below are two more year-by-year charts (a group of bars per year, with a table underneath), worked out from the asset trend, in TWD, following the securities account chosen at the top:
- Returns by year — Year return (TWR) is that year's time-weighted return (deposits and withdrawals cut out, the same basis as the period return on the Returns page); Cumulative annualised (TWR) is the cumulative TWR from the first record to that year-end converted to an annual average: (1 + cumulative) ^ (365 ÷ days) − 1, not annualized for less than a year. The table also lists XIRR (money-weighted, showing how much your money really earned), the year's profit and the cumulative return. A ⚠ after the year means the account's cash was negative for some days that year, most likely because a deposit was not recorded (only the stock purchases were): when total assets are near 0 the return can swing wildly, so those years' numbers may be distorted; add the deposit under "Account" and it becomes normal. Cash is counted by settlement date, the same as the cash account shows: money deposited after a trade but before settlement does not count as negative. The explanation is not written below; it shows only when you hover over the ⚠
- Dividend yield by year — the cash dividends received that year (including compensation) ÷ the average holdings of that year. The denominator of Yield on value is the average of each trading day's market value of holdings; the denominator of Yield on cost is the average of each trading day's cost of holdings still held. Only cash dividends count, not stock dividends or price gains on sales. Yield has nothing to do with account cash, so it is not marked ⚠
A * after the year marks a partial year: the first year counts from the first record, and this year counts to today.
Dividend growth: each year's cash dividends received (before tax, including compensation, assigned to the year by pay date) as bars with the year-on-year rate. This year has an extra bar Still expected: for each current holding that went ex more times last year than has been recorded this year, the extra times are estimated at last year's cash dividend per share × the current shares (a quarterly payer recorded twice this year gets last year's third and fourth estimated); it is only an estimate based on last year, and is replaced by the actual once announced and recorded.
Monthly returns (a heat map): one row per year, one cell per month; a cell is that month's TWR = (1 + cumulative TWR at month end) ÷ (1 + the previous month end's) − 1, with deeper colours for bigger moves (colours follow the up/down colours in Settings); the last column Year is the same number as the year return on Returns by year. Hover over a cell for two decimals and an explanation. A * marks a partial month (the first month counts from the first record, this month to today); a ⚠ means the account's cash was negative for some days in that month (a deposit may not have been recorded, again counted by settlement date), and the return may be distorted. Worked out from the asset trend, in TWD, following the securities account chosen at the top.
Returns for the whole and for each stock, including annualized return.
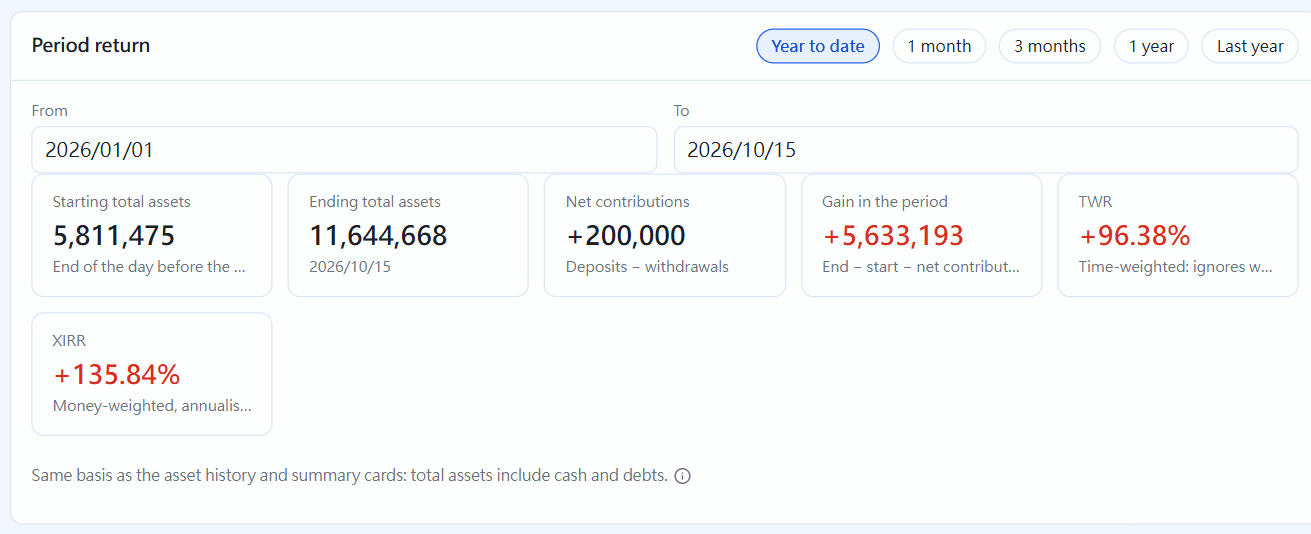
Period return(click the image to enlarge)
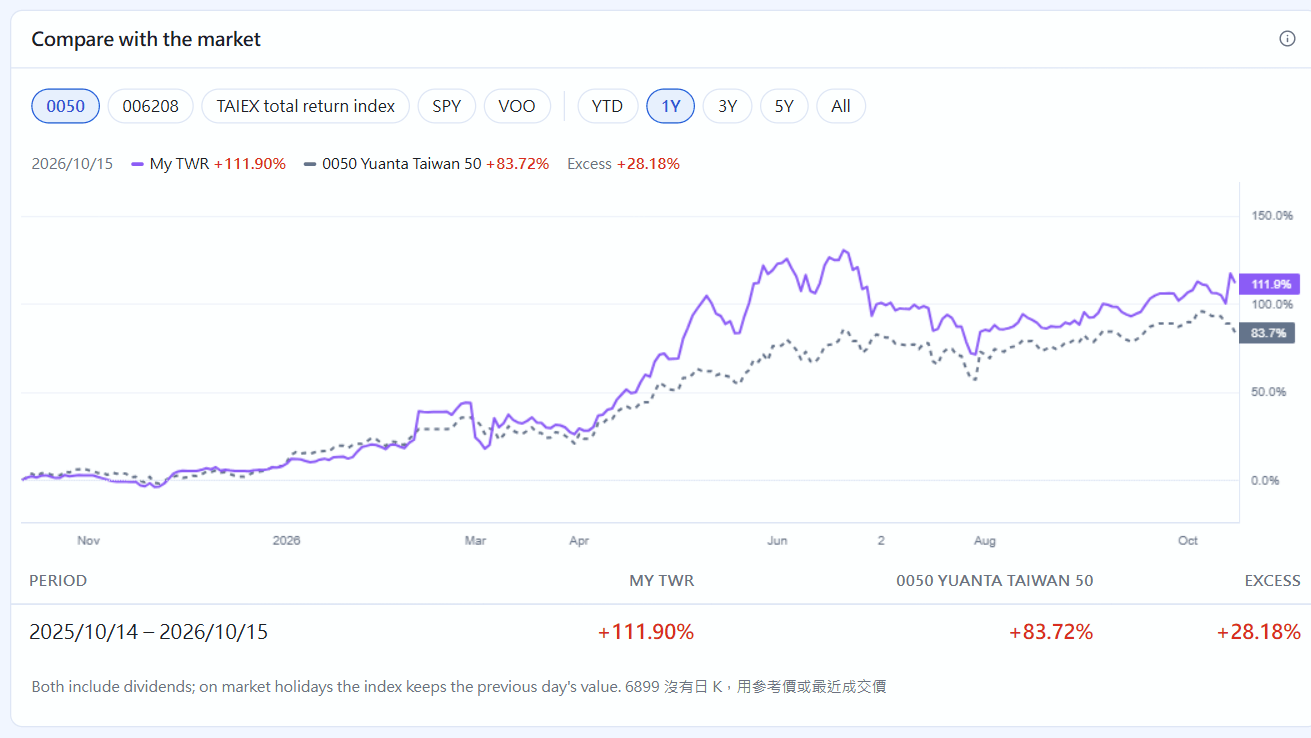
Compare with the market(click the image to enlarge)
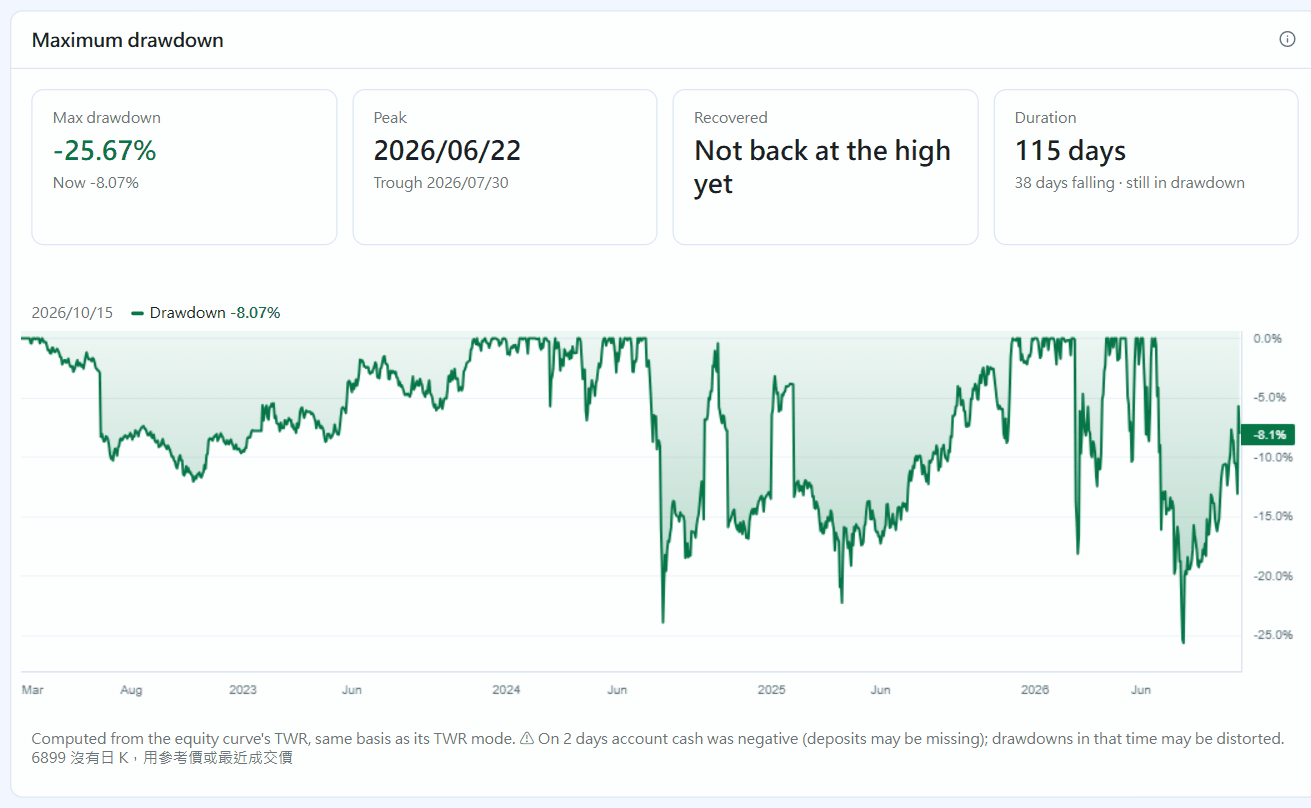
Maximum drawdown(click the image to enlarge)
Period return: choose a period (year to date, last 1 month, last 3 months, last 1 year, last year, or your own start and end dates) and see the total assets at the start and end of that period, net deposits (deposits − withdrawals), profit, and two kinds of return:
- TWR (time-weighted): not affected by when you deposit or withdraw, it shows how well you operated and can be compared with the market
- XIRR (money-weighted, annualized): takes the timing of each deposit and withdrawal into account, showing how much your money really earned; for a very short period converting to a year exaggerates it, so treat it as a rough guide (above 10000% it shows "> 10000%")
The start is the total assets at the end of the day before the start date, and deposits and withdrawals on the start date itself count inside the period. The basis is the same as the asset trend and summary cards (total assets include cash and liabilities; borrowed money and transfers between accounts do not count as investment).
P&L breakdown: total return (as on the summary card: total assets − principal) is split into unrealized (market value of holdings with a quote − cost) and realised (incl. income) (total return − unrealized, the part already banked). Realised income breakdown splits the realized part further into: capital gains (realized profit on sales, after buy and sell fees and tax), cash dividends, compensation, interest (bond interest + savings interest), and other (the remaining difference: lending income and fees, futures, foreign-currency cash exchange differences, account fees, margin and pledge interest and so on), and every item adds up to exactly the realized amount.
Each item is a bar from the zero line to the right (gain) or left (loss), coloured by the up/down colours in Settings, with the amount and share beside it. The zero line is placed according to the ratio of the biggest loss to the biggest gain: with all gains it is at the far left, and with a small loss near the left, so the bars of the several charts line up. Share = amount ÷ total; when losses cancel too much of the gains (the absolute values of all amounts add up to more than 1.5 times the total) the share is meaningless, so it shows "—" with a note below, and you compare sizes by the length of the bars. The donut on the left shows how much each gain item takes (drawn clockwise from 12 o'clock, losses not drawn), with the total in the middle; the small coloured square before a name matches its piece of the donut, and hovering highlights both. It follows the securities account chosen at the top, in TWD.
Compare with the market (below the period return): your own TWR and the market's total return index (dividends reinvested) are drawn on one chart, both zeroed at the start of the range, on the same percentage axis. Choose the benchmark at the top: 0050 (default; when viewing in dollars the default is VOO), 006208, TAIEX total return index, SPY, VOO; the range can switch between this year / 1 year / 3 years / 5 years / all, and the choice is remembered. The start, like the period return, is the close of the day before the start date; on days the market is closed the previous day's index is used; when the currency differs, each day's USD rate is used for conversion (viewed in TWD, VOO includes the exchange-rate movement). A row under the chart gives the period, my TWR, the market's and the excess (mine − market). 0050 and 006208 use Yahoo's adjusted closing prices and the TAIEX total return index uses FinMind; SPY and VOO, like individual US stocks, use Tiingo's adjusted closing prices if you have entered a Tiingo key (otherwise Yahoo). In commercial mode neither Yahoo nor FinMind can be used: 0050 and 006208 switch to a total return the app works out itself (TWSE daily prices plus the ex-dividend data saved each day, dividends reinvested), and the TAIEX and TPEx total return indices come from the TWSE and TPEx open data saved each day; both only cover the time since collection started. In normal mode 0050 and 006208 also fall back to the computed series when Yahoo is unavailable. SPY and VOO can be chosen only with a Tiingo key entered; benchmark buttons with no source turn grey, and where the chart would be it says "In commercial mode there is no data source licensed for commercial use".
Maximum drawdown: how far each day's TWR is below its earlier best (drawdown = TWR index ÷ earlier peak − 1, an underwater chart where 0 is at the peak). It uses TWR rather than total assets: money deposited does not look like profit and money withdrawn does not look like loss. The four cards above: Maximum drawdown (and the current drawdown), Peak and the trough day, the Recovered day (if not yet it says "Not back at the high yet"), and Period (days from peak to recovery, counted to today if not recovered; below it, how many days it fell). It is counted down to −100% at most: when account cash is negative (a deposit was not recorded, counted by settlement date) TWR can fall below 0, the drawdown for that stretch is distorted, and a note under the chart says how many days cash was negative.
P&L contribution ranking (below the realised income breakdown; the donut on the left shows the holdings that gained, and those not in the top ranks are merged into a grey "Other"): each holding's total return (realised profit + cash dividends including compensation + lending income + unrealized profit (less the fees and tax on sales), which is the "Total return" of the stock table below) ranks the top 5 or 10 that gained most and lost most, as bars going left and right from the centre line. Tick "Include closed" to rank sold-out instruments as well (ticked by default). Holdings with no quote have no unrealized figure and are left out (a note below says how many).
Fees and taxes (below the P&L contribution ranking): trade fees (including lending short-sale costs and futures fees), transaction taxes (securities and futures), dividend remittance fees, tax withheld on dividends and NHI premiums, as an area chart accumulated month by month from the first record; at the top are the cost total and Share of gains = cost ÷ (total return + cost), meaning what fraction of everything earned is the part you could have earned in addition without these costs. When a securities account is chosen, only that account counts (futures not included).
Under "Market → Technical analysis", choose the instrument at the top. Any instrument can be viewed, with no need for trade records.
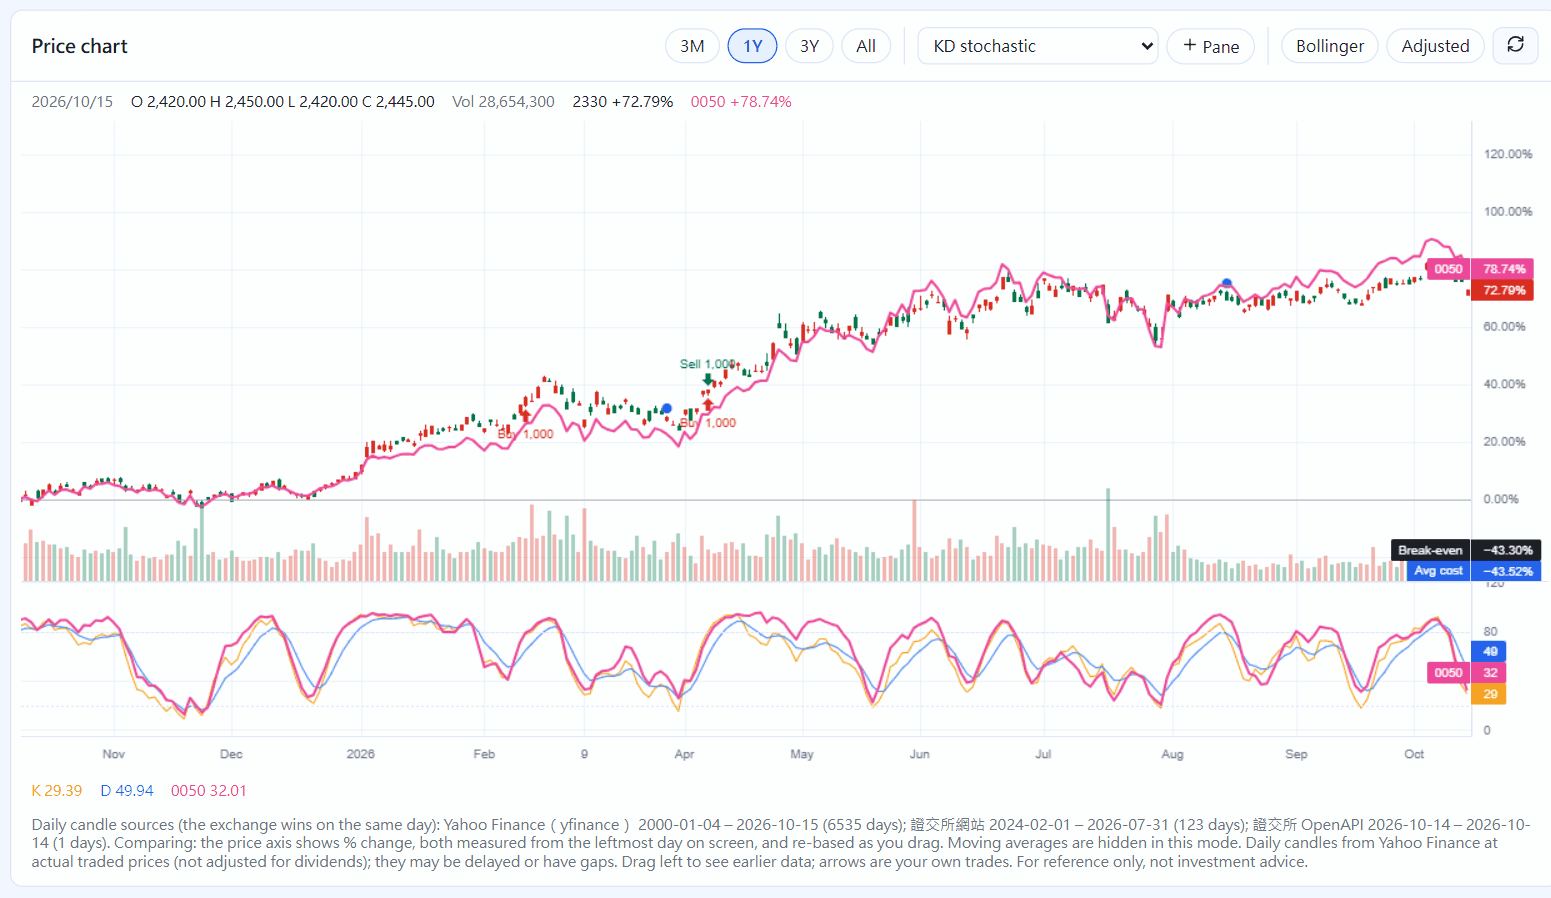
Comparing two(click the image to enlarge)
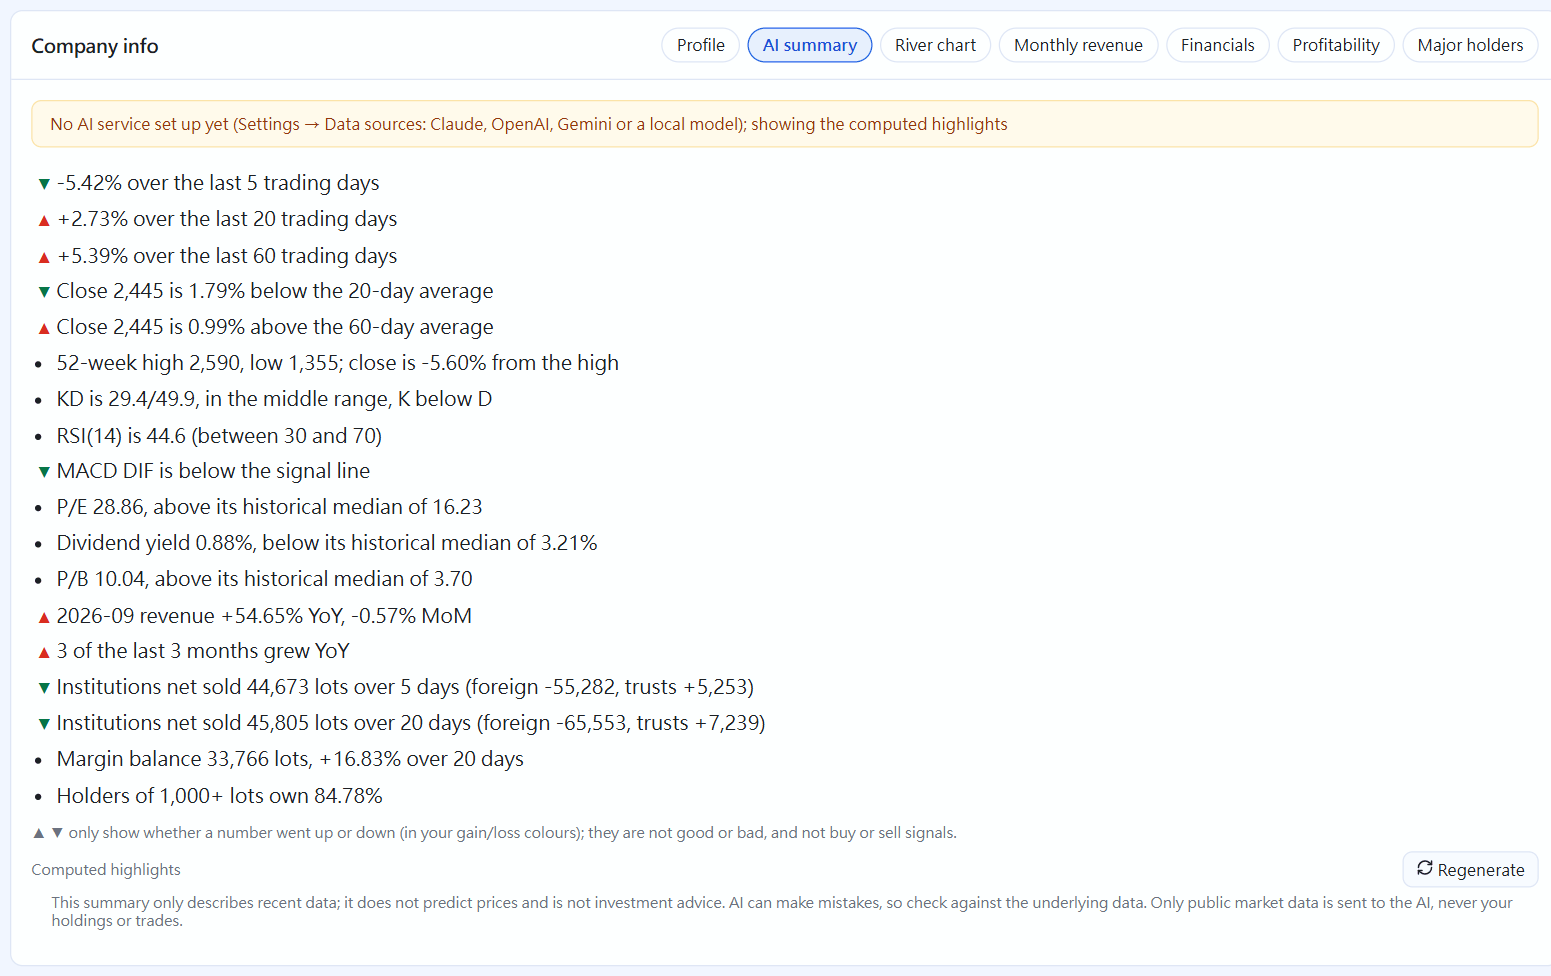
AI summary(click the image to enlarge)
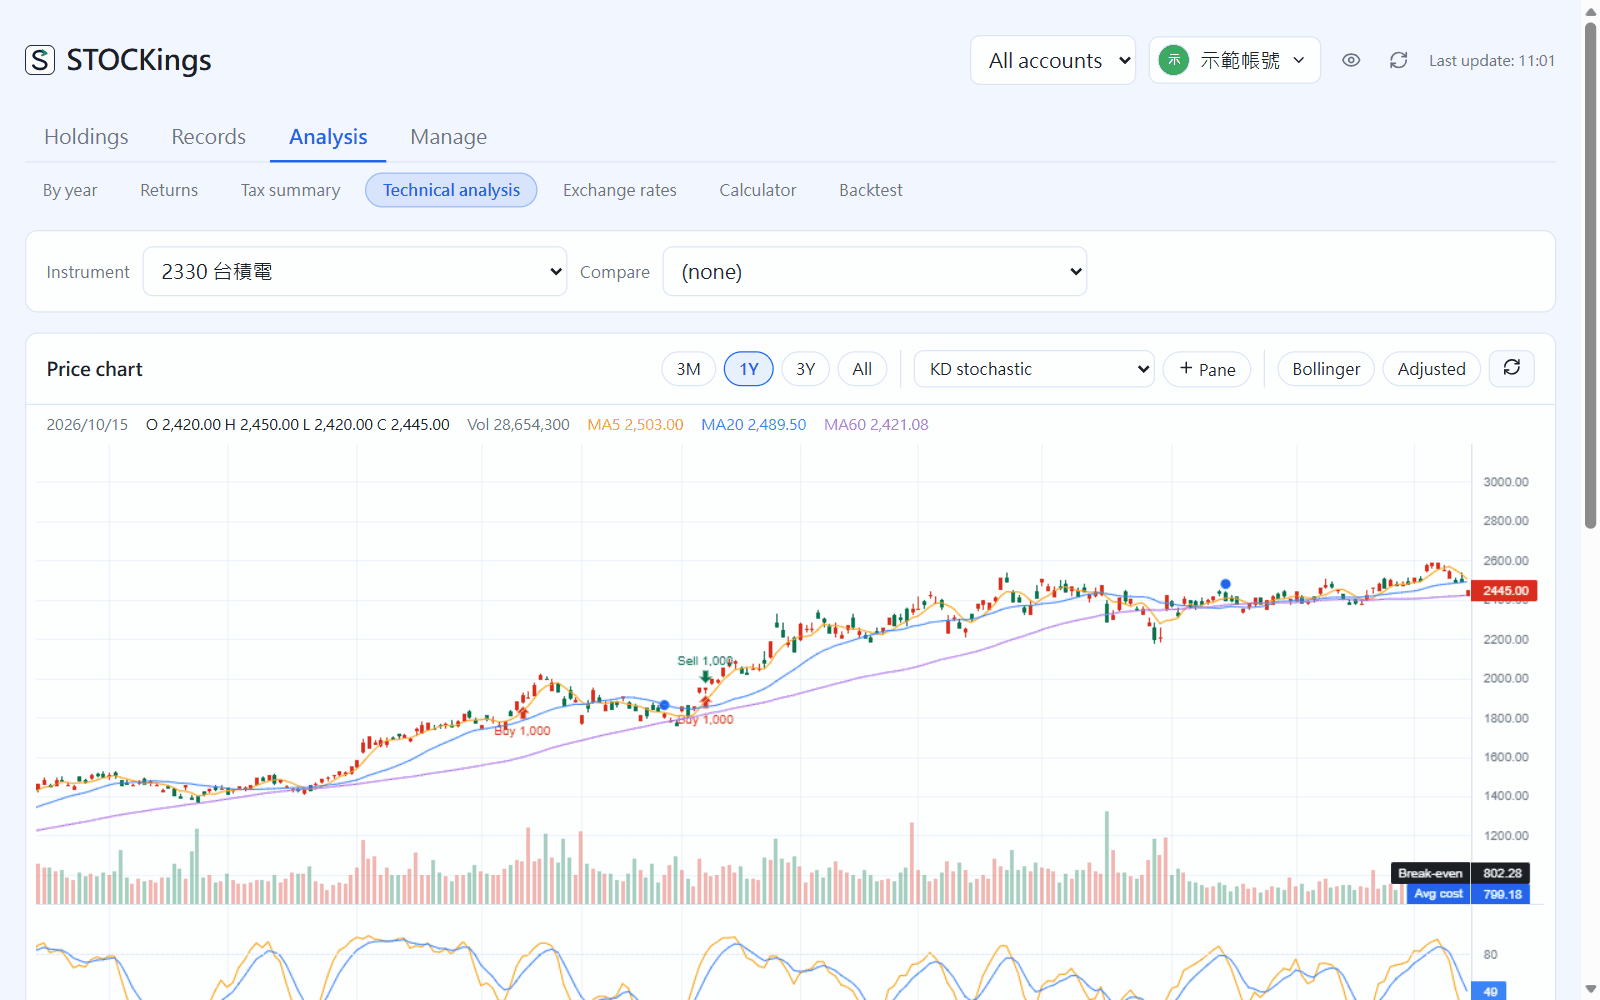
Technical analysis(click the image to enlarge)
Price chart
- The range at the top right (3 months, 1 year, 3 years, all) is how much you see at once: choosing 1 year makes the screen one year wide, stopping at the latest day. To see an earlier year, drag left, all the way to the earliest data; the mouse wheel zooms in and out.
- For an instrument with trade records, red arrows are your own buys and green arrows are sells; if you still hold it, the dashed line is average cost and the dotted line is break-even.
- On a day you wrote an investment journal entry there is a dot above the candle; moving the mouse to that day shows the entry's title at the top.
- The "Bollinger" button overlays Bollinger bands on the main chart (the 20-day average plus and minus 2 standard deviations).
- Adjusted: adds back the effect of dividends and stock dividends, so a long-term view is not cut by a gap every year at ex-dividend. Prices then differ from the prices you actually traded at, so the cost lines are not drawn; the arrows are still placed on the trade days.
- Moving the mouse over a candle shows that day's open, high, low, close, volume and moving averages at the top.
Sub-charts (several can be open at once)
Each indicator name at the top right is a sub-chart, and ✕ removes one. Click "+ Indicators" to open the picker (centred on top of everything, so it is fully visible however small the chart is): search at the top (name, abbreviation or description), groups on the left (all, favourites, main chart overlays, technical, fundamentals, chips, ETF), a one-line description for each, and a star to add it to favourites. Clicking a sub-chart indicator opens another sub-chart (up to 4; when full the oldest is replaced); clicking a sub-chart's name opens the same picker to replace that one; overlays (Bollinger bands) turn on and off with a click. Esc or clicking outside closes it. Each sub-chart can show:
| Group | Choices |
|---|---|
| Technical indicators | KD, MACD, RSI, bias (against the 20- and 60-day averages), Williams %R, OBV |
| Fundamentals | P/E, dividend yield, price-to-book (the dashed line is the median of the whole history). Taiwan stocks have daily data; for US stocks first enter an SEC contact email under "Settings → Data sources" |
| Chip data (Taiwan stocks) | Net buying and selling of the three institutional investors (red and green bars are the total, with foreign investors, investment trusts and dealers listed below), margin balance, short balance, in lots |
| ETF | Premium / discount (market price against the stock exchange's estimated NAV). The exchange publishes only the current one, and the trend is what this computer saved each day you opened it. For ETFs you hold, the official NAV published by the fund company (SITCA open data) is saved each day too; hovering a day that has it also shows the official NAV and the premium against it (the price is the one fetched that day, the close only if fetched after the close). Older NAV history exists only on each fund company's website and is not fetched automatically: download it there (CSV or Excel with "date" and "NAV" columns) and use "Import NAV history" when editing the ETF under "Manage → Securities"; days already stored are not overwritten (funds work the same way) |
After-hours data (institutional investors, margin and short) is published in the evening; when today's is not out yet, the legend shows the latest day's numbers with the date.
Comparing two
Choose a second instrument under "Compare" at the top, and the price axis of the main chart changes to percentage change, with both counted from the leftmost day on screen and drawn on the same chart (the pink line is the one compared); dragging left or right restarts the count. The legend lists both instruments' change up to the cursor day.
Sub-charts overlay the compared instrument too, but only ratio and percentage types (KD, RSI, bias, Williams, P/E, dividend yield, price-to-book, premium / discount). MACD, OBV, institutional and margin data are prices or lots, and the two differ so much in size that the smaller one would become a flat line, so they are not overlaid, and the legend says so. No moving averages are drawn in comparison mode.
Stock info (below the price chart)
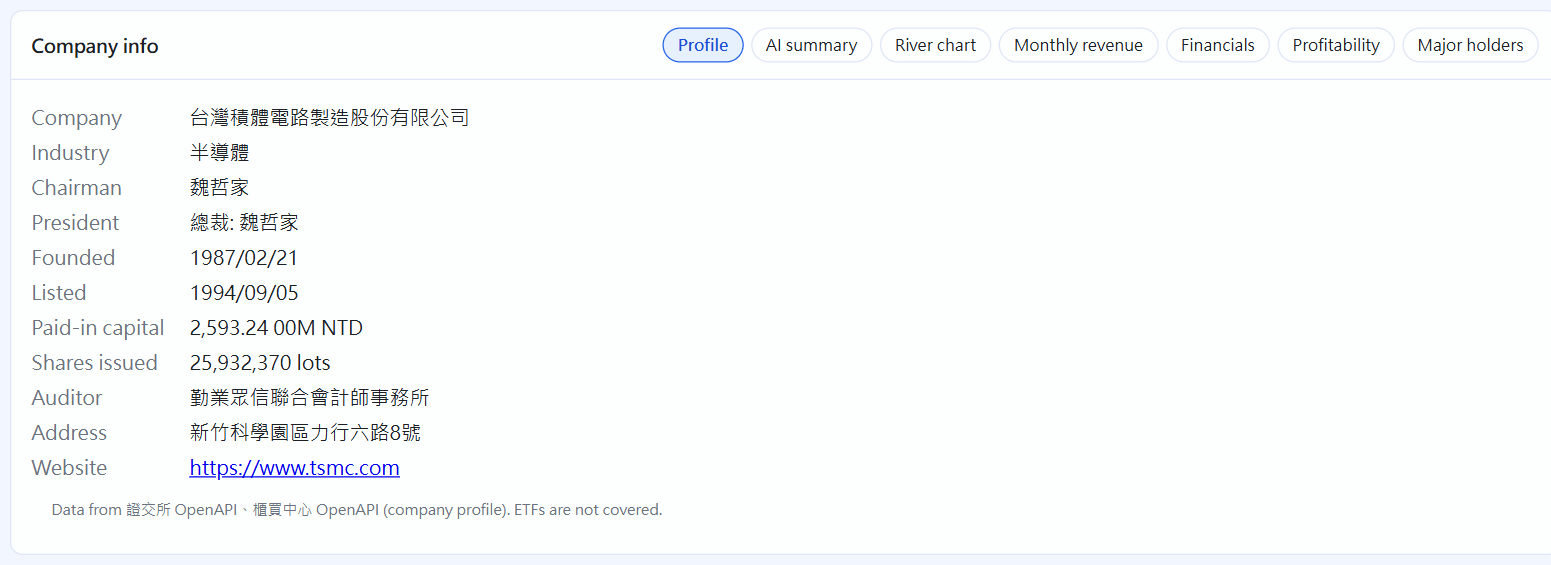
Stock info(click the image to enlarge)
| Tab | Contents |
|---|---|
| Profile | Company name, industry, chairman, general manager, founding and listing dates, paid-in capital, shares issued, website (none for ETFs) |
| AI summary | Turns this stock's recent numbers into a paragraph, see below |
| River chart | The black line is the closing price and the coloured lines are "EPS × a number of multiples" (the multiples are the 10 / 30 / 50 / 70 / 90th percentiles of this stock's own historical P/E), showing where the price sits in its own history. It can switch to a price-to-book version. The default is the last 5 years |
| Monthly revenue | A bar chart of the last 24 months of revenue with the year-on-year rate; the table lists revenue, YoY (against the same month last year) and MoM (against the previous month) |
| Financial statements | A chart of revenue and EPS each quarter; the table has revenue, gross profit, operating income, pre-tax profit, net profit, EPS, and assets, liabilities and equity. It can switch to annual (four quarters summed) |
| Profitability | The trend of gross margin, operating margin and net margin; the table also has ROE, ROA (last four quarters), debt ratio, current ratio and last four quarters' EPS |
| Large holders | The share held by TDCC's holders of 1,000 lots or more and by small holders under 100 lots. TDCC publishes once a week, and the trend accumulates weekly from when you start using it |
How the AI summary is made: the program first works out the recent facts (price change, moving averages, KD, RSI, P/E against its historical median, monthly revenue, institutional net buying and selling, margin, large-holder share), and then asks an AI to write those facts as a paragraph. It only describes; it does not predict or give buy or sell advice, and you can expand "Data used" to check it yourself. The paragraph and the bullet points use the interface language (Settings → language); after changing language, click "Regenerate" or look again the next day, and the AI writes in the new language.
- To have an AI write it as a paragraph, choose an AI under "Settings → Data sources" (Anthropic Claude, OpenAI or Google Gemini) and enter your own API key (using your own quota), or use a model on your own computer (see below). Without it, it still works and simply lists the facts.
- Only public market data is sent to the AI, never your holdings or trades.
-
Using a model on your own computer: first install Ollama or LM Studio and download a model
(for example run
ollama pull qwen3:8bin Ollama), then choose "Local model / OpenAI-compatible" under "Settings → Data sources", enterhttp://localhost:11434/v1(Ollama) orhttp://localhost:1234/v1(LM Studio) as the address, and click "List available models" to pick one. It is free and your data never leaves the computer, and no key is needed; but it needs enough memory (a model around 8B uses about 8 GB), without a graphics card a paragraph takes tens of seconds, and the quality in Traditional Chinese depends on the model, which occasionally produces Simplified characters. - Models keep changing: "List available models" beside the model field lists every model this key can use right now, and you pick a new one without waiting for a program update. When the model you chose is withdrawn, the summary page says "Model not found, please choose another".
- Each stock is generated once a day, and only "Regenerate" asks again. The AI can be wrong; the "Data used" is what counts.
- The ▲ ▼ before each point means the number went up or down (price change, against the moving average, MACD, revenue year on year, institutional net buying and selling, change in large-holder share), coloured by the up/down colours in Settings; they say only direction, not good or bad: whether a P/E above its median or an RSI over 70 is good or bad depends on each person's strategy, so those have no arrow.
Data and offline use
-
Drawing tools (the column left of the chart): horizontal line (H), vertical line (V), trend line (T), ray (R), parallel channel (P), box (B), Fibonacci retracement (F), text note (N) and measure (M).
Pick a tool and click once on the main chart (horizontal or vertical line, text), twice (start and end), or three times for a parallel channel (the first two draw a line, the third sets the width); a hint at the top says which click you are on.
Measure shows the price change, % change, bars and days between two points and is not kept. Esc cancels and goes back to the cursor
- Select and edit: with the cursor, click a drawing to select it, Shift to add more; drag a drawing to move it, or drag its end points (the point on the channel's second line sets the width); the small toolbar above changes the colour, locks it (locked drawings cannot move or be deleted), edits the text of a note (or double-click), and deletes (or press Delete). Click elsewhere on the chart to deselect
- Object list (the list icon): the top row is the top layer; rename, show or hide, lock, delete, bring forward or send backward; click a row to select it (Shift for more)
- Undo and redo (Ctrl+Z, Ctrl+Y, or the arrows in the toolbar): per stock and only while the page is open; when another window changes the same stock's drawings, this history is cleared so it cannot overwrite the newer version
- With the magnet on, the pointer snaps to a bar's open, high, low or close when close to it. The eye hides all drawings for now, and the bin deletes this stock's drawings (locked ones stay)
- Drawings are remembered per stock (in your account's settings) and are there next time; two windows on the same computer stay in sync; they are not shown in compare mode (the price axis is % change)
- The range, sub-charts, adjusted and Bollinger settings are remembered, and next time it looks as you left it.
- For Taiwan stocks the daily candles follow the stock exchange and TPEx data (each day's closing quotes, with missing months filled in from the exchange websites), and days the exchange lacks and earlier history come from Yahoo Finance; below the price chart it marks which period each source supplied. Daily candles of foreign stocks come from Yahoo Finance (US stocks switch to Tiingo once you enter your own Tiingo key, and the source is marked below the chart the same way). Fundamentals, chip data and monthly revenue come from FinMind (which compiles stock exchange and TPEx data) and the open data of the stock exchange and TPEx; large holders come from TDCC. Which source each item used can be seen under "Settings → Data sources".
- Data you have viewed is saved on this computer, and afterwards only the new part is fetched. Without a network the saved part still shows, with a notice at the top; once you are connected click ↻ to fetch again. Instruments with no quote available, such as emerging or unlisted stocks, have no price chart.
All dividends and stock dividends, and the dividend calendar (at the bottom of the "Instruments" page) — twelve months of the year, showing which instruments pay in each month, with this month highlighted.
Upcoming ex-dividend: Taiwan holdings going ex-dividend or ex-rights in the next 30 days are listed on "Dashboard" and above the dividend calendar, with the ex-date, the last buy date (the business day before the ex-date — you get the dividend only if you still hold at that day's close), cash and stock dividend per share, and the estimated amount and shares based on what you hold now. The data comes from the TWSE and TPEx ex-rights/ex-dividend forecast (fetched once a day while the program is open); actual amounts follow the company announcement, and you record the dividend from Corporate action reminders once it is paid, as usual. Nothing is shown when nothing is coming up.
Below it, Declared, not yet ex-dividend lists dividends in the TWSE listed-company dividend distribution data that the board or shareholders have passed but that are not yet in the forecast (and not recorded), with the period, board date, status, cash and stock dividend per share and the estimate from your current holdings — usually months before the forecast. Listed companies only (no ETFs or TPEx stocks), passed within the last 270 days; for quarterly payers each ex-dividend clears the earliest one. Stock details also show Declared dividends above the dividends, with the latest distributions of that stock. This data is also fetched once a day while the program is open and starts from the day collection began.
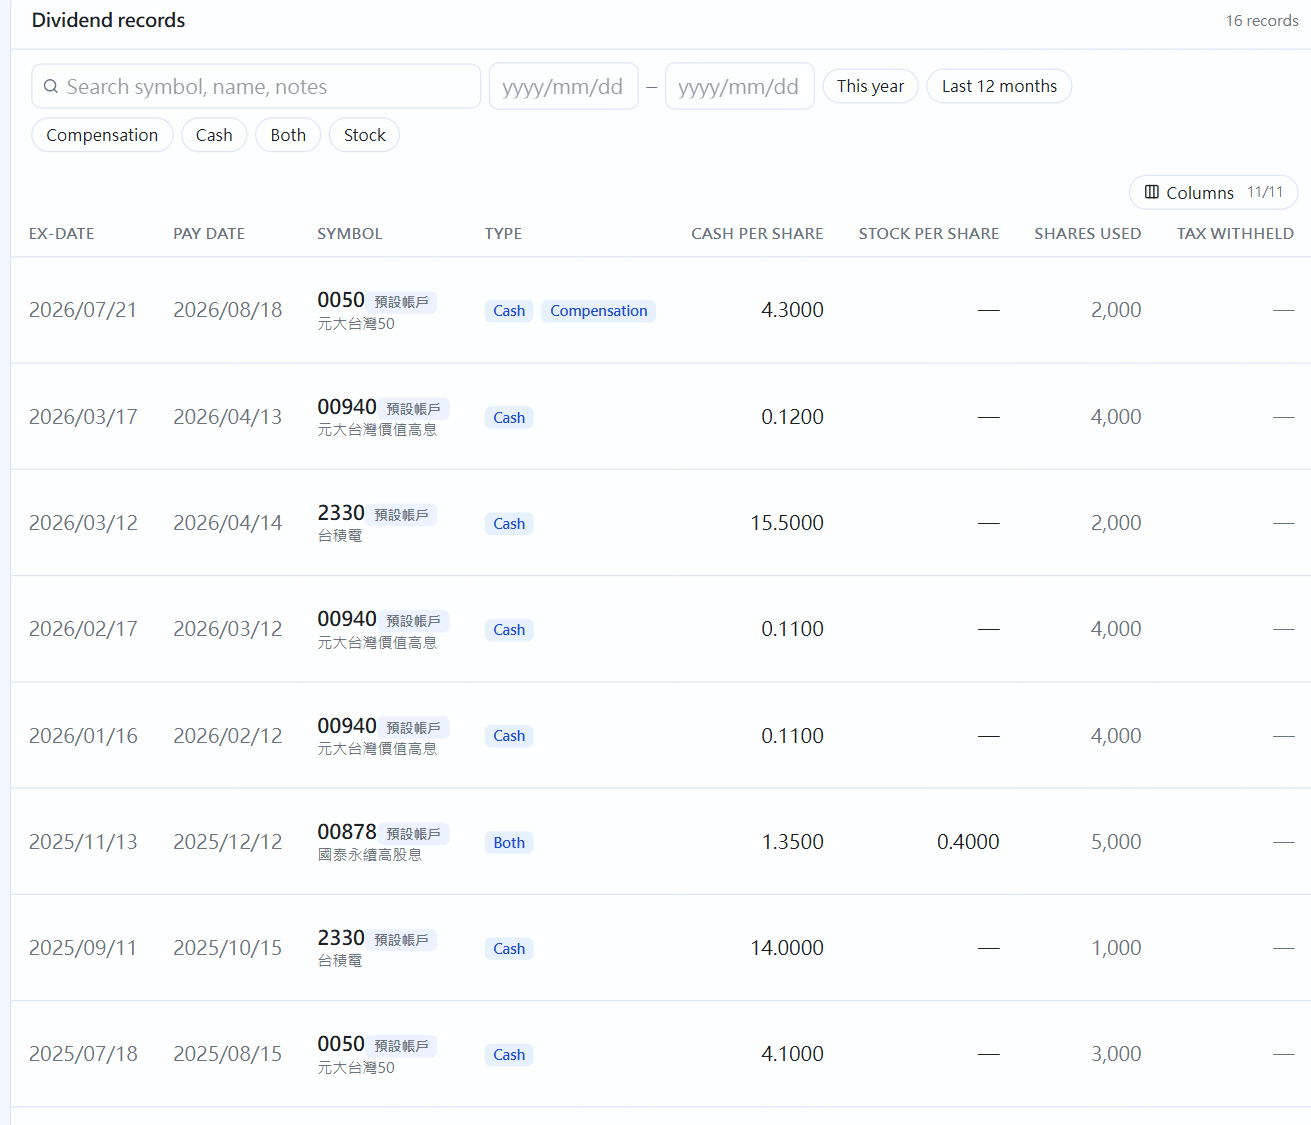
Dividend records(click the image to enlarge)
"Market → Exchange rates". The row at the top ticks the currencies you want to see (15 of them, including US dollar, yen, Hong Kong dollar, euro and yuan), one card per currency: how many TWD 1 unit of foreign currency equals, how much it moved from the previous day, the data date and the source. The top right can switch to "1 TWD = ? foreign", and the cards and changes turn the other way round. Click a card and the trend of that currency is drawn below (3 months, 1 year, 3 years, all). The two dropdowns beside the trend chart's title can switch to any two currencies (for example 1 USD = how many yen), with the button between them swapping them; between two foreign currencies the rate is worked out from each one's rate against TWD (a cross rate), which can differ a little from a price a bank quotes directly.
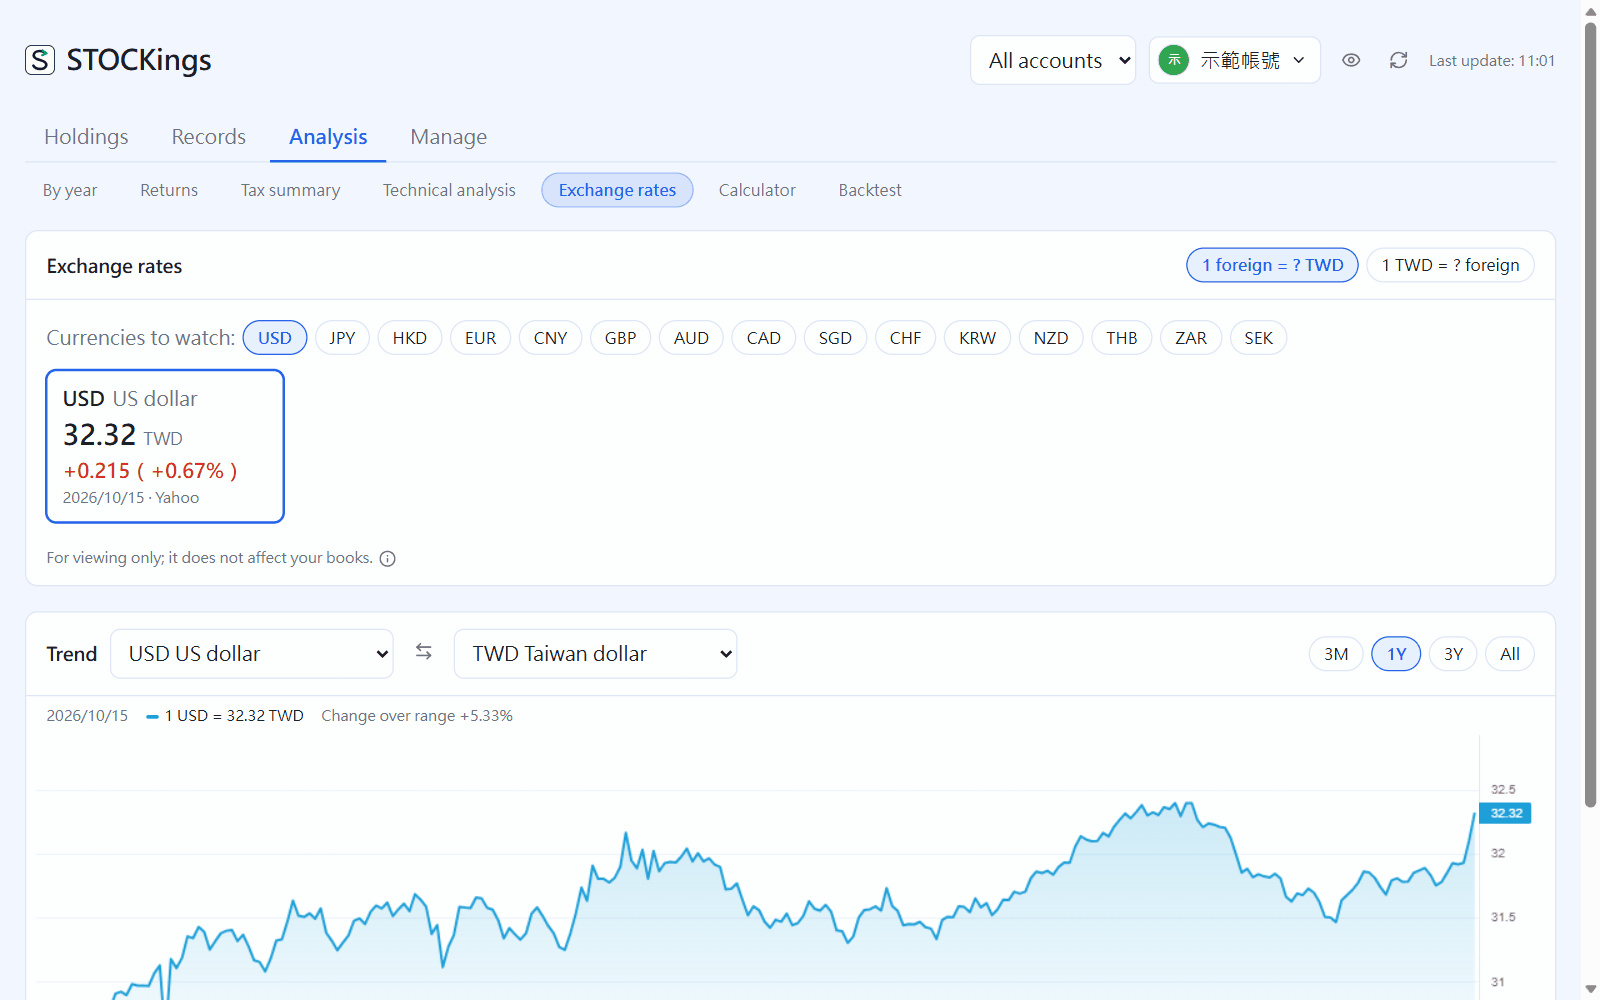
Market → Exchange rates(click the image to enlarge)
The ticked currencies are kept in this computer's browser settings. This page is for viewing only and does not affect the books; a cash account can be opened in any of these foreign currencies, while for stocks only US stocks are in dollars for now. Exchange rates are each day's closing reference prices, not a bank's buying and selling prices. In commercial mode the trend uses official data: the US dollar uses the central bank's rate, yuan, euro, yen, pound, Australian dollar, Hong Kong dollar, South African rand and New Zealand dollar use TAIFEX's daily foreign-currency reference rates (only the last month, accumulating on this computer daily afterwards), and other currencies and earlier history are converted to TWD with the European Central Bank's reference rates (from 2008). The "today's rate" used for valuation takes the latest of ExchangeRate-API and the official data; for hourly updates, enter your own Open Exchange Rates app_id under "Settings → Data sources" (the free plan is for personal use only).
Nothing is recorded; it is purely a calculation for you. Enter the shares, the buy price and the sell price, and it immediately works out the fees, transaction tax, break-even and net profit.
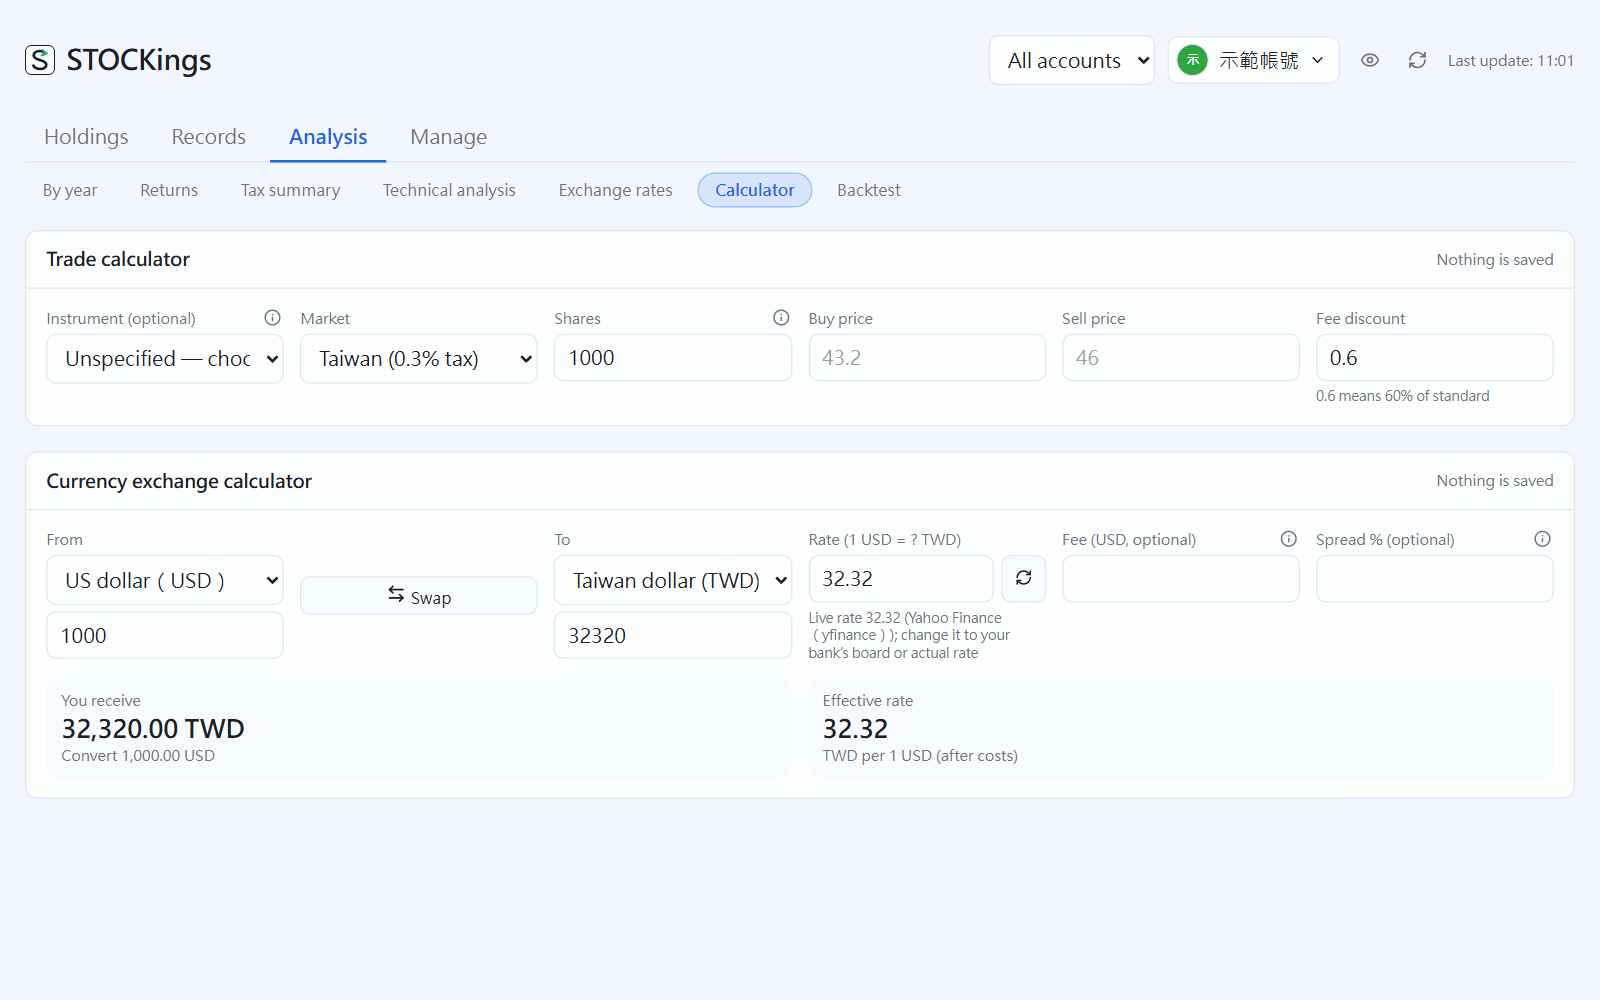
Market → Calculator(click the image to enlarge)
Good for judging "is this trade worth it" before you place the order.
Below the calculator, "More calculators" has five more. Nothing is recorded here either, and results update as you type:
- Average down: pick a holding to fill in its shares, total cost (fees included) and current price, then enter the shares and price to add. You get the average cost, break-even price and shares after adding, and the weight in the whole portfolio's market value. You can also skip the holding and type the numbers in
- Target & stop: enter the entry price, shares and a target (a % of cost or an amount; negative is the loss you accept at a stop) to see where to sell and the net result after fees and transaction tax. Add a stop price and "most you will lose" to see the most shares you can buy (whole lots too for Taiwan stocks)
- Dividend tax: enter the amount per payment and the payments a year, or press "Use this year's dividends" to take the Taiwan dividends from the tax report. Pick your marginal rate to compare taxing with income (8.5% credit, capped at NT$80,000 per household) against taxing separately (28%), plus the NHI supplementary premium (2.11% on single payments of NT$20,000 or more). Taxing with income uses the marginal rate, so very large dividends that cross a bracket will differ
- Regular investing: monthly amount, starting amount, yearly return and years give the final value, the amount put in, the return and a year-by-year table (invested at each month end, compounded monthly); a target amount works out the monthly amount needed
- Retirement: current age, retirement age, life expectancy, money saved so far, monthly saving and the returns before and after retiring give what you will have at retirement and how much you can draw each month (lasting exactly to your life expectancy), with a chart of assets by age. Enter monthly spending in retirement to see whether it is enough, at what age it runs out if not, and how much to save each month to make it last; with inflation every amount is in today's money. It is a fixed-return estimate with no tax or trading costs
- US stocks via broker: shares, buy and sell prices (US$), separate buy and sell exchange rates, the broker fee rate and minimum, dividends per share while held and the withholding rate (30% by default) give the NT$ cost, amount back and gain or loss (split into price and FX), and the fees, SEC fee and withholding in total
First go to "Settings → Trading and reports → Investment scope" and tick Funds, and the market list for a new instrument gains "Fund":
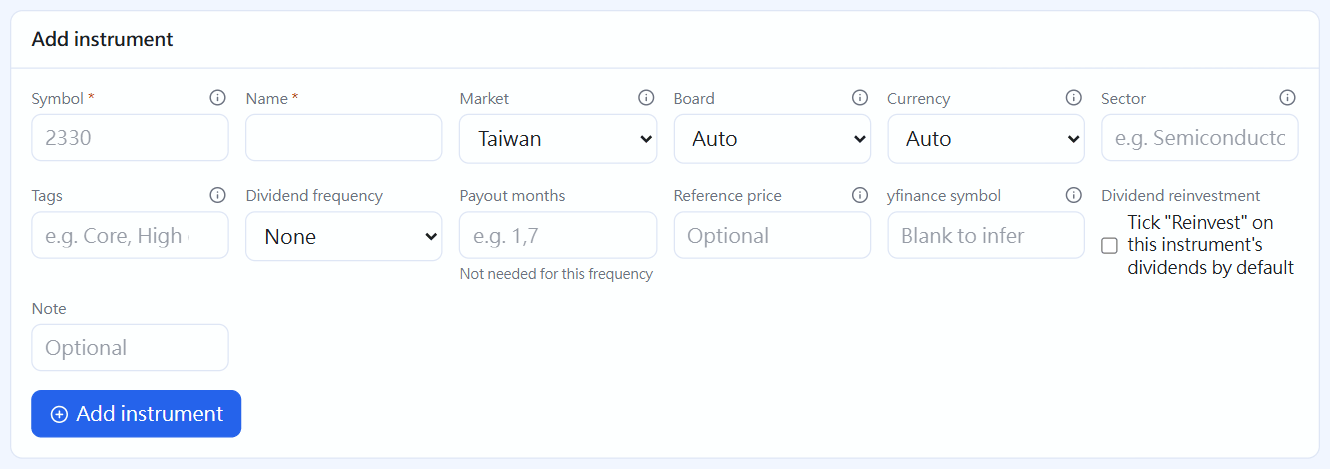
Choosing "Fund" as the market: Find a fund and the fee rates appear(click the image to enlarge)
- Symbol: the fund code. For domestic funds enter the beneficiary certificate code (or the fund's business ID), for offshore funds enter the fund code or ISIN (you can also put it in the "Fund code" field, keeping the symbol field for a short name you recognise)
- Find a fund: after choosing the market "Fund", there is a search box at the top; type the fund's name or code (for example "Allianz Taiwan"), pick one and the code, name and currency are filled in
- Currency: for a fund priced in a foreign currency choose that currency (15 foreign currencies), and later subscriptions need an exchange rate, as with US stocks
- Fee rates: enter the "Subscription fee rate" as actually charged after discount (for example 0.45), and it is used when a subscription has no fee entered; for back-end load (B shares) enter each year's rate in the "Back-end fee table" (for example 4,3,2,1: 4% under 1 year, 3% for 1 to 2 years … 0 from 4 years), and a redemption with no fee entered is worked out automatically from the years each lot has been held
- NAV: where open data is available the latest day is filled in automatically (domestic: the daily NAV of the Securities Investment Trust & Consulting Association; offshore: TDCC's offshore fund NAV). Open data has no history, so the program saves one each day, accumulating from the day you start using it. Private placements and platform-exclusive classes cannot be fetched; enter the NAV and NAV date from the statement
- Subscription / redemption: record them in Trades like ordinary buys and sells, with units that can be decimals; enter the subscription fee and redemption fee from the statement in the fee field, with no securities transaction tax. A fund switch is one redemption plus one subscription
- Dividends: distributing funds are recorded as ordinary dividends; for those ticked "Reinvest", a subscription is pre-filled when the pay date arrives, and entering the actual NAV works out the units from the amount
- Account overview: a fund's market value is counted in the "Funds" row; those bought in a trust account are counted in "Trust holdings"
The NAV data is used under the Government Open Data License: the Securities Investment Trust & Consulting Association's "Daily NAV of securities investment trust funds" and TDCC's "Offshore fund NAV" (data.gov.tw datasets 11109 and 11641). The "Data sources" on the Settings page also lists the sources and licences.
First go to "Settings → Trading and reports → Investment scope" and tick Bonds, and you can then choose "Bond" when adding an instrument:
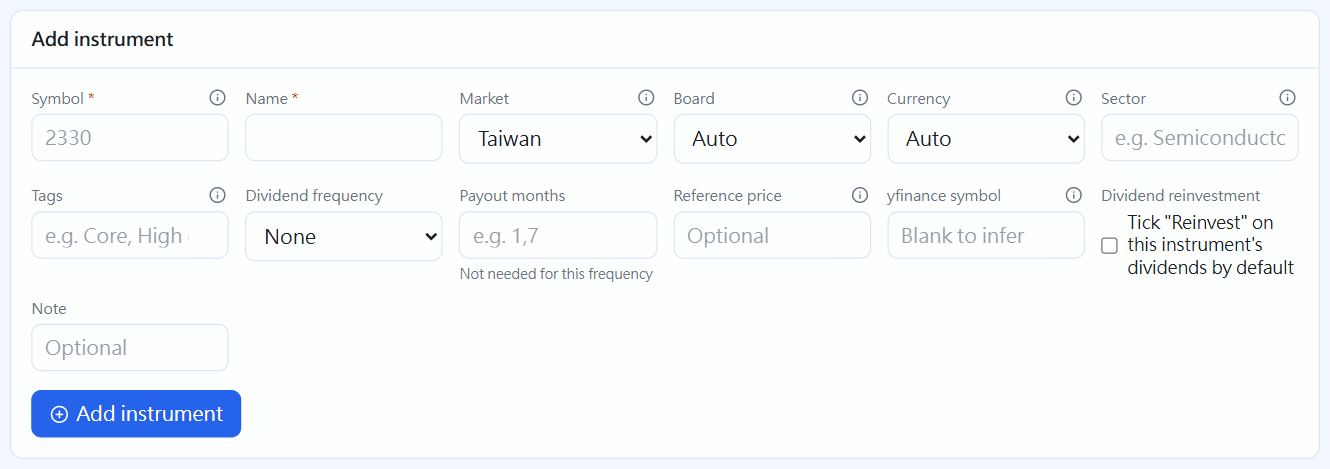
Choosing "Bond" as the market: coupon rate, payments per year, maturity date(click the image to enlarge)
- Instrument data: coupon rate (% per year), how many times a year interest is paid, and the maturity date; for foreign-currency bonds choose the currency; for convertible bonds also enter the conversion price
- Buying and selling: the quantity field is face value (for example 10,000 for a US Treasury, 100,000 for one convertible bond), and the price is quoted per 100 of face value (for example 98.75). Accrued interest (paid to the seller when buying, collected from the buyer when selling) is entered separately and recorded as a separate interest entry, not counted in cost. After you enter face value and date, the form works out a reference value from the coupon dates, and "Use it" fills it in (the statement is what counts)
- Coupons: record them in Dividend records like ordinary dividends, entering the interest "per 100 of face value" as the cash per share (coupon rate ÷ payments per year, for example 4.5% a year paid twice is 2.25). A bond's dividend is recorded as interest, not a dividend
- Coupon reminders and maturity: when a coupon date arrives, the pending list of "Records → Regular investing" is pre-filled with a "Bond coupon" (face value held that day × interest per period), and confirming records it as interest; after the maturity date it is pre-filled with "Maturity" (selling the whole face value at 100), and confirming records it as a sale
- Convertible bond conversion: "Convertible bond conversion" below "Manage → Instruments": choose the convertible bond, enter the face value converted and choose the stock to convert to (the conversion price defaults to the one in the instrument data). Shares = face value ÷ conversion price rounded down, with less than one share refunded in cash; the bond moves out at original cost with no profit arising, and the cost carries over to the stock
- Price: enter the latest quote in the instrument data; if you do not, it amortizes from cost to 100 at maturity. Positions lists yield to maturity (at the current price and at average cost). Taiwan convertible bonds have no quote that can be fetched automatically, so Positions also lists the conversion value (100 × the underlying stock's current price ÷ conversion price) as a reference
- Tax summary: an extra "Interest" block (coupons less accrued interest). TWD bonds are domestic interest income; the interest of foreign-currency bonds counts toward overseas income (alternative minimum tax)
For Taiwan call and put warrants (including bull/bear certificates), choose Taiwan stock as the market and "Warrant" as the type when adding the instrument (when the code looks like a warrant, the form asks whether to record it as one):
-
Instrument data: underlying stock symbol, call or put, exercise ratio (shares of the underlying per unit, e.g. 0.05), strike price, expiry date, and settlement (cash or physical delivery). After entering the code, press Fill from code to fill call/put, underlying, the latest strike and exercise ratio and the expiry (exercise end date) from the TWSE and TPEx warrant basics; the last trading day is shown too. Only warrants listed now can be found, settlement is filled only when it is certainly cash, and you should check before saving
-
Buying and selling: recorded like stocks, first-in-first-out within the same securities account. Fees are the same as stocks (broker discount applies, minimum NT$20 for a board lot), the sale carries 0.1% securities transaction tax, and day trades are not halved. No margin, short sale or securities lending. Positions, returns, realised profit and the tax summary treat them like stocks (gains on warrants are securities transaction income, currently not taxed, the same as stocks)
-
Price: used when the quote source has one (the same as stocks); otherwise enter a reference price in the instrument data. Quotes are no longer fetched after the last trading day (2 trading days before expiry)
-
Expiry settlement: in the "Mergers, spin-offs, tender offers, warrant expiry" area below "Instruments", choose Warrant expiry, pick the warrant and enter the underlying settlement price (the average trade price in the last 60 minutes before the close on expiry day, 30 minutes for index warrants; the app cannot fetch it, so take it from the broker notice or the issuer announcement). The exercise value per unit is worked out from the strike and exercise ratio: call = (settlement price − strike) × ratio, put = (strike − settlement price) × ratio, never below 0. Without a settlement price you can enter the settlement amount per unit directly; both blank means 0 (expired out of the money). Leave the date empty to use the expiry date in the instrument data; each securities account still holding it gets one sale, and 0 turns the whole cost into a realised loss. Costs follow the issuer formula; change them if the notice differs:
- Transaction tax: cash settlement = settlement amount × 0.1%; none for physical delivery (the "Transaction tax" menu can force it on or off)
- Fee: when blank, cash settlement uses the settlement amount × 0.1425% (the TWSE rule: based on the difference between the underlying settlement price and the strike, so it never exceeds what you get back); physical delivery uses the strike × units × exercise ratio × 0.1425% (0 if the warrant has no strike or ratio, and the form asks you to fill them in). No broker discount; you can change it to match the broker’s notice. A fee you type is the total: when several brokerage accounts hold the warrant it is split by units (the remainder goes to the last account)
- Paid on: blank means the 2nd business day after expiry (when the issuer pays; the cash ledger records it on that day), and you can change it to match the broker’s notice; the gain or loss still counts on the expiry date
- Out of the money (0 per unit): no fee, no tax
For a physically delivered warrant, record the stock you receive as a separate purchase
-
Terms adjustment reminder: after the underlying goes ex-dividend the issuer adjusts the strike and exercise ratio. While the program is open it saves the official data for warrants held and not yet expired once a day; when it differs from what you entered, Data health lists it under "Warrant strike, ratio or expiry differs from the official data". Edit the warrant, press Fill from code and save so expiry settlement uses the latest terms
-
Expiry reminder: from the expiry date on, warrants still held are listed in Data health under "Expired warrants still held", and disappear once the expiry settlement is recorded
When you create an account you can tick the markets you operate in (Taiwan stocks, US stocks, funds, bonds, futures and options — all ticked by default), and change it later under "Settings → Trading and reports → Investment scope". It governs only the "entrance": for a market that is not ticked you cannot add instruments, and the tabs and features that only concern it are tucked away:
| Not ticked | Tucked away |
|---|---|
| Taiwan stocks | The IPO subscriptions, pledges, securities lending and live quotes tabs; the chips, disposition and attention, announcements, screener, movers and market pulse panels on the Market page; broker file and TDCC imports on the Data page |
| US stocks | The switch for dollar reports; the Tiingo key and SEC contact in Settings |
| Funds, bonds | Cannot be chosen when adding an instrument |
| Futures and options | The Futures tab |
Things both markets use — employee stock, cash accounts, exchange rates, reports — are not affected.
Turning off a market you still hold is not blocked and does not hide the holdings: it first lists the stocks, foreign-currency cash and open futures you still hold for you to confirm, and those holdings and records still show and still count in total assets (otherwise total assets would be wrong); only that market no longer appears when adding. After they are sold, that market's items disappear completely.
Below the Calculator, again nothing is recorded. Choose the currency you are converting from and to (TWD and the 15 foreign currencies on the Exchange rates page, with conversion between foreign currencies going through TWD), either amount can be entered, and whichever you change the other is worked out from it; ⇄ swaps direction.
- Rate: the default is the live rate (the source is noted below), which you can change to a bank's quoted rate or an actual deal price; the button beside it returns to the live rate
- Fee (in the currency being converted from, deducted first) and Spread % (which makes the actual rate worse) can be left empty
- The result lists how much you actually get and the actual rate, and when a cost is entered it also lists the cost of the exchange
- For currencies with no live rate available (a notice below says so), enter the rate yourself
"Market → Backtest": what would have happened if you had bought this way back then. It only calculates and records nothing.
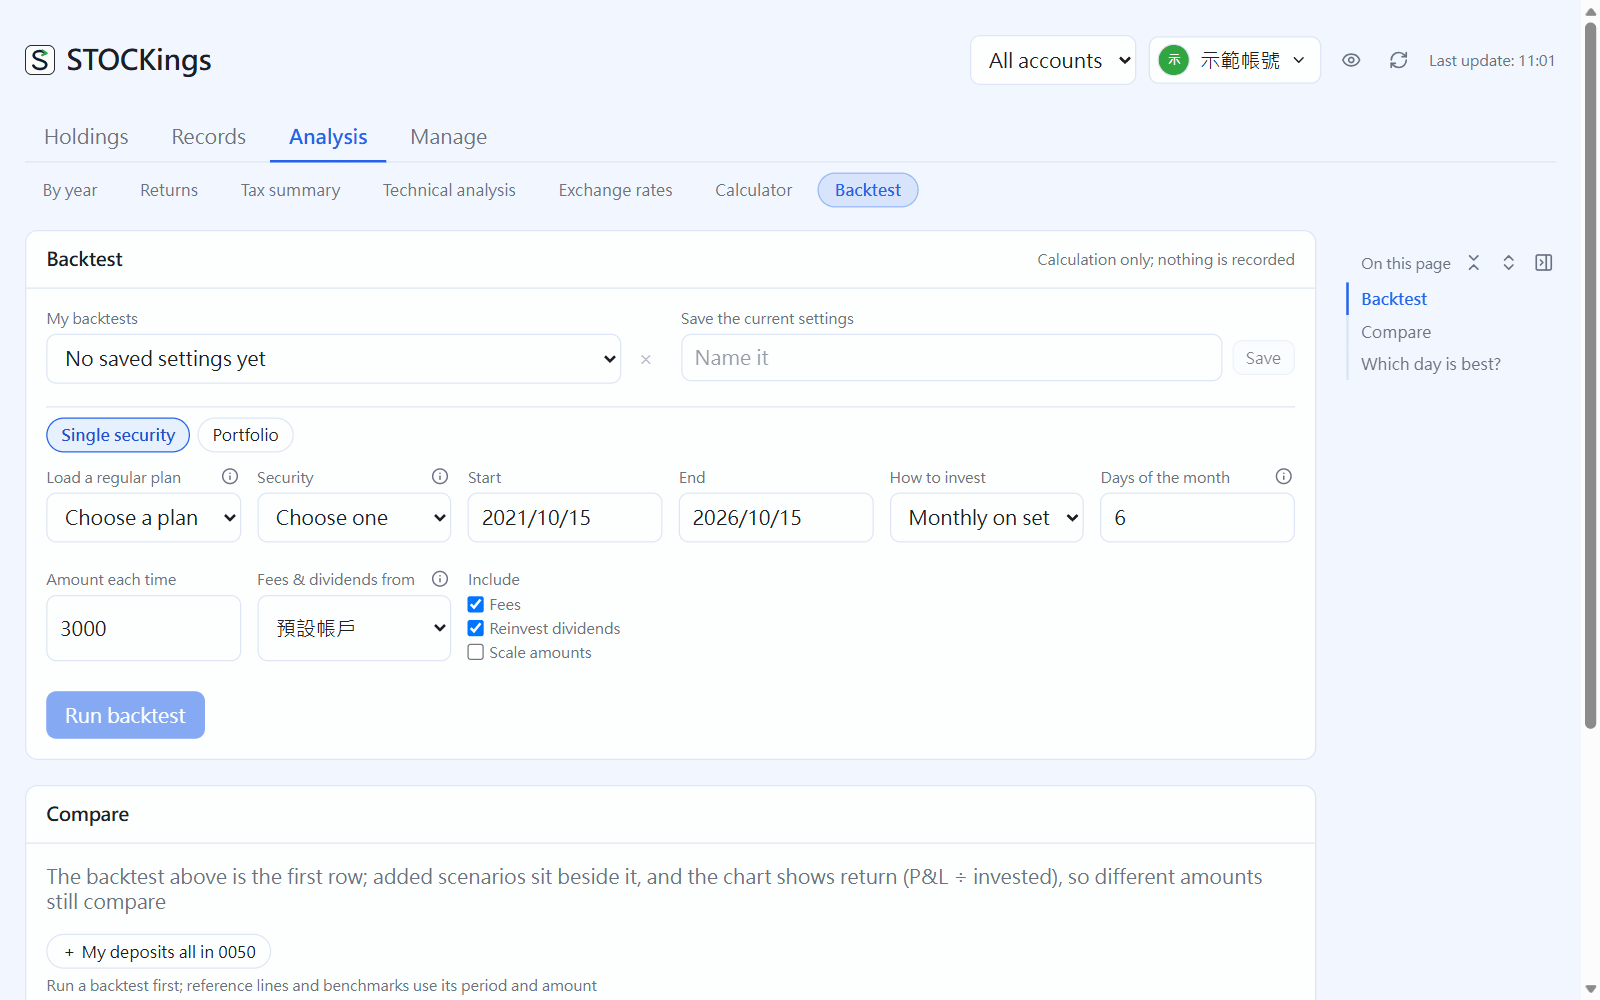
Market → Backtest(click the image to enlarge)
- Choose the instrument (Taiwan or US stock; add what you want to backtest under "Instruments" first), and the start and end dates
- Choose how to invest: a fixed day of the month (several allowed, for example 6, 16, 26), weekly, every two weeks, every trading day, a single lump sum (at the start), or specific dates. When the market is closed it moves to the next trading day; only one buy per day
- Enter the amount each time. For US stocks you can choose to pay in TWD (converted to dollars at each debit day's rate) or in dollars
- With several securities accounts, choose whose fee discount, dividend fee, NHI premium and withholding settings to follow; "Fees" and "Reinvest dividends" can be switched off
- Buying works like regular investing: whole shares for Taiwan stocks (fee included, not exceeding the amount), fractional shares by amount for US stocks; always at that day's closing price
- Prices are the actual traded prices, and dividends are worked out separately from the ex-rights/dividend data (only shares held at the close the day before the ex-date receive it); on a split day the shares change accordingly
- Reinvested dividends buy at the closing price on the pay date, and the fraction of a share that cannot be bought is kept for next time; without reinvestment it stays as cash and counts in the end value
- The result has end value, principal invested, profit, total return, annualized return (XIRR), maximum drawdown and annualized volatility; drawdown is worked out time-weighted, excluding newly invested money, so you can see whether you could have held on during falls. For US stocks the result in the other currency is also listed, showing the effect of the exchange rate
- The detail lists every buy, dividend, reinvestment and split, and can be exported to Excel
- US data has no dividend pay date, so dividends are credited on the ex-date; only instruments whose prices can still be found today can be backtested (survivorship bias)
- When you have a regular investing plan, "Load a regular plan" at the top fills in the instrument, debit days, amount and start date
Trade on signals (choose "Trade on signals" as the way to invest): one lump of principal, buying everything on a buy signal and selling everything on a sell signal. Signals can be close above / below a moving average (you enter the days), KD golden / death cross (optionally only crosses at low or high levels), RSI crossing below / above a threshold, MACD golden / death cross. Signals are judged on that day's close and traded at the close one trading day later (no peeking at the future); money held while out of the market earns no interest, and dividends received in the meantime stay as cash until the next buy. The result adds the number of trades and whether the last day is holding or out of the market, and the comparison area can add "Buy and hold" with one click.
Scale amounts (tick "Scale amounts" for regular investing): look at whether the previous trading day's close is below or above a moving average (or RSI below or above a threshold) and multiply that period's amount by a factor, for example twice as much when below the 60-day average and as usual when above; a factor of 0 skips that debit. The comparison area can add "Without scaling" with one click.
Portfolio (switch to "Portfolio" at the top): choose 2 to 5 instruments (your own, or 0050, VOO and the return indexes without adding them first) and proportions (totalling 100%), and a lump sum or regular investing is split among them by those proportions. Taiwan and US holidays differ, so if one instrument is closed that day it moves to its next trading day. Rebalancing can be every year, every quarter, when the drift exceeds some percentage points, or none: first sell what is above its proportion and then use the proceeds to buy what is below, with sales taking the actual fees and transaction tax. The result adds each instrument's set proportion, final proportion, market value and shares, and the number of rebalances and the cost of sales; the comparison area can add "No rebalancing" and the market with one click.
My backtests (at the top of the form): give the current settings a name and save them; next time open it from "My backtests" and the settings are filled back into the form and recalculated with the latest prices (only the settings are saved, not the results; when the end date is today, opening it counts up to that day's today). Same names ask whether to overwrite, and you can delete the ones you do not want. Saved settings are also in "Import / Export" ("Backtest scenarios", with instruments by symbol), and travel with you when you change computers or hand them to someone; securities accounts do not go along, and the default is used.
Compare: the backtest you run above is always the first row of the comparison table (marked "Current backtest") and changes when you change the settings and run again; the scenarios you add sit beside it in the same table and the same return chart (differing invested amounts can still be compared). To keep this result and then change the settings to compare (for example the 6th and the 16th), click "Keep this result" at the top right of the result, up to 5. The reference lines and the market follow the backtest above: when you change the settings and run again they are recalculated with the new settings; only those kept with "Keep this result" keep their original settings. You can also add with one click:
- Reference line: lowest / highest point of each month — each month invests the same money, always buying on the day with the month's lowest (highest) close. This is known only afterwards and is not a strategy you could follow; it shows at most how much "luck in the buying point" can differ
-
Market — the same period, way of investing and amount switched to the market (no need to add it as an instrument first), according to the instrument's market:
- Taiwan stocks: buying 0050 the same way (Yuanta Taiwan 50, the 50 largest by market value in Taiwan), compared with the TAIEX total return index (listed, dividends included, since 2003) and the TPEx total return index (OTC, dividends included, since 2006). An index cannot be bought, so it is treated as a reference line: no fees, and decimal units are allowed
- US stocks: buying VOO the same way (Vanguard S&P 500 ETF, the 500 largest by market value in the US)
- Only when the investment scope has both Taiwan and US is there an extra "buy the other market's index instead": a Taiwan backtest can see what buying VOO would have done (including exchange rate), and a US backtest (paying in TWD) can see what buying 0050 would have done
- My trading vs. all in 0050 — shows whether your own picks and trades beat simply buying the market. It is not a fixed monthly amount: it buys 0050 on the days and amounts you really deposited (selling when you withdrew) and does nothing else; the table calls it "0050 (bought with my real deposits)". A last row, "My actual records", shows what the same money made with your own trading to date (the whole ledger, all broker accounts). Both put in almost the same money (the gap is fees and leftovers too small for one share), so the gap in return and XIRR is how your trading compares with buying the market. They put in different amounts at different times from the first-row monthly plan, so end values do not compare directly; to compare "the same monthly amount in a different fund", use the market benchmarks above
Which day is best to debit: the same instrument, period and amount run once for each day 1 to 31 of the month (or each Monday to Friday), listing the best, worst, average and median, with how much each day is above or below the average drawn as bars. The differences are usually small (a few tenths of a percentage point) and reflect luck in that period; a different period may give a different result.
"Analysis → Tax summary": choose the income year (what you file in May is last year's income). It is organized by the categories of the comprehensive income tax return, not split by securities account:
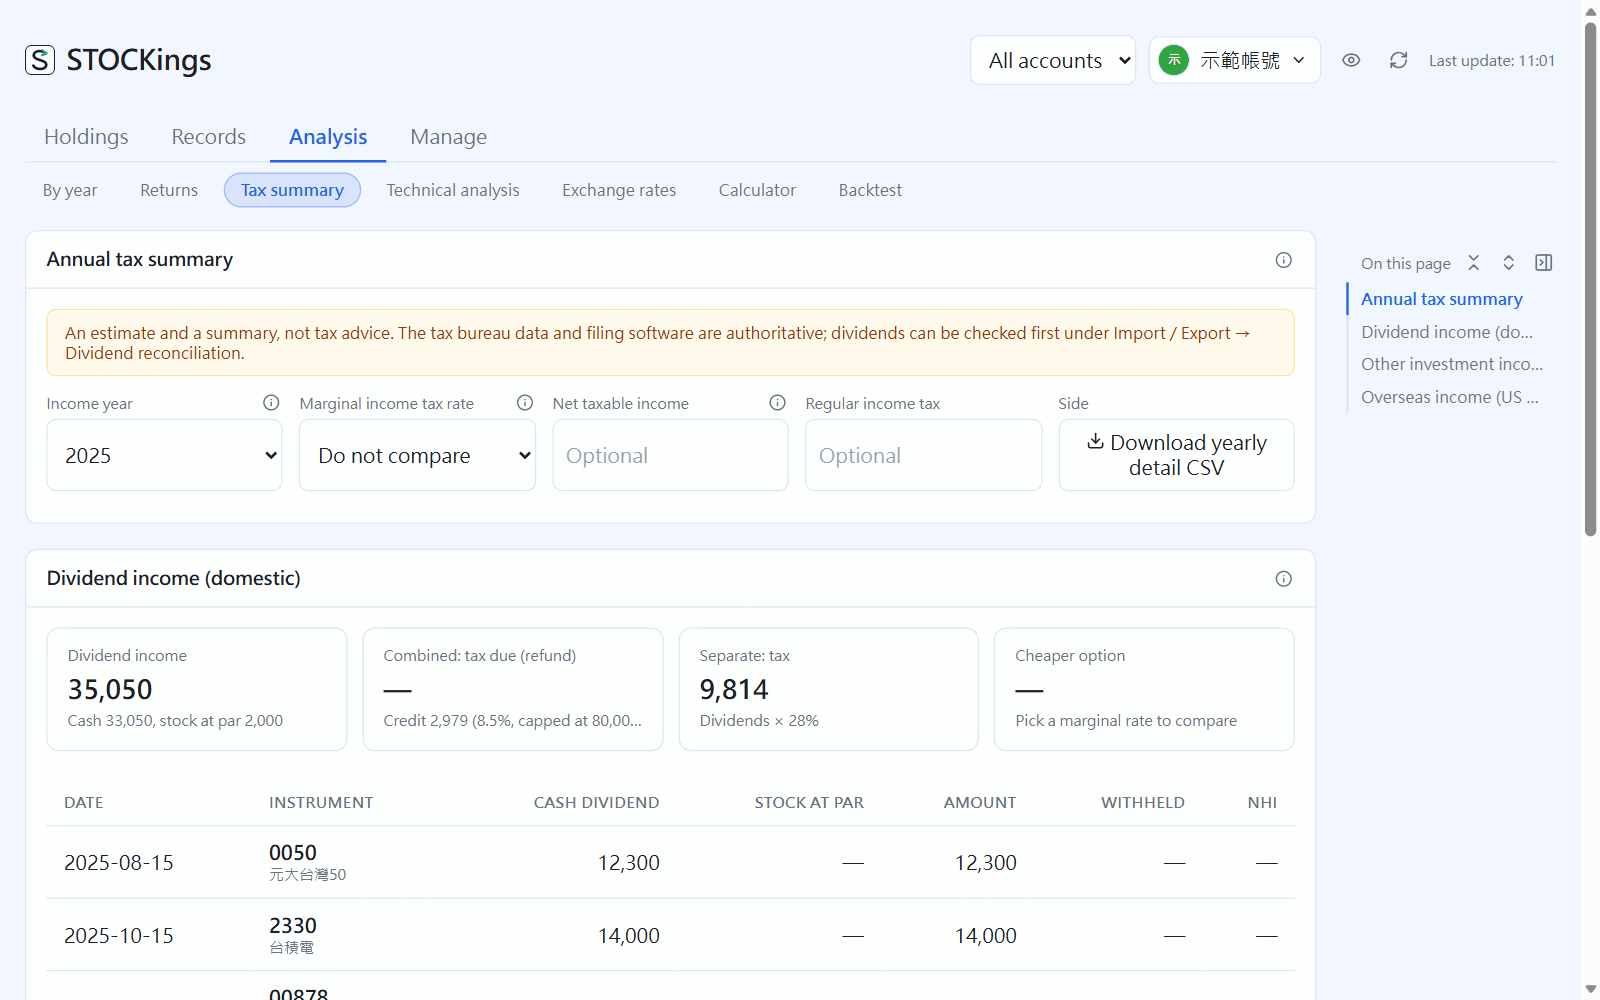
Analysis → Tax summary(click the image to enlarge)
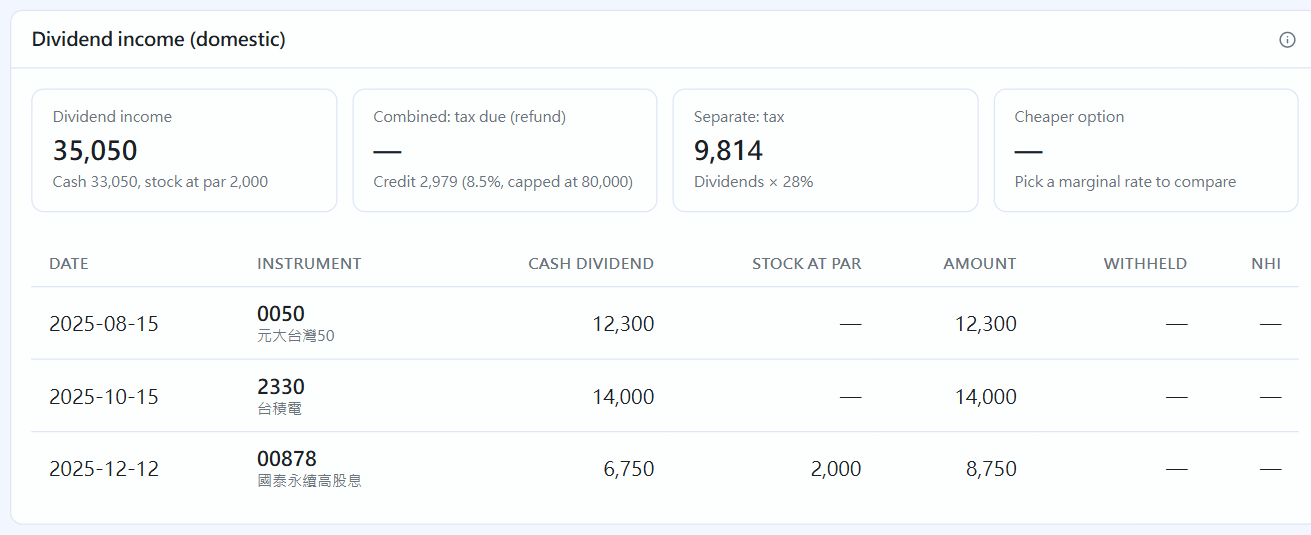
Dividend income (domestic): each cash dividend, the face value of stock dividends, tax withheld and NHI premium(click the image to enlarge)
- Dividend income: domestic cash dividends plus stock dividends at face value. If you choose a marginal tax rate, it compares combined taxation (dividends added to income, with an 8.5% credit capped at 80,000 per household) and separate taxation (28%) to see which is better
- NHI supplementary premium: 2.11% is deducted on dividends, lending income and the interest-income part of dividends when a single payment reaches 20,000; the company usually already withholds it, and it is listed here for reconciliation; the tax-free part of a dividend does not count
- Lending income (rental income), compensation (other income); realised profit on Taiwan stocks — the securities transaction income tax is suspended, so it is listed for reference only
- Overseas income: realised profit on US stocks (TWD received − TWD paid when bought, gains and losses in the same year offsetting) and US dividends. It enters the alternative-minimum-tax basic income only when it reaches 1 million in a year; enter your net comprehensive income (and ordinary income tax) to estimate whether you must pay more
- Deposit interest: savings interest recorded in a cash account (bank savings, CMA) is interest income, added to comprehensive income, and each entry and the total are listed here. Interest on deposits with financial institutions gets a special savings-and-investment deduction of 270,000 per filing household per year (Ministry of Finance tax portal, ROC year 114); it is a cap on the interest of your whole household's deposits, and interest at other banks cannot be seen here, so "deductible" is only an estimate from the records. Whether a broker CMA's interest counts as financial-institution deposit interest and whether tax is withheld, follow the tax bureau
- Download yearly detail CSV: each entry lists the date, instrument, amount and tax withheld
This is an estimate and a tidy-up, not tax advice; the tax bureau's income data and filing software are what actually count. You can first check dividends against the Ministry of Finance's income data under "Import / Export → Dividend reconciliation".
← Foreign currency: how US stocks are counted | Contents | Glossary →