Repository navigation
Activity Monitor
Tools ▸ Activity Monitor opens one panel of tabs over the server's own live state — the same family of views SSMS's Activity Monitor is, written for a terminal: a canvas that scrolls rather than a web browser pane that needs one.
The three screenshots below predate today's tab names, so treat them as a rough guide to the layout rather than as current captures — the tabs they show are the ones still there.
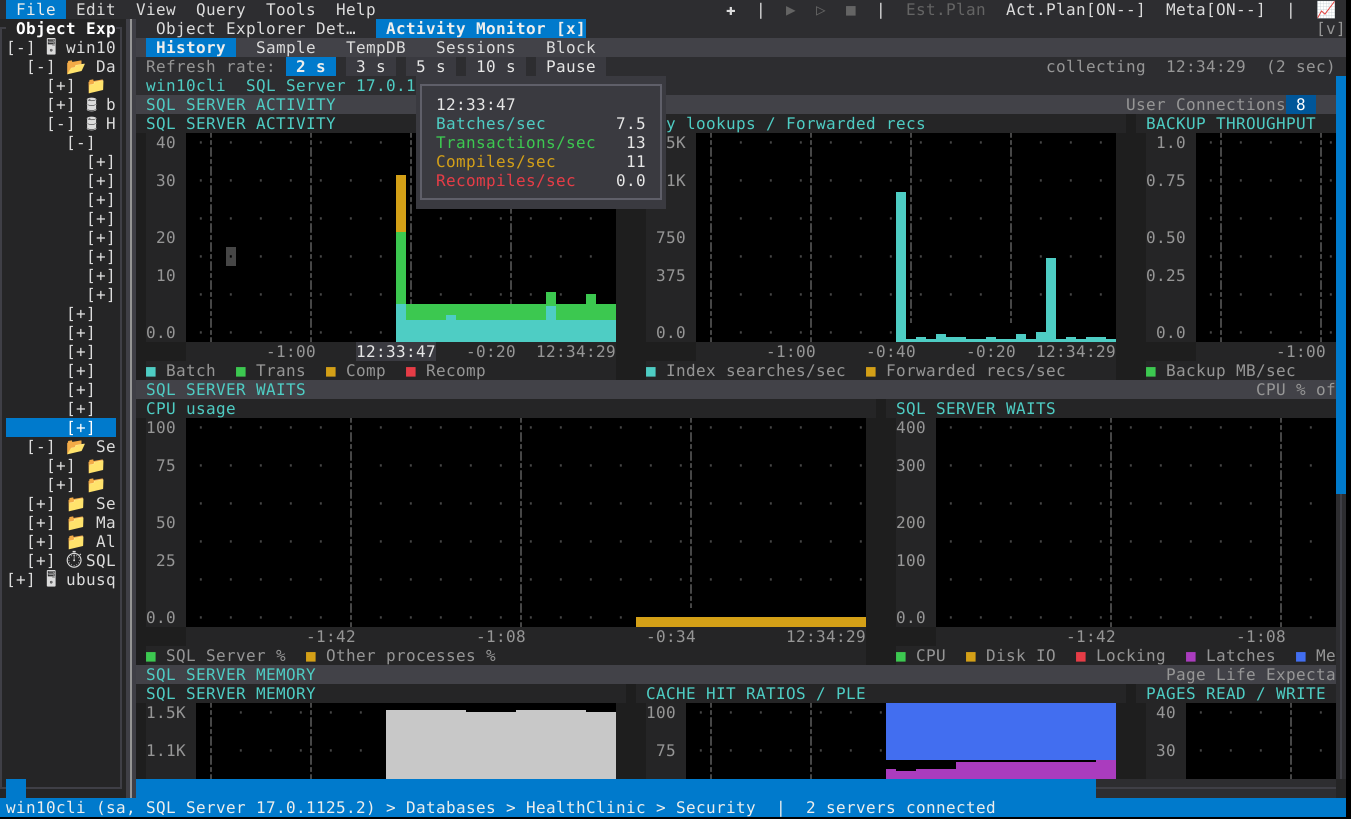
History: the rolling view, with the metric panels above it.
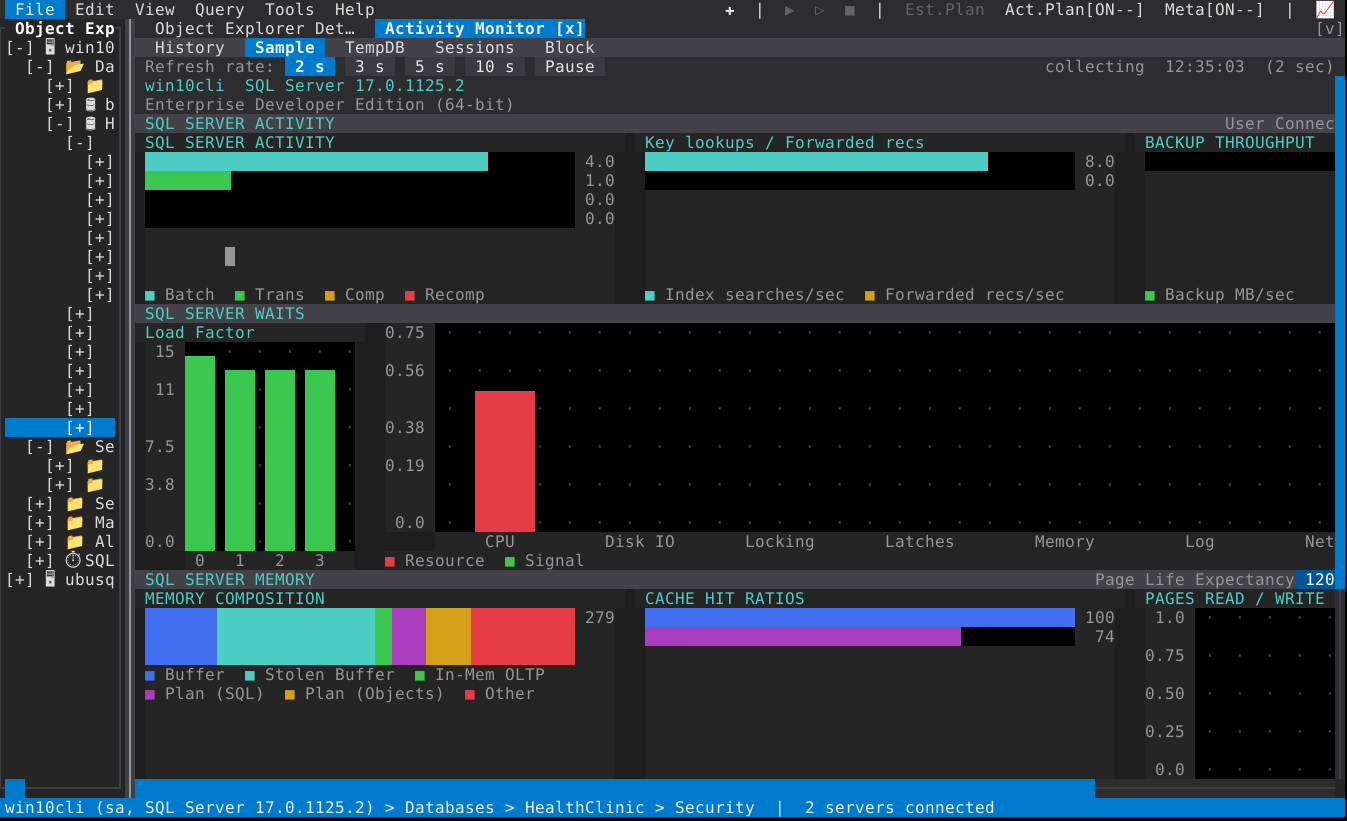
Sample: the single-moment view, one panel per counter.
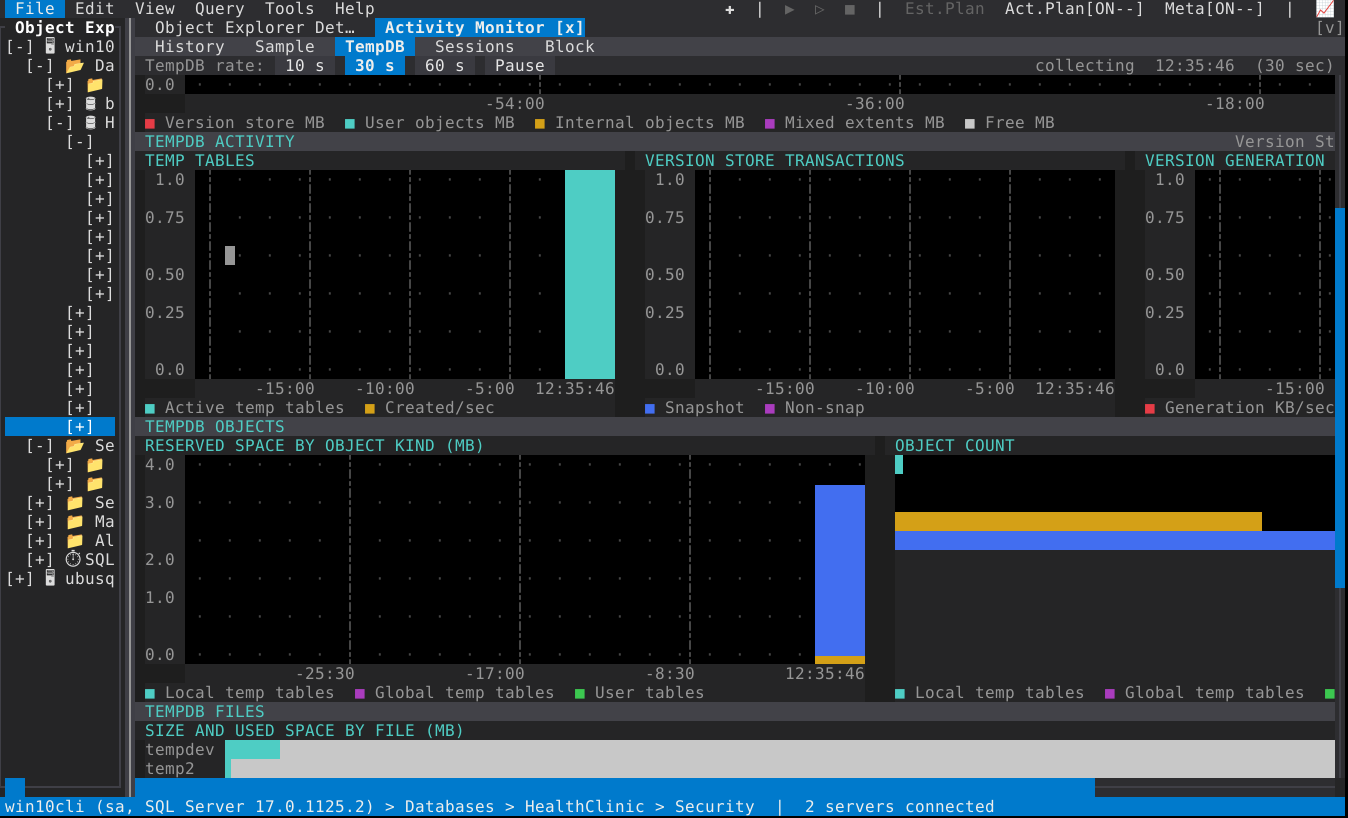
TempDB: space and the sessions holding it.
| History | The rolling view: activity over the window the panel has been collecting, with the metric panels that make a trend readable at a glance |
| Sample | The single-moment view — one panel per counter, drawn like a sampling monitor rather than as a list |
| TempDB | tempdb space: allocation and churn panels, and the sessions holding the most of it |
| Sessions | A live grid of requests, from the same sysprocesses/DMV reading SSMS's "Running Processes" is built on |
| Block | The blocking view: the same rows narrowed to the ones a lock is being held against |
| Instance |
Azure only. A Managed Instance's limits and usage, from sys.server_resource_stats, sys.dm_instance_resource_governance and sys.dm_os_job_object
|
Instance is withheld when the connection is not an Azure engine edition, because those
views do not exist elsewhere and a tab that could only error is not a tab. The Instance
feed is also not a sampler: the server already aggregates that history into 15-second
windows, so the panel reads history instead of differencing counter pairs.
Sessions and Block are grids; the other tabs are canvas tabs — a scrolling surface that paints panels rather than rows.
The tabs that sample do it on a feed: counter pairs read and differenced between ticks,
on an interval the panel chooses from 2 s (the default), 3 s, 5 s and 10 s. The rate is
a toolbar selector; + and - step it on a canvas tab.
p pauses and resumes. Pausing stops the sampling rather than freezing a frame: the
screen holds and the server is no longer being asked, which is what you want from a panel
you left open on a busy box. r refreshes one read once, on the grid tabs.
| Tab / Shift+Tab | Cycle the tabs (the app takes Ctrl+Tab first, so plain Tab is free here) |
p |
Pause / resume the feed (canvas tabs) |
+ / -
|
Faster / slower refresh (canvas tabs) |
r |
Refresh once (the Sessions and Block grids) |
| Arrows | Scroll the canvas — left/right by a horizontal step |
| PgUp / PgDn | One page, with a row of overlap so a line is never read twice |
| Home / End | Top-left / bottom-right of the scrollable area |
| Grid keys | On Sessions and Block the grid answers first: arrows, PgUp/PgDn, Home/End, column panning, and its own right-click menu |
Keys the grid owns are the grid's: that is why p and r are letters, and why the refresh
and pause controls are also on the toolbar — a key a grid has already taken would silently
do nothing at the panel level.
The colours are semantics, resolved once so a metric keeps its colour across refreshes and
tabs: cyan for primary activity, green for transactions and CPU, yellow for waiting and
blocked work, red for I/O saturation and resource waits, purple for memory pressure and
deadlocks. A panel that is yellow is telling you about waits; a panel that is red is telling
you about a subsystem that cannot keep up. The same rule holds across the tabs — the colour
means the same thing in History as in Sample, which is why reading two tabs side by side
works.
Panels carry fixed scales where a scale is meaningful, and a lone auto-scaled bar is always drawn full — a bar that silently rescales against nothing makes every screenshot of it a different claim.
Sessions and Block rows carry the statement they are running, resolved per row from the plan cache or request DMV, and a tooltip on a row gives the whole text and the identifiers you would otherwise have to widen columns for. One bound guards the run: these reads cross-apply SQL text per row and can be slow on a busy server, so a run that has not finished is bounded rather than left to block the panel.
- Extended Events — when a two-second sample is not enough detail
- Execution plans — including Show Live Execution Plan on a running request
- Query Store — the history a live view cannot give you
- Resource Governor — the limits the Instance tab compares against