Repository navigation
Execution Plans
Estimated and actual plans, the three ways to read one, Live Query Statistics,
.sqlplan files, and Compare Showplan.
| Query ▸ Estimated Execution Plan | Compiles the batch and shows the optimiser's plan without running it |
| Query ▸ Actual Execution Plan (ON/OFF) | Runs the batch with SET STATISTICS XML on and shows what happened |
| Query ▸ Live Query Statistics (ON/OFF) | Executes into a live tab that follows the running statement (below) |
| Query ▸ Compare Showplan… | Pair this plan with another (bottom of the page) |
The same three toggles are buttons on the toolbar, and each carries its own state
in its label, so the menu reads Actual Execution Plan (ON). A run with plans on
puts the plan tabs beside the result tabs of the same run.
Needs SHOWPLAN for an estimated plan; an actual plan is the same statement
carrying its own XML, so it needs no extra right beyond running the query.
1 / 2 / 3     Plan graph / operator tree / raw XML
[  /  ]       Previous / next statement of the batch
m             Missing-index details, when the banner is showing
/  then n/N   Search operators, next / previous match
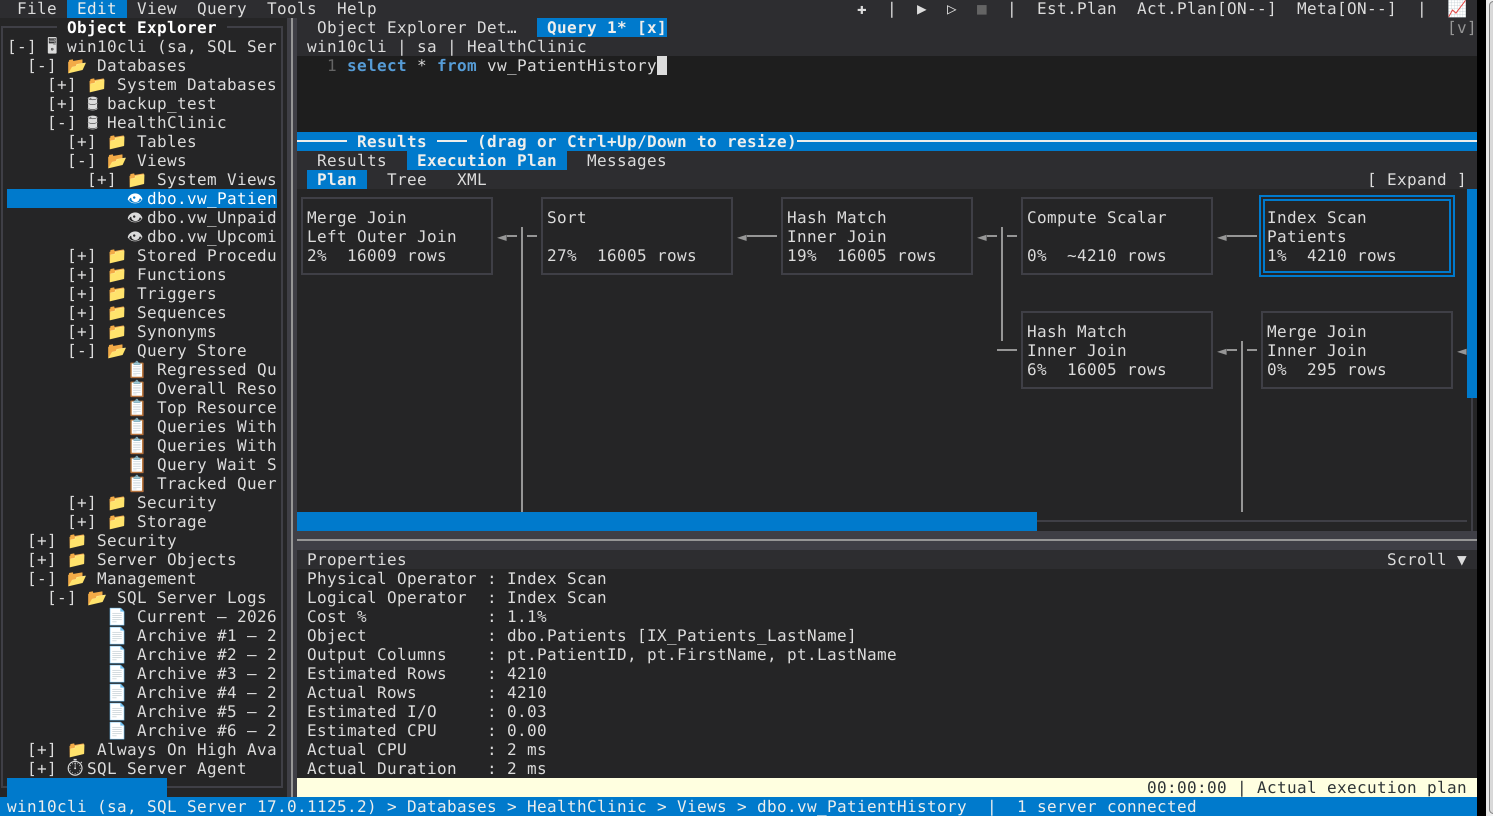
The visual plan renderer draws operators as nodes with arrows showing data flow, plus cost percentages and row estimates.
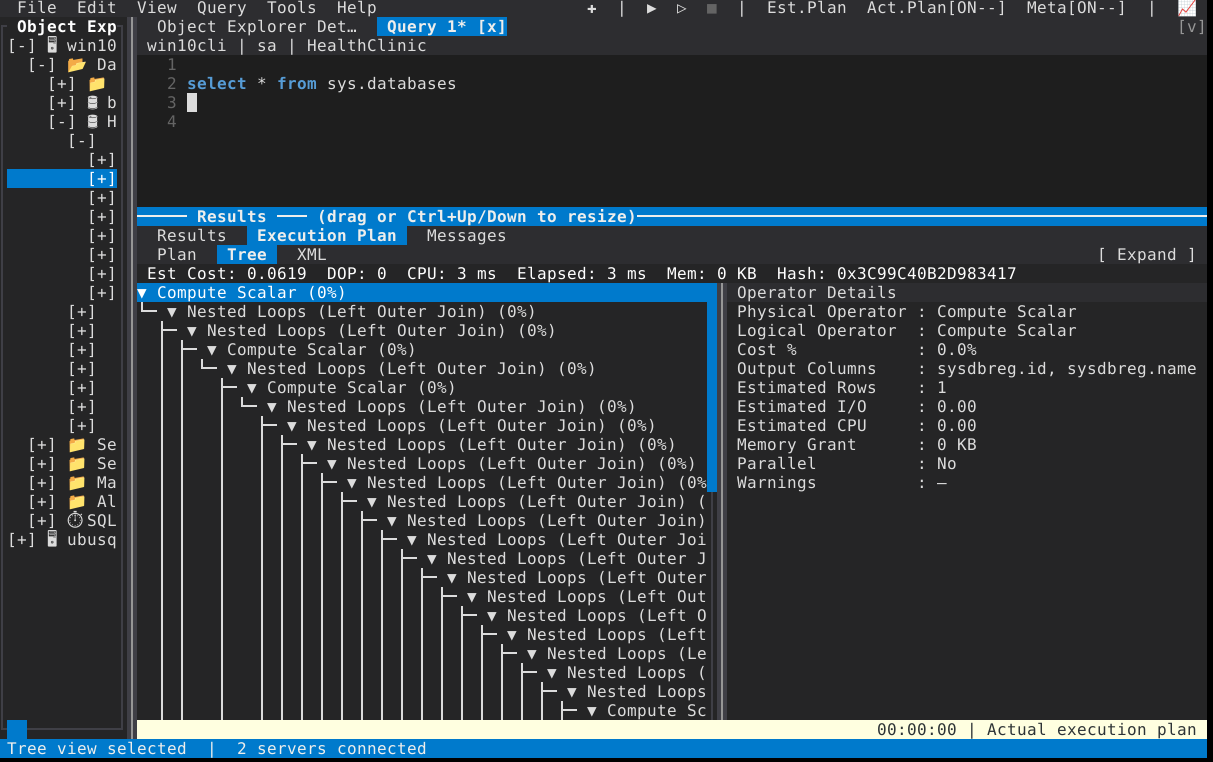
An alternative to the graphical renderer: a collapsible tree that shows each operator's details in text form.
The raw ShowPlanXML, for reading something the renderer has no glyph for, or for pasting into a tool that takes XML.
When the plan carries a missing-index recommendation, a banner appears above the graph and m opens its details — the statement, the columns the optimiser wanted, and the impact it estimated.
A plan tab can be raised as its own panel, which is how you keep a plan open beside the query that produced it — or beside another plan, to compare them by hand.
File ▸ Open (Ctrl+O) reads a .sqlplan — SSMS's own format — into the
same graph/tree/XML view, without needing a connection to the server that
produced it. File ▸ Save Execution Plan As… writes one back out from an open
plan, so a plan captured in goSSMS opens in SSMS and vice versa.
With Query ▸ Live Query Statistics (toolbar Live) on, Execute opens a live
tab showing the running statement's plan: each operator's rows against its
estimate, elapsed time and state, under a progress bar for the statement. It
follows a multi-statement batch or GO script statement by statement, and
becomes the actual execution plan when the run ends. It turns Actual Execution
Plan on, and needs VIEW SERVER STATE (on SQL Server 2022 and later, VIEW SERVER PERFORMANCE STATE or VIEW SERVER SECURITY STATE); without it the query
runs as usual and the tab says why it is empty.
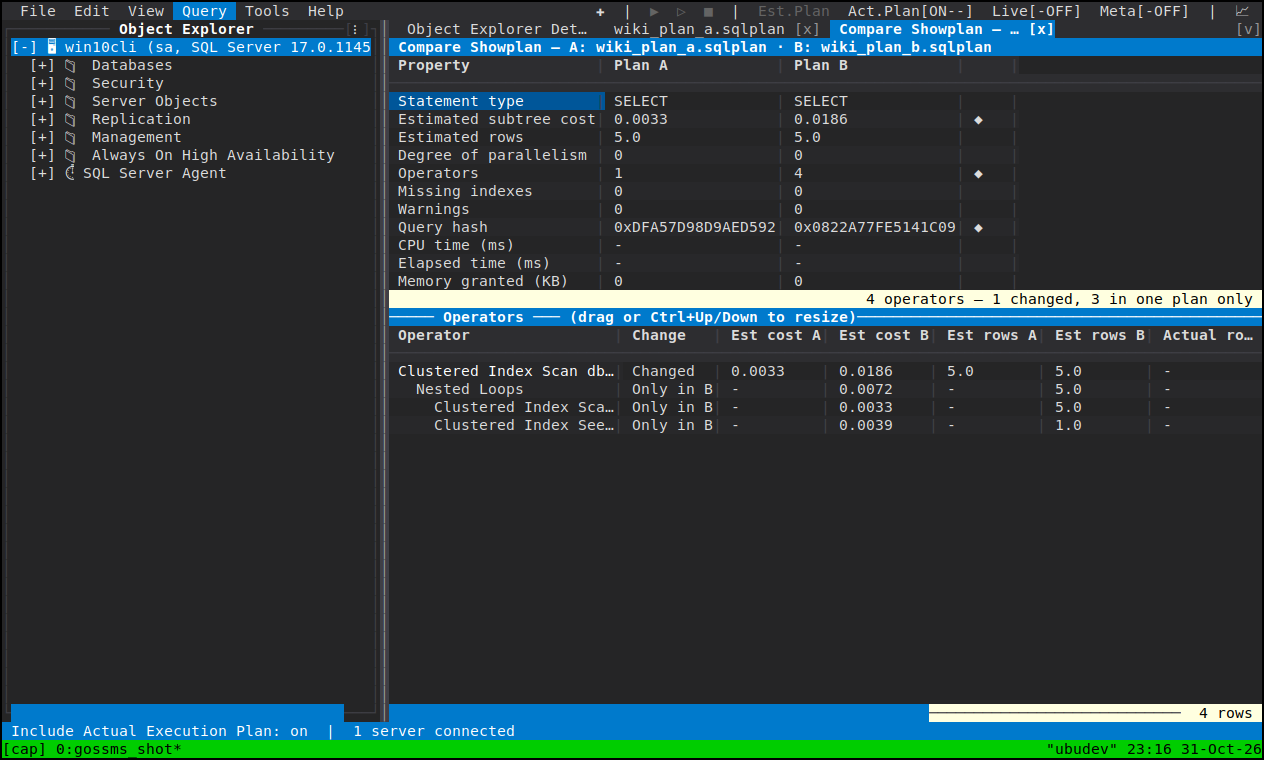
Two plans of one query paired over the operator tree, as two grids: the operators with what differs about each row named, and the statement-level properties side by side.
Tab         Move focus between the panel's grids
F5          Re-read the report
[  /  ]     Plan A's previous / next statement
{  /  }     Plan B's previous / next statement   (or click the A:/B: pickers)
Enter       Open the operator's plan at it — plan B when the cursor is on a
            B column, or right-click the row
There are two ways in, both from a plan that is already open: Query ▸ Compare
Showplan… pairs it with a .sqlplan file, and Query ▸ Compare with ▸ pairs
it with another plan already open in the session. Both entries are also on a
plan's right-click menu, and the same comparison is what Query Store's Compare
Plans raises — see
Query Store.
Show Live Execution Plan in Activity Monitor's Sessions or Block tab shows another session's running plan the same way — with the caveats about which queries SQL Server profiles on your version. It is on Activity Monitor.
- Query Editor — what a run does and where its tabs go
- Query Store — plans from history, forced plans
- Activity Monitor