Repository navigation
Query Store
One panel per database over the Query Store views SSMS ships: the report selector, the chart, the report's rows, and the plans of the selected query — which is where Force Plan, Unforce Plan and the plan comparison live.
Under a database node: Query Store ▸ Open Query Store… for the panel, or a report leaf's Open in Query Store Panel to open that report directly. Properties… on the folder is the configuration page — see below. The folder is listed whether or not Query Store is turned on, because deciding from the catalog means a second read on every expansion of every database — and when it is off, the panel says so and the way to the setting is one menu item away.
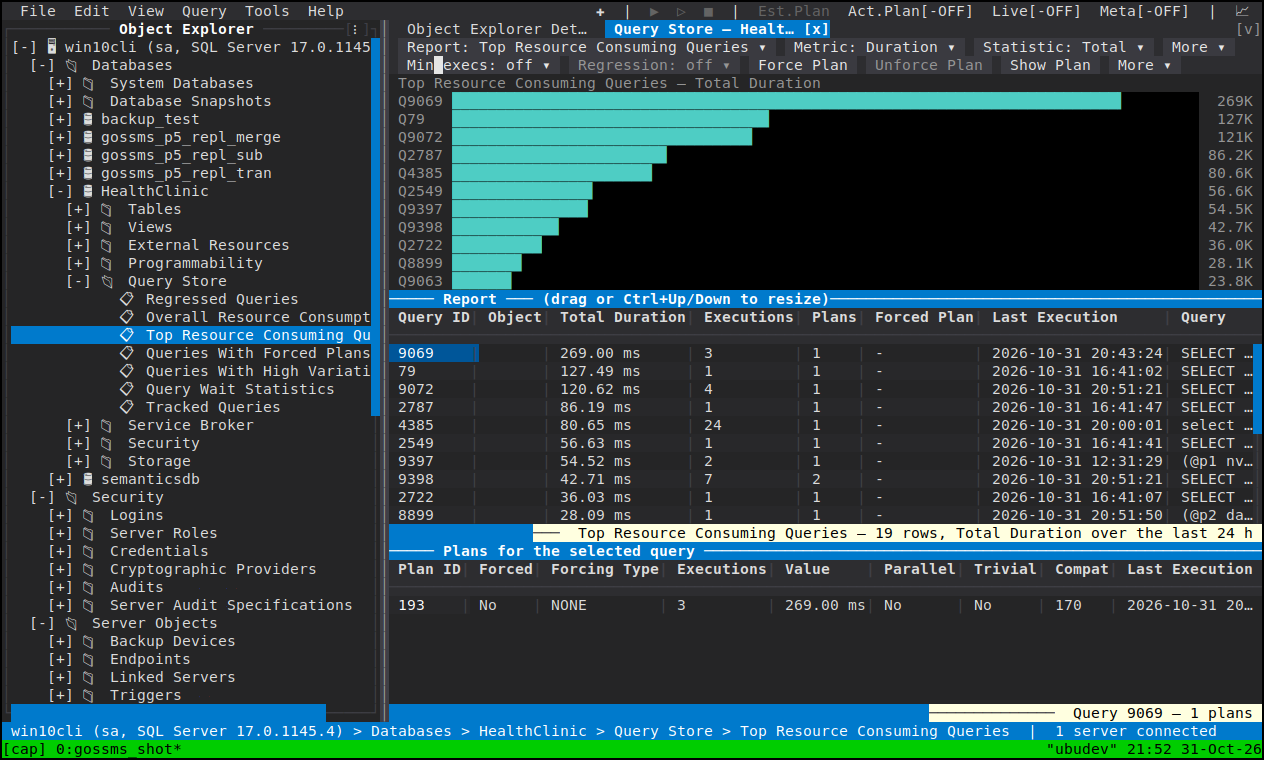
Listed in folder order, and each is also a Details-pane grid:
| Regressed Queries | Queries whose average duration grew across the reported window |
| Overall Resource Consumption | Total duration and executions per Query Store interval |
| Top Resource Consuming Queries | Queries ranked by total duration |
| Queries With Forced Plans | Queries pinned to one plan, and which plan |
| Queries With High Variation | Queries whose duration is least predictable, by coefficient of variation |
| Query Wait Statistics | Wait time by category, for queries Query Store captured |
| Tracked Queries | The queries pinned to this view, most recently executed first |
The panel's own controls — the metric, the statistic, the top-N, the filters — appear only on the reports that have them, and the chart's axis is labelled by whatever the report actually plots: the two ranking reports plot regression and variation rather than the metric column, so the bars and the numbers cannot drift apart.
Show Value on a Query cell opens the statement exactly as Query Store holds it,
newlines included, rather than the one-line rendering in the grid: flattening a statement
onto one line turns a trailing -- comment into one that swallows every later line, and
the cell is a display, never a statement to run. Rows that are not queries — Overall
Resource Consumption's intervals, Query Wait Statistics' categories — have no plan pane and
no plan actions, which is why they are absent rather than greyed and broken.
A report selector over a chart, the report's rows below it, and the plans of the selected query in the pane the force actions act from.
Tab            Move focus between chart, grid and plan pane
Left / Right   Shift the day window when the window has more than one day in it
PgUp / PgDn    Scroll the top-queries grid (the wheel scrolls it too)
Ctrl+Up/Down   Resize the split
Enter          Force-plan on the plan pane; toggle tracking on the rows
F5             Re-read with the current metric, statistic and window
Toolbar        Refresh, Force Plan, Unforce Plan, Show Plan, Script,
               Track Query, Compare Plans, Plot History — mouse-only
Ctrl+Left      Open the plan under the cursor, from the tree
The chart draws a line for each plan when a query has more than one (coloured plan A, plan B…) with the aggregate line over them, so the moment the plan flipped is on the screen rather than something you infer from a table. Plot History switches the series mode when you want the comparison instead of the total, and the legend counts what is plotted rather than what the query has, so two plans that share a plan id are never misread as one.
Track Query puts a query into the Tracked Queries report — its own series, kept after the top-N lists have forgotten it. The toolbar label answers the row under it, so "Track Query" never appears over an already-tracked query where it would untrack it.
Show Plan opens the graphical plan, or the stored XML as text when the plan is not in
sys.dm_exec_query_plan any more, and tells you which of the two you are looking at
when it is text. A Query Store plan row can hold no XML at all, and that too is reported
as a status line rather than as an empty panel.
Force Plan confirms first, and the confirmation names the query and the plan rather than "the selected row", because forcing changes what every future execution of that query does on a live database. What it costs is named with it: the plan stops being re-chosen, and a plan that can no longer be produced falls back silently to the optimizer's choice rather than failing — so a forced plan is a claim about the future that the server cannot always honour.
Unforce Plan is the only way back. Script writes the force, or the unforce, as T-SQL without running it, so a pin can go through review like any other change to a production box.
Compare Plans takes the two selected plans to the plan comparison panel.
Query Store's configuration is the Query Store page of Database Properties — the same page SSMS puts it on; the Query Store folder's Properties… opens that page rather than a dialog of its own.
| Requested state |
OFF, READ_ONLY, READ_WRITE — what you want. Actual state and Operation mode say what is running, and they can disagree while the store is coming up or going down |
| Query capture mode |
NONE, AUTO, ALL, and CUSTOM on SQL Server 2019+ |
| Max size / Size based cleanup mode |
AUTO or OFF, and the stale query threshold that decides what "stale" means |
| Data flush interval / Statistics interval (min) | How often the in-memory data goes to disk, and the width of a statistics bucket |
| Max plans per query | The per-query plan cap |
| Wait stats capture | On or off, on SQL Server 2017+ |
| Capture policy | With CUSTOM: execution count, total compile CPU, total execution CPU, stale threshold (1–168 hours) — SQL Server 2019+ |
| Storage | Current size, read-only state and the size/capture policy as the server holds them |
| Actions | Flush data to disk on Apply and Clear Query Store on Apply |
Two version-gated groups — CUSTOM capture mode with its QUERY_CAPTURE_POLICY, and
WAIT_STATS_CAPTURE_MODE — appear only on servers that have them, because offering a row
the instance lacks leaves a change that can only fail on Apply.
Flush and Clear are checkboxes gated on Apply, not buttons that fire immediately. They
go through the same dirty-tracking → Apply → Script Changes pipeline as every other
change on the page, which is the difference between clearing a query store by accident and
reviewing a DROP-equivalent script: what you did last week is gone, so the destructive
one arrives only with a tick and an Apply.
- Execution plans — Show Plan and Compare Plans land in the same panels
- Server and database properties — the Query Store page
- Object Explorer