Debugging
The tools for finding out why a screen looks or costs what it does, and for changing the game while it runs: floating windows of controls wired straight to your own properties, an overlay for the layout, an inspector to point at one widget, a browsable tree of the whole screen, a console for typing commands at a running game, live graphs of numbers that change every frame, and overlays for overdraw, draw calls, focus, redraws and the lines inside text. Each one is drawn by the toolkit itself, so it looks the same on every backend.
For one widget, Modifier.debugBounds() stays in composegl-ui; see
Modifiers. For the tree as text, dump, see
Testing.
Everything on this page is in composegl-debug, a module of its own so a shipped game does not
carry it:
dependencies {
    implementation("dev.wildware.composegl:composegl-ui:0.6.0")
    // Only in a development build.
    debugImplementation("dev.wildware.composegl:composegl-debug:0.6.0")
}
debugImplementation is Android's name for a dependency only a debug build gets. On the desktop,
put it behind a Gradle property, or in a source set the release build leaves out. A game that
wants the overlays in every build, behind a key, uses implementation.
It is the same targets as composegl-ui: the JVM, Linux, iOS and the browser.
import dev.wildware.composegl.debug.DebugWindow
import dev.wildware.composegl.debug.DebugWindowHost
import dev.wildware.composegl.debug.DevConsole
import dev.wildware.composegl.debug.DockSide
import dev.wildware.composegl.debug.FocusOverlay
import dev.wildware.composegl.debug.FrameBudgetOverlay
import dev.wildware.composegl.debug.Histogram
import dev.wildware.composegl.debug.Inspector
import dev.wildware.composegl.debug.LayoutOverlay
import dev.wildware.composegl.debug.NodeTree
import dev.wildware.composegl.debug.Plot
import dev.wildware.composegl.debug.arg
import dev.wildware.composegl.debug.rememberDebugWindowsState
import dev.wildware.composegl.debug.rememberDevConsole
import dev.wildware.composegl.debug.rememberPlotBuffer
The overlays, the inspector and the console were in composegl-ui in 0.5.0, in
dev.wildware.composegl.ui.debug. Moving to composegl-debug changes the import and adds the
dependency; nothing else about them changed. Plot, Histogram, rememberPlotBuffer and
NodeTree are new here and were in no earlier version.
What the renderer measures is still in composegl-ui, in dev.wildware.composegl.ui.debug:
FrameBudget, DrawCallTrace, OverdrawMap and measureOverdraw, so a test can hold a screen to
a budget with no debug module at all.
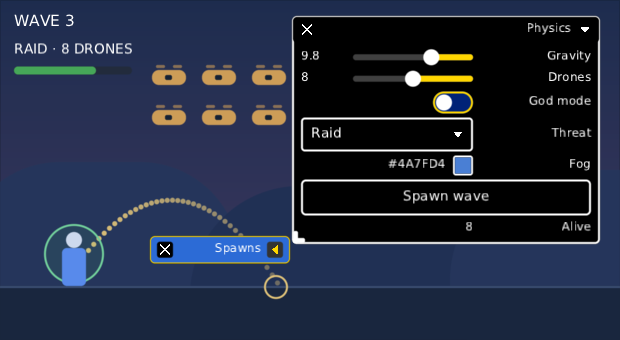
Tuning gravity, spawning a wave, turning god mode on. A DebugWindow is a floating window
of controls over the game, and each line of it is one of your own properties:
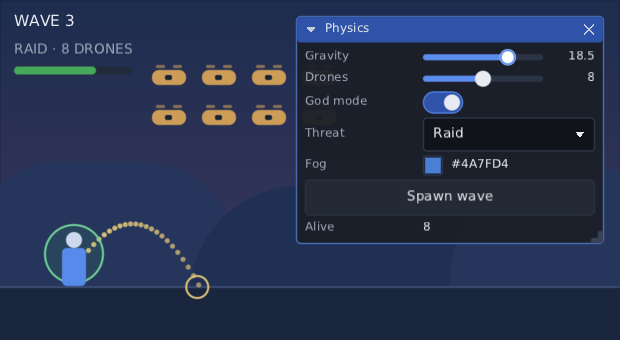
The hand in that picture is really on the slider, and the arc behind the window is really the arc the game draws from the number the slider is holding. Nothing in the scene knows the window exists.
DebugWindowHost {                       // round the whole game, once, outside everything else
    Game()

    DebugWindow("Physics", initialPosition = Offset(20f, 20f)) {
        tweak("Gravity", physics::gravity, 0f..50f)
        tweak("Friction", physics::friction, 0f..1f, step = 0.05f)
        tweak("Enemies", spawner::enemies, 0..40)
        toggle("God mode", cheats::godMode)
        choice("Difficulty", game::difficulty, Difficulty.entries)
        colour("Fog", world::fogColour)
        button("Spawn wave") { spawnWave() }
        text("Alive", alive.toString())
        CollapsingHeader("Advanced") { tweak("Air", physics::air, 0f..1f) }
    }
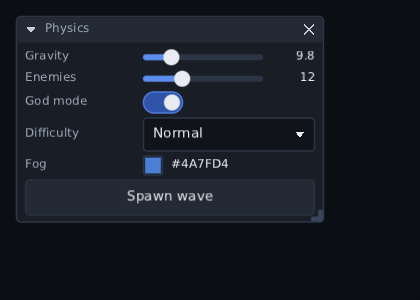
}
| Line | Control | For |
|---|---|---|
tweak(label, property, range, step) |
Slider and a readout |
a Float or an Int
|
toggle(label, property) |
Toggle |
a Boolean
|
choice(label, property, options) |
Dropdown |
one of a list — an enum's entries
|
colour(label, property) |
a swatch that opens a ColourPicker
|
a Colour
|
button(label) { … } |
Button |
something to do |
text(label, value) |
a line of text | a number to watch |
row(label) { … } |
whatever you put in it | a control of your own |
CollapsingHeader(title) { … } |
a heading that folds | a group of lines |
Each line takes either a property — physics::gravity — or a value and what to do with a
new one, tweak("Gravity", gravity, { gravity = it }, 0f..50f), which is what a local var
needs, since Kotlin cannot take a reference to one. A property backed by mutableStateOf
shows a change made anywhere in the game the moment it happens — and so does the game:
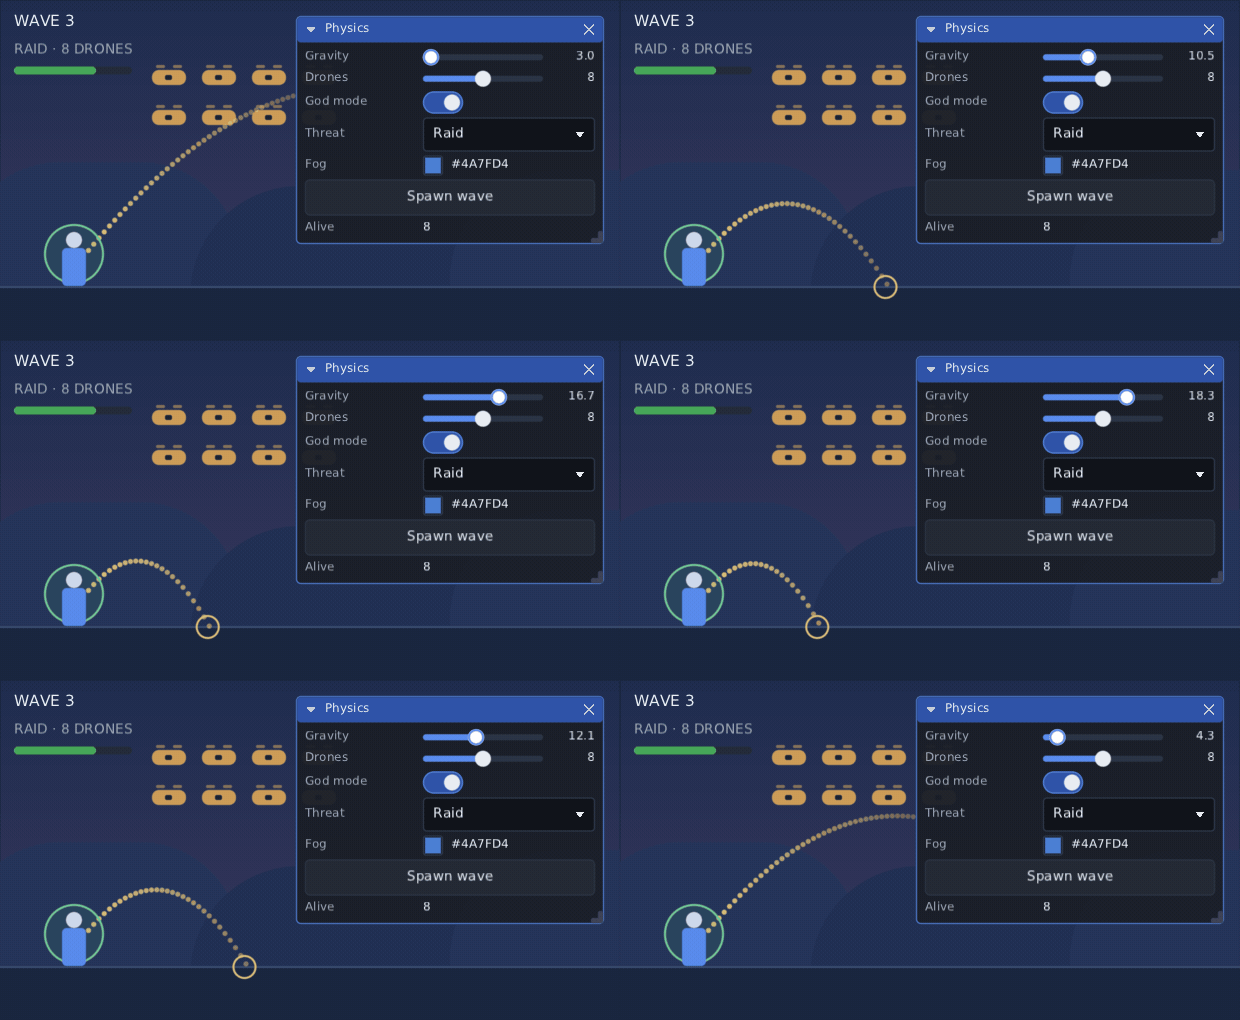
The controls are the toolkit's own, so the keyboard and a pad work them as they do on any
screen, and the skin draws them. The labels sit in a column labelWidth wide, so the
controls line up.
| Do this | And you get |
|---|---|
| drag the title bar | the window moves |
| drag an edge or a corner | the window resizes, down to minSize; the cursor says which way |
| click anywhere on it | it comes to the front, and the keyboard comes with it |
| the triangle, or a double click on the title | it folds to its title bar, and back |
| the cross |
onClose, so the game stops composing it — like a Dialog
|
| Ctrl and an arrow, with focus inside | it moves. With Shift too, it resizes |
| F9 | every debug window is put away, and brought back |
| F6, or the pad's right stick click | focus moves to the next window, then back to the game |
| the pad's right stick, with focus inside | the window moves, and stops as soon as focus leaves it |
| both sticks clicked together | every window is put away, as F9 does |
| right-click the title bar, or Shift+F10, or the pad's North | the window's own menu: where to dock it, and how to float it again |
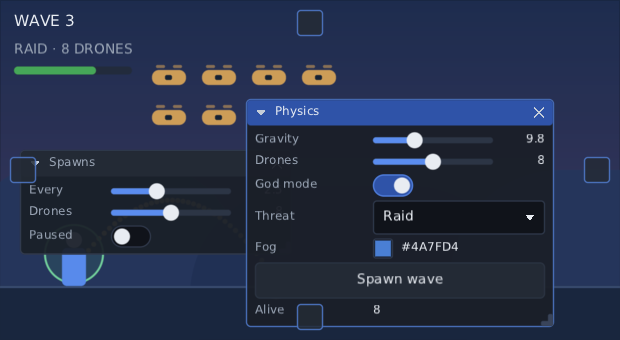
The window in front is the lit one. Raising a window takes the keyboard with it, and the
keyboard arriving in a window raises it, so the two can never disagree: exactly one window is
drawn in its .active look, and it is the one on top. Clicking a title bar lights the window
without arming a control in it, so Enter straight afterwards does nothing. A window that is
closed, or put away with F9, hands the keyboard to the window now in front, or back to where
it was in the game.
Every key and button there is an argument of DebugWindowHost — hideShortcut,
hideChord, cycleShortcut, cycleButton — and all of them are shortcuts, so a field
that wants F6 keeps it. F6 and the right stick click with nothing to cycle to — no windows,
or all of them put away with F9 — are not used either, press and release both, so a game that
reads that key or that button in its own loop still gets it.
A window is never dragged or resized past the top of the screen, and one still the size of what is in it is only ever as tall as the room under it, so its bottom edge and the grip in the corner stay somewhere you can reach them.
A window can carry its own menus, and holds anything else you compose in it:
DebugWindow("Physics", menuBar = { Menu("&Presets") { Item("&Moon") { gravity = 1.6f } } }) { … }Five floating windows is five windows in the way. Drag one by its title bar and small squares appear: four round the edges of the screen, and a cross of five over whatever window is under the pointer. Let go on one and the window lands there — a pane down that edge of the screen, a pane taking half of that window's own, or, on the middle square of the cross, a tab beside it. A patch shows the space it would take before you let go.
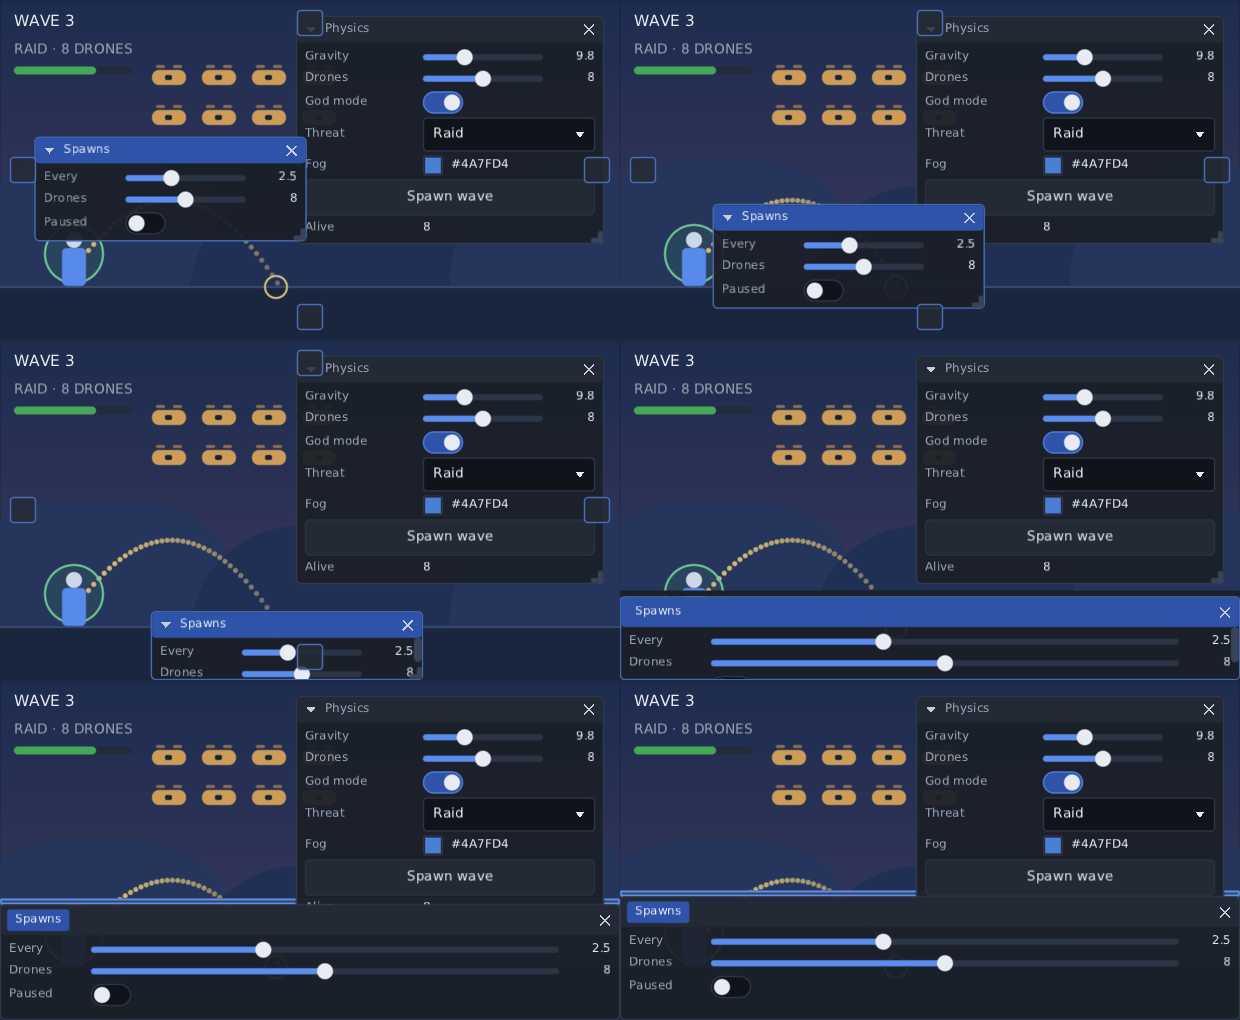
That is one real drag and then another. Nothing in it is a layout handed to the toolkit: the squares come up because a window is being carried, the patch appears the moment the pointer is over the square at the bottom edge, and the last few frames are the divider being pulled up afterwards.
Dropping on a window that is still floating takes that one along: it docks against the edge of the screen it was nearest, and the two land there together. So the first drop of the run works like every other one, with nothing to set up first.
| Do this | And you get |
|---|---|
| drag the title bar onto a square at the edge of the screen | a pane down that edge, a quarter of the screen wide |
| drag it onto the middle square over another window | the two tabbed together, the one you dropped showing |
| drag it onto a side square over another window | that window's pane split in two |
| drop on a window that is still floating | it docks against the edge it was nearest, and the pair share that pane |
| drag the title bar anywhere else | the window is only moved — it never docks by accident |
| click a tab | that window comes forward, and the keyboard with it |
| drag a tab out | that window floats again, under the pointer |
| drag the divider between two panes | one pane gets more of the space; it stops before either is squashed |
| double click a divider | the two panes share their space evenly |
| Ctrl and Alt and an arrow, with focus inside | dock against that edge of the screen (Command on a Mac) |
| Ctrl and Alt and F | float it again |
| the divider focused, and an arrow or the pad | the divider moves a step the way it points |
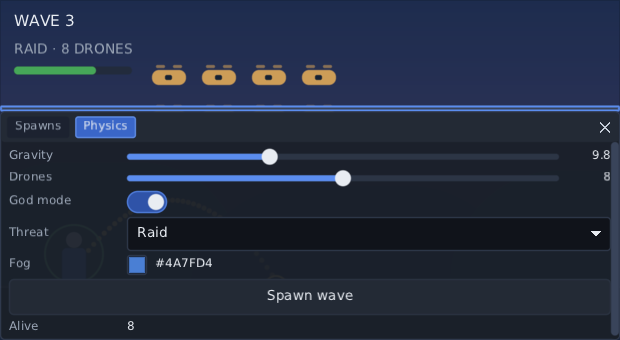
Three drags made that: Spawns onto the square at the bottom edge, Physics onto the middle of the cross over it, and the divider up to give the pair room. The tab that is lit is the window showing.
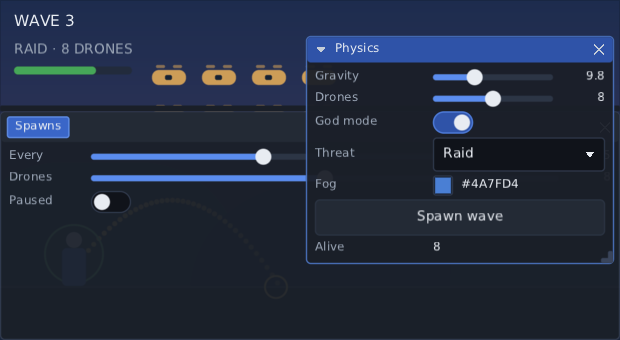
And a fourth undoes it: the Physics tab dragged off the strip and let go over the game, which floats that window again under the pointer and leaves Spawns holding the pane on its own.
A docked window has no edges to drag and does not fold: its pane is its size, and the dividers are what change it. The game is never covered completely — whatever is docked, the space left over is a hole the game shows through, which is what the dividers move against.
A right click on the title bar — Shift+F10 from the keyboard, North on a pad — opens the window's own menu, which docks it and floats it again without a drag. The same commands from code:
val windows = rememberDebugWindowsState()

DebugWindowHost(state = windows) { Game(); DebugWindow("Physics") { … } }

windows.dockToScreen("Physics", DockSide.Left)       // a pane down the left
windows.dockWith("Spawns", "Physics")                // tabbed beside it
windows.dockWith("Log", "Physics", DockSide.Bottom)  // half of its pane
windows.undock("Spawns")                             // floating again, where it was before
dockWith does what the drop does: a window still floating is docked against the edge it is
nearest first, so the two always end up together. isDocked, tabsWith, dockedWindows and
showTab read and change the same layout, and resetLayout() floats the lot. The layout is kept by the same DebugWindowStore as the window
positions, under one key, so it comes back the next time the game runs — panes and all, including
ones for windows this run has not composed yet, which are left out until they appear.
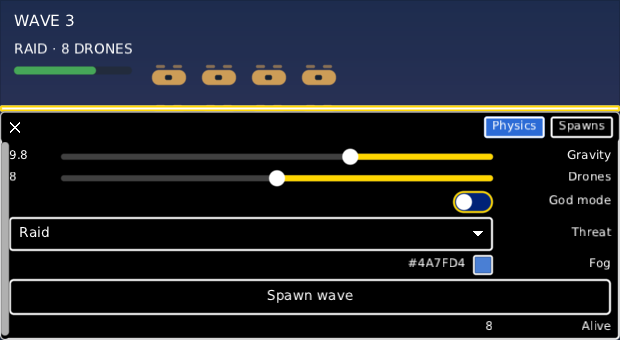
The same two drops, on a screen that reads from the right. An edge of the screen is the same edge whichever way the words run, so the pane lands where it was dropped; it is the strip of tabs and the rows inside it that read from the other end. That is the high-contrast skin, and the line above the pane is the divider that was dragged up, still focused.
Position, size, whether it is folded, which sections in it are open and the dock layout the
docked ones share are kept by a DebugWindowStore and come back the next time the game runs. On the desktop — the JVM and
Linux native both — that is a file called composegl-debug-windows.txt beside the game, the
way imgui keeps imgui.ini; on iOS and in the browser it lasts as long as the run, because
neither has a place to write that the game has not chosen (on iOS, hand in a
FileDebugWindowStore pointing at the app's Documents directory). A game with a save system
of its own writes four lines:
class MyStore : DebugWindowStore {
    override fun load(): Map<String, String> = settings.readMap("debug-windows")
    override fun save(values: Map<String, String>) = settings.writeMap("debug-windows", values)
}

DebugWindowHost(state = rememberDebugWindowsState(MyStore())) { Game() }
DebugWindowsState is also how a game reads and changes the windows from elsewhere:
windows names them from the back to the front, hidden puts them away, bringToFront
(which takes the keyboard with it, as a click does), position, size, isCollapsed,
setCollapsed, focusNextWindow, dockToScreen, dockWith, undock, showTab,
isDocked, tabsWith, dockedWindows, and resetLayout() to put every window back where
the code puts it, floating.
Unlike the overlays below, a window is an ordinary part of the interface and takes the
mouse, the keyboard and the pad. It is skinned like every other widget: "debugwindow"
and "debugwindow.active" for the frame, "debugwindow.title" and
"debugwindow.title.active" for the title bar — the .active pair being the window in
front — then "debugwindow.button", "debugwindow.body",
"debugwindow.label", "debugwindow.value" and "debugwindow.grip". Docking adds
"debugwindow.tab" and "debugwindow.tab.selected" for the tabs a docked pane wears instead
of a title, "debugwindow.dock" for the patch showing where a dragged window would land and
"debugwindow.dock.target", with .active for the one under the pointer, for the squares it
is dropped on; the divider between two panes is the toolkit's own "splitter". The default
and high-contrast skins name all of them, and a colour line wears the picker's own
"colourswatch" and "colourpicker".
That is the high-contrast skin, right to left, with the second window folded by a click on its triangle. The game under it is drawn where its own code puts it: it is the interface that mirrors.
The showcase demo has one over its scene: Fight, in the Debug menu. Its Debug ▸ Windows submenu
docks that window and the UI tree one, tabs them together and floats them again, which is the
same thing dragging them does.
A dump says where everything is. LayoutOverlay shows it, over the running game:
Box(Modifier.fillMaxSize()) {
    Game()
    LayoutOverlay(enabled = debug)                                    // everything
    LayoutOverlay(enabled = debug, show = setOf(Show.Padding, Show.Gaps)) // or just some of it
}
Show |
Drawn as | What it is |
|---|---|---|
Bounds |
blue edge | every node's box, where layout put it (layoutBoundsInRoot) |
Drawn |
yellow edge | where a scale really draws it (boundsInRoot), left out where a blue edge already is |
Painted |
pink edge | where its ink really is (paintedInRoot) — text inside its line box, a background inside padding — left out where a blue or yellow edge already is |
Padding |
green wash | the padding inside each box |
Gaps |
orange wash | the space a Row or Column leaves between children |
"Why is there a gap here?" is the orange. "Why is this three pixels off?" is usually a pink edge sitting inside a blue one.
Put it last, at the top of the screen. It has no size and takes no clicks, so it moves nothing and a click goes straight through it. It reads the tree as it is drawn, so it follows every change, and it never marks the tree changed itself: a still screen with it on stays still. It has its own colours, the same over any skin. Take it off before shipping.
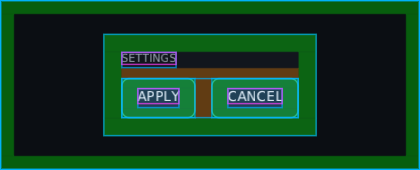
Gaps are shown for rows and columns; a FlowRow or a grid does not shade its gaps yet.
The overlay shows everything. Inspector answers "why is this that size?" for one thing:
Inspector(enabled = debug) { Game() }While it is on, the game stops taking the mouse and the inspector takes it:
| Do this | And you get |
|---|---|
| hover | the node under the pointer outlined in blue, its padding shaded green |
| read the panel | its name and tag, position, size, the room its parent given it, padding, its policy (Row spaced 12, Box, Grid…), and its modifier chain in the order it was written |
| click | the node pinned in orange, so the pointer can go; click again or Escape to let go |
| arrow keys or d-pad, while pinned | Up to the parent, Down to the first child, Left and Right to siblings; East lets go |
| the tree under the panel | every node on the screen, - and + to fold a branch, click a line to pin it; tree hides it and <> moves the panel to the other side |
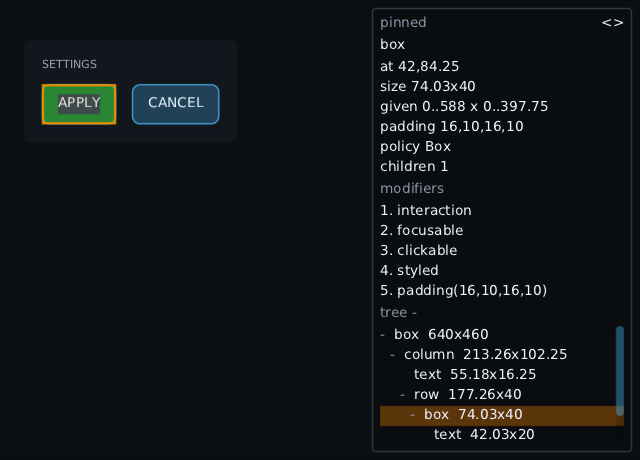
The deepest node wins, so clicking the middle of a button pins its label; press Up for the button. The panel reads the nodes again every frame while it is on, so a pinned node that grows shows its new size. It only redraws when something it shows changed, and turning it off rebuilds nothing: the screen keeps its state and focus.
The inspector answers "what is this?" for whatever the pointer is over. NodeTree answers
"what is on this screen at all?" — which is the only way to reach a widget you cannot point
at: one that is invisible, zero sized, clipped away, or under something else.
val inspection = rememberInspectorState()

Inspector(enabled = debug, state = inspection) { Game() }
NodeTree(inspection, Modifier.width(300f).height(320f))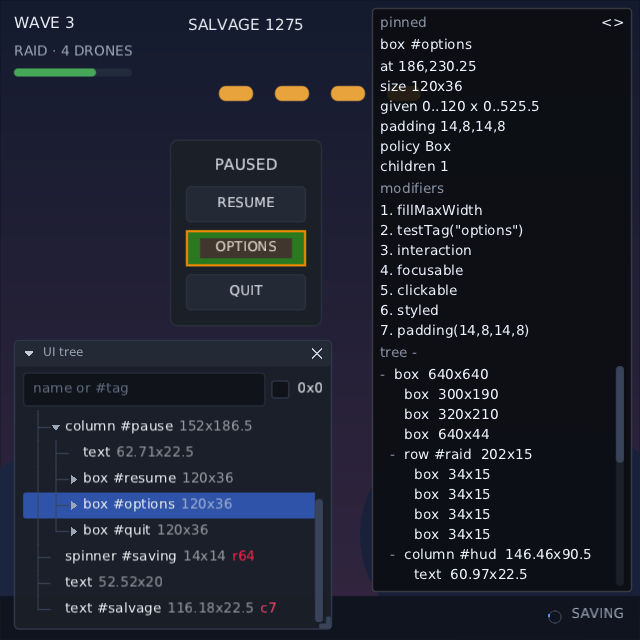
One real click on that button did all of it: the rows opened down to it and the branches beside
it stayed folded, its row is the one chosen, it is outlined on the screen, and the panel on the
right is filled in. The two red counts near the bottom are what the game is paying for while it
stands still: r64 on spinner #saving, which redraws every single frame, and c7 on
text #salvage, a line of the HUD that is rebuilt every few frames.
Sharing one rememberInspectorState() is what joins the two: the rows open down to whatever
the pointer is over, and choosing a row pins that node — outlined in orange on the screen,
with the inspector's panel filled in. Without an inspector, point it at a node yourself:
var interfaceRoot by remember { mutableStateOf<UiNode?>(null) }
val placed = remember { PlacedHandler { interfaceRoot = it } }

Box(Modifier.fillMaxSize().onPlaced(placed)) {
    Game()
    NodeTree(interfaceRoot, Modifier.width(300f).height(320f))
}
Each row says what the node is (box #play), how big it is, and what it has cost:
| On a row | What it means |
|---|---|
c12 |
twelve frames rebuilt the node — a new chain, a new drawing, a child added or taken away |
r300 |
three hundred frames only redrew it — a marquee sliding, a Spinner turning |
| red, fading | the count ticked on this frame. A widget still glowing on a still screen is the one costing you a frame every frame |
Those are RedrawOverlay's numbers, read off the nodes rather than flashed over them;
counting is turned on while the tree is composed and off again when it goes.
| Do this | And you get |
|---|---|
| type in the box | every node whose name or tag has that text in it, and the nodes above them so there is a way down. #play finds it by tag, spinner by name |
| clear the box | the rows back the way you had them before the first letter |
tick 0x0
|
nodes with no width or no height left out, except where something showing sits under one |
| click a row | that node chosen — pinned, with an inspector sharing its state |
| up and down, right and left, Enter or the pad's South | the tree's own keys: move, open or go in, close or go out, choose. Mirrored in a right-to-left screen |
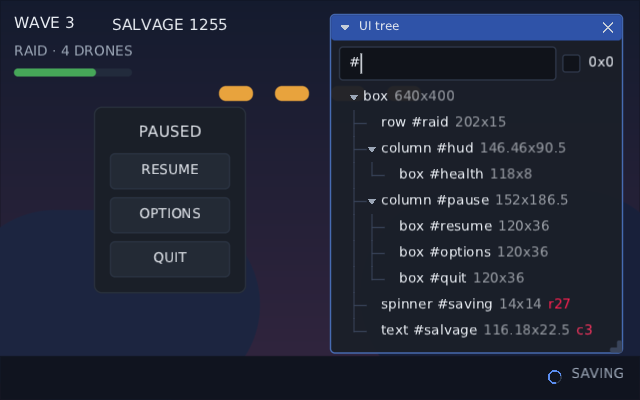
A # on its own is every node anybody gave a tag to, which is a quick way to see what your own
tests can reach for. r27 beside spinner #saving is a spinner redrawing every frame; c3 in
red beside text #salvage is a number that was rebuilt a moment before the picture.
It is a Widgets underneath, so only the rows you can see are built and a screen of
ten thousand nodes costs a screenful; and unlike the inspector it is skinned like any other
tree, under style. Its own rows are left out of the walk, so pointing it at the root of the
whole interface neither lists nor flashes on the tree itself.
It is a plain composable, so it goes in a window you can drag out of the way — which is where the showcase demo keeps it. Give it a height of its own: a window's body scrolls, so it offers what is in it all the room it asks for, and a tree told to fill that would have nothing to scroll inside.
DebugWindow("UI tree") {
    NodeTree(interfaceRoot, Modifier.width(280f).height(320f))
}
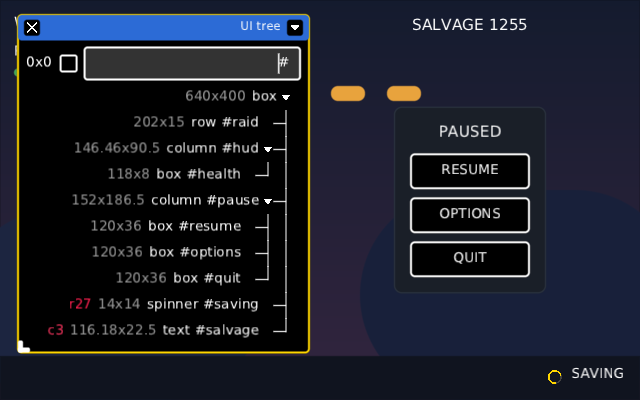
It mirrors like anything else the toolkit draws. In the high-contrast skin reading from the
right, the window is measured from the other corner, the filter box and the 0x0 switch swap
sides, the rows step in from the right, and each node's size comes before its name:
give sword 10, noclip, timescale 0.2. A drop-down console is the fastest way to poke a
running game, and DevConsole is one: a panel that slides down from the top with a log in it
and a prompt along the bottom.
val console = rememberDevConsole {
    command("noclip", help = "Walk through walls") { player.collides = !player.collides }
    command("timescale", arg<Float>("scale")) { clocks.world.scale = it }
    command("give", arg<String>("item", suggest = { items.ids }), arg<Int>("count", default = 1)) { id, n ->
        give(id, n)
    }
}

Box(Modifier.fillMaxSize()) {
    Game()
    DevConsole(console, toggleKey = Key.Grave)          // ` brings it down
}

console.log("Loaded level 3")
Put it last on the screen, like the overlays. It fills whatever it is given and draws over everything composed before it.
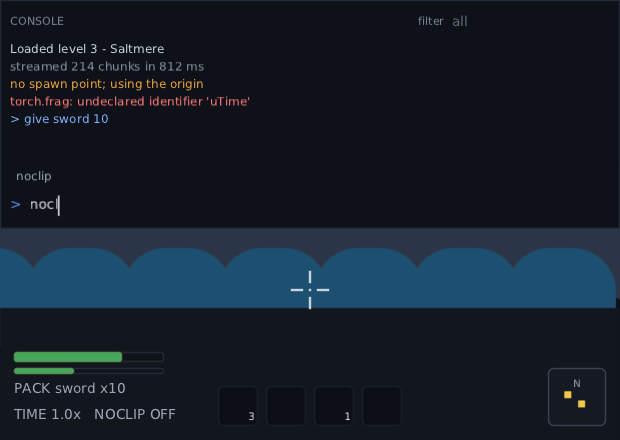
The picture is the real thing being typed at: give sword 10 was run, which is why the pack in
the HUD behind has a sword in it, and the next command is half written.
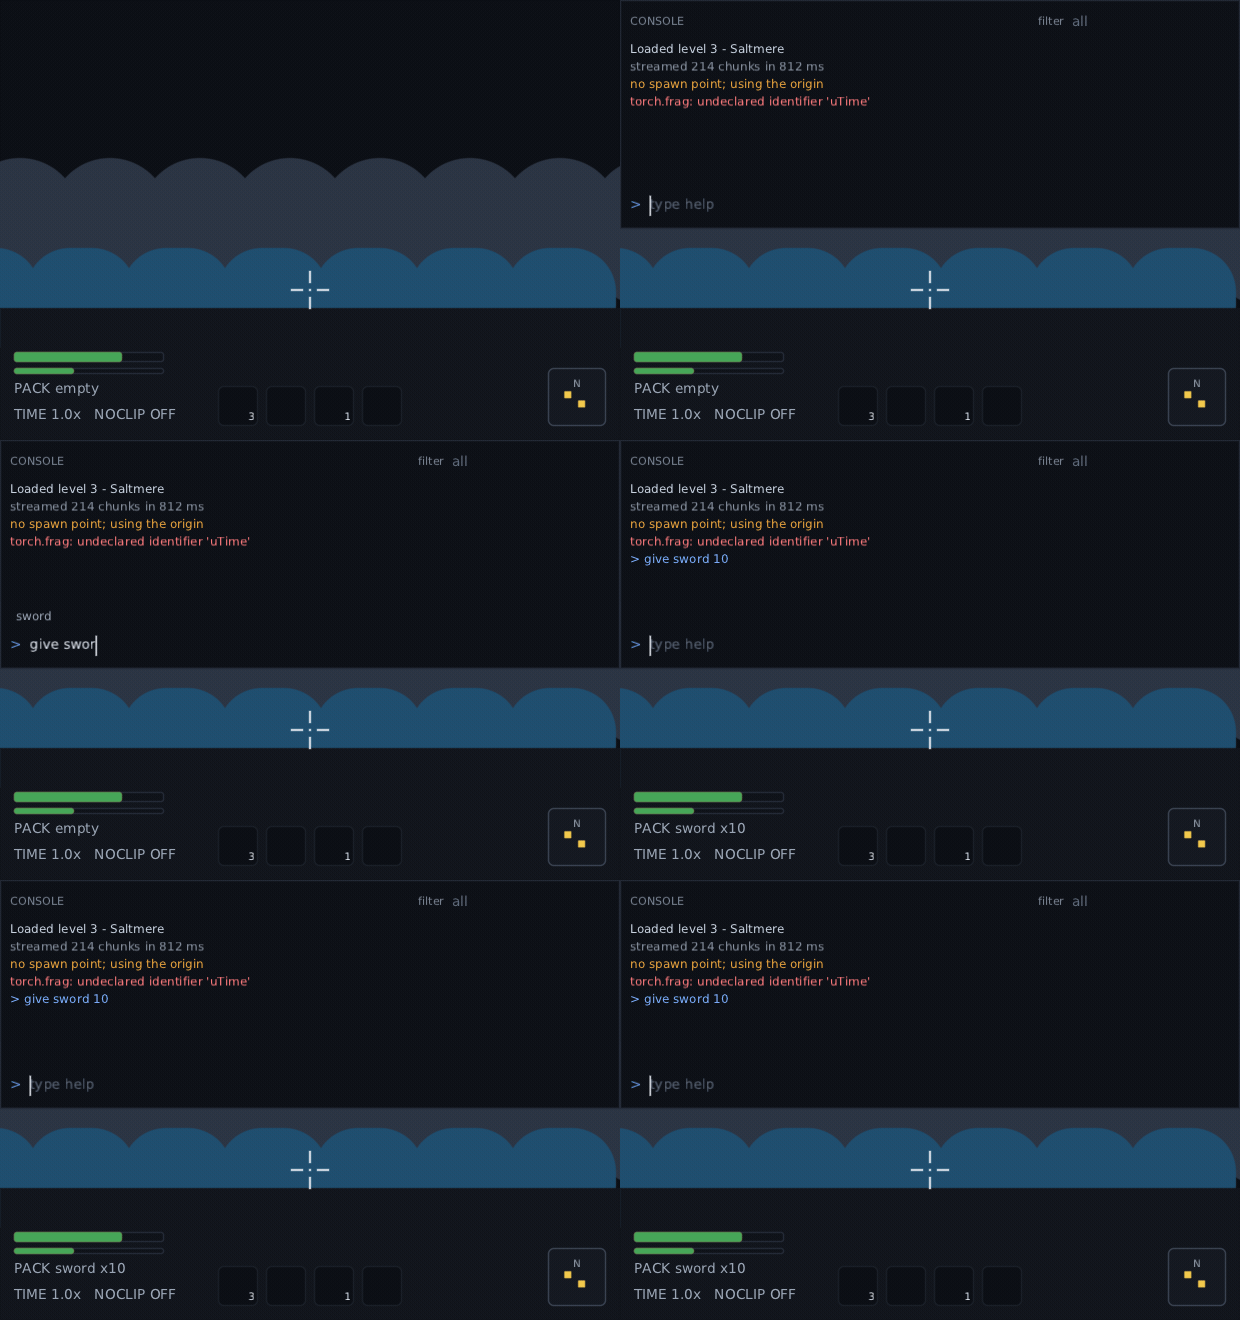
command takes the name, up to three args and what to do, and the lambda is handed the types
it asked for — a Float, an Int, a String — rather than a list of words to pick apart.
| Written as | Means |
|---|---|
arg<Float>("scale") |
required, read as a number; timescale fast says so and does not run |
arg<Int>("count", default = 1) |
may be left out. A required argument after one of these is refused where it is written |
arg<String>("item", suggest = { items.ids }) |
Tab offers whatever the lambda returns now, so a list that changes while the game runs suggests what is there |
arg<Boolean>("on") |
true, on, yes or 1, and their opposites. Tab offers true and false
|
The types are text, whole numbers, numbers and true-or-false. Anything else is a game's own
object and the console cannot turn a word into one: take a String and look it up in the
command, which is what item above does.
help and clear are already there, written the same way. help lists every command with its
arguments; help give explains one. A command that throws says so in the log and the game
carries on — a console that closes the game when a command is wrong is a console nobody dares
use.
Commands are built once. A screen that brings its own adds them later with
console.define { … }, and naming one twice replaces the first.
| Press | And |
|---|---|
` (or whatever toggleKey is) |
it comes down, or goes away, from wherever focus is |
| Back + right bumper | the same, from a pad. A chord, because a pad has no spare button |
| Enter | runs the line |
| Up and Down | back and forward through what was typed before |
| Tab | fills the word in as far as every choice agrees, then walks the choices; Shift+Tab walks back |
| Escape | puts the suggestion list away, and closes the console once it is away |
| PageUp and PageDown | scroll the log |
| Ctrl+C | copies whatever was selected in the log with the mouse |
While it is down it eats every key, so typing noclip does not also make the player walk. The
pad is left alone apart from the chord, so a game driven by one carries on behind it. A pad
player types with the button keyboard from ProvideGamepadKeyboard, if the game provides one.
Selecting a line with the mouse takes the caret out of the prompt, the way selecting text anywhere in the toolkit does; clicking the prompt puts it back.
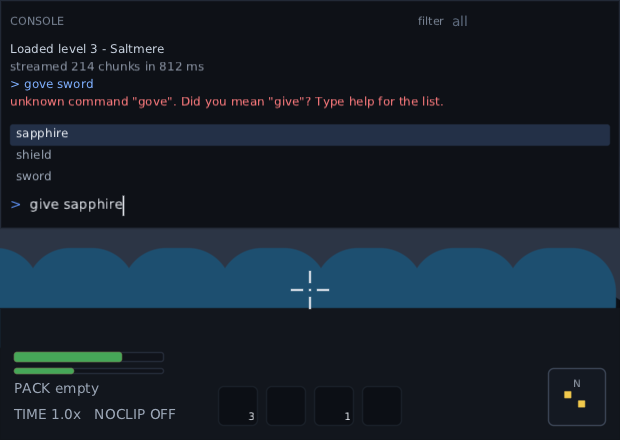
A typo says what it meant, and Tab over an argument offers what that argument suggests.
The log holds maxLines lines (500 by default) and follows the newest, unless you have scrolled
back to read something — then it holds still. The box at the top right filters it: only lines
with that word in them are shown, which is the fastest way to read one system's chatter out of a
busy log. console.filter is the same thing from code.
console.log("Loaded level 3")                       // Info
console.warn("no spawn point; using the origin")
console.error("shader failed to compile")
console.log("fps: $fps", ConsoleLevel.Debug)
console.run("give sword 10")                        // as though it had been typed
Each level is its own skin style — console.line.warn, console.line.error — so a warning is
seen before it is read. A line with newlines in it becomes one line of the log each, so the
filter and the levels work on every one of them.
Up walks back through what was typed. To keep that between runs of the game, hand in a
ConsoleHistoryStore: the toolkit has no files of its own — it runs in a browser, where there
are none — so where the lines go is the game's to say.
class FileHistory(private val path: Path) : ConsoleHistoryStore {
    override fun load(): List<String> = if (path.exists()) path.readLines() else emptyList()
    override fun save(lines: List<String>) = path.writeText(lines.joinToString("\n"))
}

val console = rememberDevConsole(history = FileHistory(Path.of("build/console-history.txt"))) { … }
load is called once, when the console is built, and save every time a command is run, with
the whole list newest last and capped at a hundred lines. The default keeps them in memory for
as long as the game is running.
Every colour comes from the skin, under console: the panel itself, console.title,
console.prompt, console.line with one per level under it, console.suggestion and
console.suggestion.selected, and console.field for the two boxes typed into. The shipped
skins name all of them, so a game that has written no skin still gets a console it can read.
DevConsole(console, style = "console", heightFraction = 0.4f) // how much of the screen it covers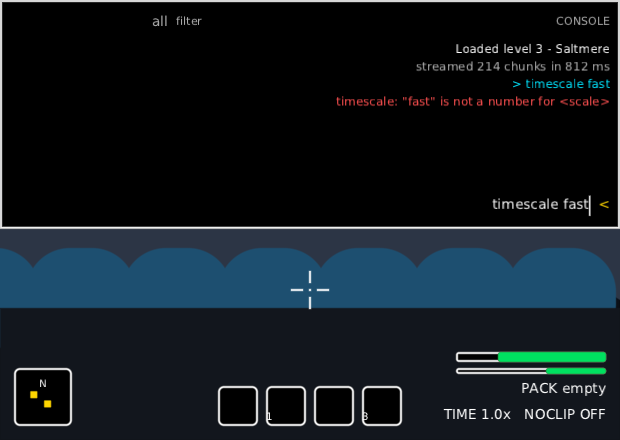
Right to left, everything swaps sides: the title, the filter box, the prompt's > and the log
itself. That picture is the high-contrast skin, and Up has just brought a refused line back to be
fixed.
The showcase has one: press ` and type help.
A panel on a panel on a background paints the same pixels three times, and a phone pays
for every one. Nothing looks different for it. OverdrawOverlay shows it:
Box(Modifier.fillMaxSize()) {
    Game()
    OverdrawOverlay(enabled = debug)            // one shaded square per 2 units
    OverdrawOverlay(enabled = debug, cell = 8f) // coarser, cheaper
}| Painted | Shaded |
|---|---|
| once, or not at all | left alone |
| twice | blue |
| three times | green |
| four times | pink |
| five times or more | red |
Put it last, like LayoutOverlay. Each frame it draws the whole tree a second time into
a counter instead of the screen, then shades the counts. So it counts the calls the
frame really made — a background, a border, a shadow's whole spread, each run of text,
each picture — it follows every change, and a still screen with it on stays still. Its
own shading is not counted, nor LayoutOverlay's, Inspector's, FocusOverlay's, RedrawOverlay's or TextMetricsOverlay's marks. Take it off
before shipping.
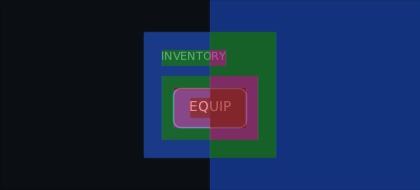
In a test, ui.overdraw() hands back the counts, so a screen can be held to a budget:
uiTest { PauseMenu() }.use { ui ->
    val map = ui.overdraw()
    assertTrue(map.deepest <= 3)          // no pixel painted more than three times
    assertEquals(2, map.at(640f, 360f))   // the middle of the screen, exactly twice
    println(map.average)                  // 1.4 is the fill rate of 1.4 screens
}
Outside a test, measureOverdraw(host.root, canvas) does the same.
Worth knowing:
- A subtree drawn into a picture — a
scale, arotate, an effect, a shaped clip — counts twice: once into the picture, once where the picture lands. That is what the GPU fills. - A clipped-away or faded-out part counts nothing, as it paints nothing.
- Only the interface is counted. A 3D world drawn behind it, or anything drawn through
raw, is not. A scrim over the world shows as painted once. - A rounded corner counts as its square box, and text as its box rather than its letters.
FrameBudgetOverlay counts the draw calls. Under the count it lists the nodes that caused
the most of them, and why:
if (budget.isOn) FrameBudgetOverlay(budget, Modifier.align(Alignment.BottomEnd))A batch is one trip to the GPU. It breaks — one more draw call — whenever the next thing needs something the queue does not share:
| Reason | What cut the batch |
|---|---|
texture |
a picture from a different texture than the one before it |
blend |
Modifier.blend, going in and coming out |
clip |
Modifier.clip, going in and coming out |
layer |
an offscreen picture: a scale, a turn, a shaped clip, an effect |
shader |
a picture drawn through an effect's shader |
raw |
your own drawing inside raw { }
|
scene |
a SceneView rendering your 3D scene, before the frame. Counted as one call, the least it costs. |
full |
nothing changed; the queue was full |
A screen with scene views at work gets two more lines: scenes, the milliseconds they took
(part of the frame's total, not of draw), and scene renders, how many rendered in the
frame. Four editor viewports redrawing every frame show as 4. The same numbers are
FrameReading.sceneMillis and FrameReading.scenes. UiRenderer counts them for you; a
ScenePass(tree, canvas, budget) you drive yourself does too. See Scene view.
The blame goes to the node that asked for the change. A glowing icon is blamed twice, for the batch it cut going in and for its own glow coming out. A picture from its own texture is blamed going in, and the next node that draws from the font atlas is blamed for going back — so those two usually turn up as a pair. The frame's last call is nobody's fault and is never listed, which is why the list adds up to one less than the count.
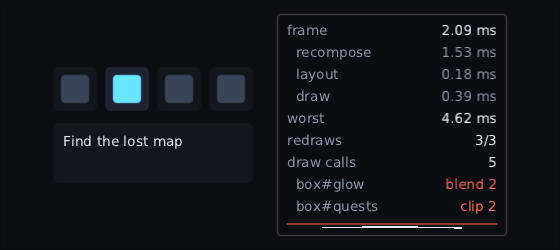
UiRenderer does all of this while the budget is on. A game writing its frame out itself
wires the two halves by hand: drawPass.trace = budget.trace and
canvas.traceDrawCalls(budget.trace). In a test, read it off the reading:
val budget = FrameBudget(publishEveryMillis = 0)
uiTest(budget = budget) { Hud() }.use { ui ->
    ui.render()
    val worst = budget.reading.culprits.first()   // node, name, reason, calls
}
Every built-in canvas traces: LibGDX, raw OpenGL, WebGL and KorGE all draw through the same shared renderer. The headless one does not batch, so it lists nothing.
A test that wants to assert on the times rather than the counts hands the budget a clock it moves itself, so a frame costs the milliseconds the test said instead of whatever the machine managed that second:
var now = 0L
val budget = FrameBudget(publishEveryMillis = 0, nanoTime = { now })
budget.draw { now += 5_000_000 }   // five milliseconds of drawing, exactly
budget.endFrame()
assertEquals(5f, budget.reading.drawMillis)
Left out, nanoTime is the machine's own monotonic clock, which is what a game wants.
Pad focus is worked out from geometry, so when Down goes to the wrong button there is
nothing to look at. FocusOverlay draws the answer before anybody presses anything:
Box(Modifier.fillMaxSize()) {
    Game()
    FocusOverlay(enabled = debug)                                   // everything
    FocusOverlay(enabled = debug, show = setOf(FocusShow.HitAreas)) // or just some of it
}
FocusShow |
Drawn as | What it is |
|---|---|---|
Arrows |
cyan arrow | where Up, Down, Left and Right take focus from the focused node, worked out from geometry |
| orange arrow | the same, where a focusOrder names the answer |
|
Focusable |
green edge | every node focus can reach; the focused one gets a thick white edge |
| grey edge | a focusable node a focusTrap shuts out |
|
Traps |
violet wash | each focusTrap
|
HitAreas |
yellow wash | where a press lands: a click, a drag or a pointer handler, cut to the clips above it |
| red wash | a hole a hitShape, or a shaped clip on it or above it, cuts in that rectangle |
It finds the FocusManager built over its tree by itself; pass focus = when a game has
two over one tree. A test can ask the same question without drawing anything:
focus.targetOf(FocusDirection.Down) is where Down would go, and nothing moves.
An arrow is where focus goes when the focused widget lets the press through. A slider keeps Left and Right for itself until it reaches an end, and that is not drawn.
Like LayoutOverlay it has no size, takes no clicks and moves nothing. Focus moving is the
one change that can leave a screen looking the same, so while it is on a focus move marks
the frame changed. Take it off before shipping.
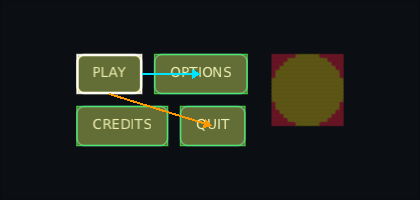
Holes are found by asking the shape in 4-unit squares, so their edges are steps.
A still screen should cost almost nothing. When one does not, RedrawOverlay shows what
is changing:
Box(Modifier.fillMaxSize()) {
    Game()
    RedrawOverlay(enabled = debug)                    // flashes fade over half a second
    RedrawOverlay(enabled = debug, holdMillis = 2000) // or longer, for something that blinks
}
Every node that changed gets a red border on the frame it changed, fading out. "Changed" means what makes a frame redraw: a new modifier chain, a new drawing lambda, a child added (the child flashes) or removed (the parent flashes), or a size or place an animation moved. A node recomposed with the same arguments as before does not flash, because it is not redrawn either. A menu standing still shows nothing; a label handed a lambda written inline flashes every time its parent recomposes.
For numbers rather than flashes, ask the frame budget for its busiest nodes:
val ui = UiRenderer(host, canvas, FrameBudget(busiest = 5))
// …or on a budget you already have
ui.budget.busiest = 5
FrameBudgetOverlay then lists the five nodes the most frames changed, most first, by test
tag (#score) or by name, with how many frames. The counts are also on every node as
node.changes, split into node.composeChanges (frames that rebuilt it) and
node.redrawChanges (frames that only redrew it — a marquee, a Spinner). A node with a
big redrawChanges and a small composeChanges is redrawing on purpose; one where both
climb together is being rebuilt as well. tree.countChanges = true turns the counting on for
a test that wants the numbers alone, budget.reset() and tree.resetChangeCounts() start
them again, and NodeTree above puts all three beside the widget they belong to.
Neither overlay marks anything changed itself, so turning them on does not make a still screen redraw. The budget's own numbers refresh four times a second on purpose and are left out of both. Counting is off until one of them asks, and costs one increment per change while on.
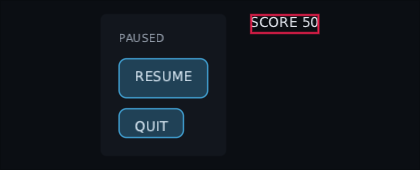
A fade only moves while the game keeps drawing. A game that skips drawing unchanged frames holds the last flash until something changes.
TextAnchor places text by its line box, its capitals or its baseline, and none of
those can be seen. TextMetricsOverlay draws them through every piece of text:
Box(Modifier.fillMaxSize()) {
    Game()
    TextMetricsOverlay(enabled = debug)                                        // all five
    TextMetricsOverlay(enabled = debug, show = setOf(TextGuide.Baseline))      // or just one
}
TextGuide |
Drawn as | What it is |
|---|---|---|
LineBox |
cyan edge | each line's box, as layout counted it — what TextAnchor.LineBox places by |
Ascent |
red line | the top of the tallest glyph |
CapHeight |
orange line | the top of a capital — what TextAnchor.CapTop places by |
Baseline |
green line | the line the letters stand on — what TextAnchor.Baseline places by |
Descent |
blue line | the bottom of the lowest glyph |
Lining a label up with an icon is then a matter of looking: put the icon's edge on the green line, not three pixels above it. Two sizes on one baseline share one green line.
Every line of a wrapped paragraph gets its own set, each as wide as that line's
glyphs, so a centred label shows its lines under its letters rather than across its
box. A scaled label shows them where it is drawn. It is the same kind of node as
LayoutOverlay — no size, no clicks, a still screen stays still — and both can be on
at once.
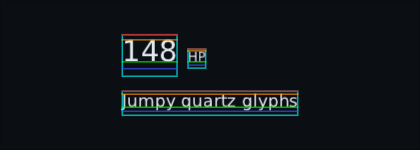
It marks Text labels, text fields — a field's lines where its words have scrolled
to, or its hint's when it is empty — typewriters, tooltips and the letter on a
PromptGlyph. A typewriter shows every line as it will stand once typed, so the
guides do not crawl along with the letters. Damage numbers and a minimap's compass
letters are not marked yet.
A frame time printed as 7.31 ms is unreadable at sixty hertz, and it says nothing about
the spike that made the game stutter a second ago. Plot draws the same numbers as a line,
where the spike is obvious:
import dev.wildware.composegl.debug.Plot
import dev.wildware.composegl.debug.rememberPlotBuffer

val frameTimes = rememberPlotBuffer(capacity = 240)

LaunchedEffect(Unit) {
    var last = 0L
    while (true) withFrameNanos { now ->
        if (last != 0L) frameTimes.add((now - last) / 1_000_000f)
        last = now
    }
}

Plot(frameTimes, Modifier.size(240f, 60f), range = 0f..33f, guides = listOf(16.6f), label = "frame")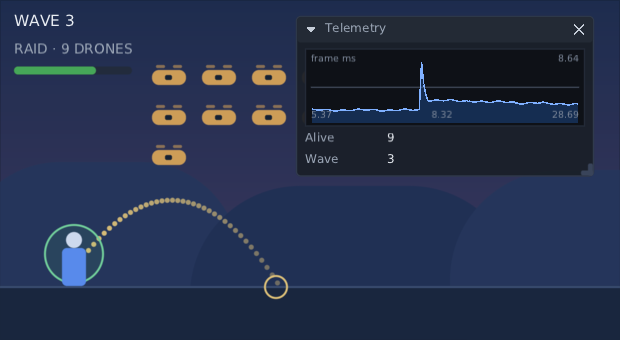
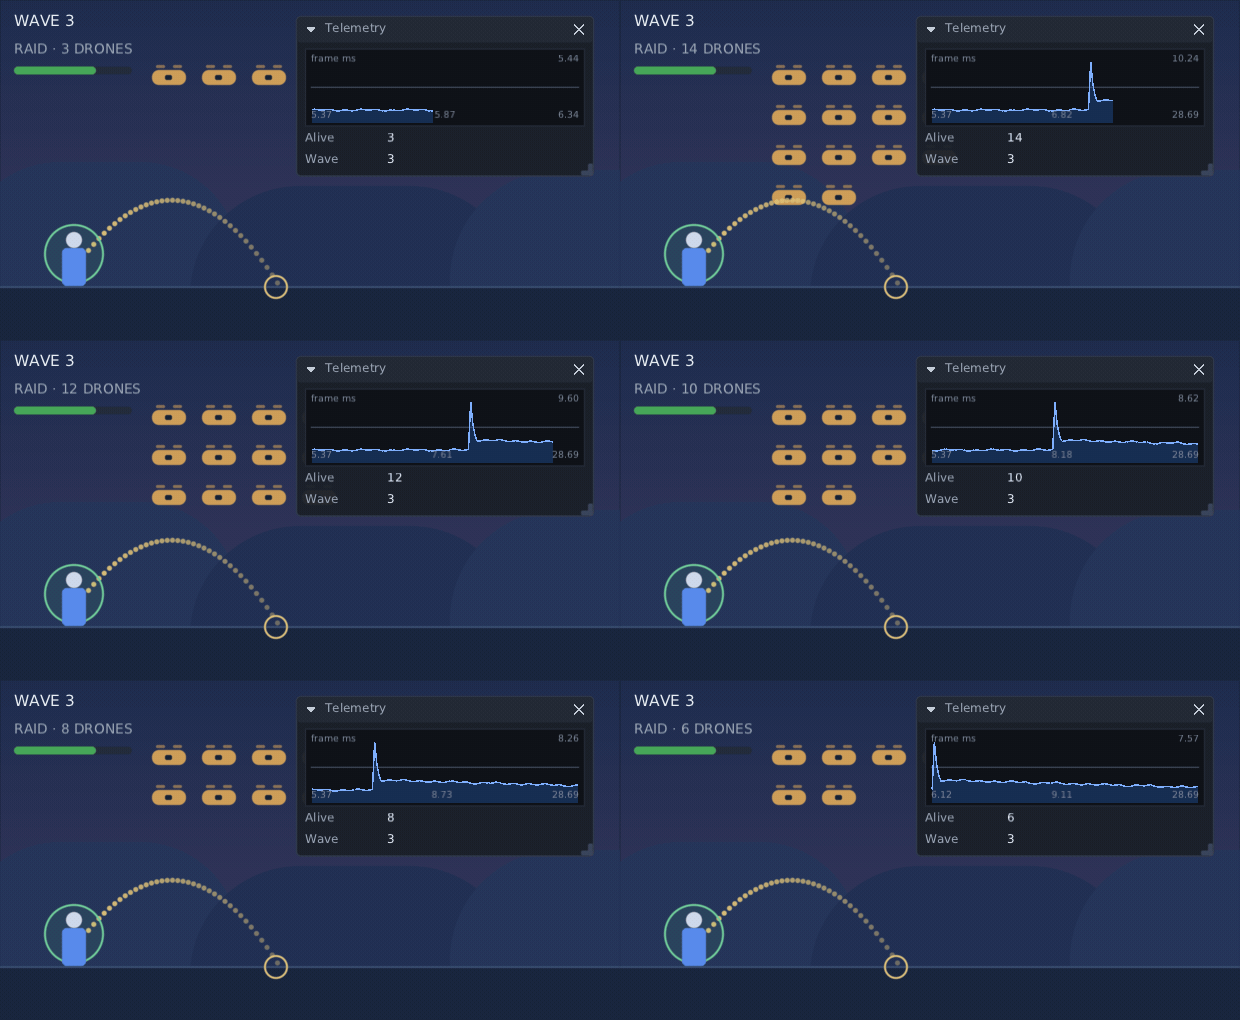
The spike in that graph is the wave of drones behind it arriving: the frame they land on really does cost what the graph says, and the count under it is the same number the scene is drawn from. An average over that second would have hidden the whole thing.
Here it is with the shutter left open — the wave lands, the graph takes the spike, and the trace carries it away to the left while the drones are shot down again:
rememberPlotBuffer is a ring of the last capacity numbers. Pushing one drops the oldest
and allocates nothing, so a plot fed every frame for an hour costs what it cost on the
first frame.
-
The range. With no
rangethe graph scales itself to what it holds, and to the valuesguidesnames, so a guide is never off the top. A fixed range is the honest one for a frame budget: a graph that rescales itself makes every frame look equally bad. A value outside the range is drawn flat against the edge rather than dropped. A series that never changes is given room either side of its value, so a steady sixty runs across the middle of the box instead of along its bottom edge, where it would read as nothing. -
Numbers that are not numbers. A
NaNor an infinity — a ping before the first reply, a ratio over a zero denominator — is left out of the range, left out of the readout, and leaves a gap in the trace, rather than taking the rest of the graph with it. Pointing at the gap itself reads-, and so does the readout of a graph holding nothing else. - Guides are the horizontal rules: a frame budget, a target latency, a threshold.
-
The readout in the corners is the smallest, the mean and the largest of what is held,
with the newest value at the top right. Of the samples, not of the range: a plot drawn
against
0f..33fstill says the frame times really were 5 to 7 milliseconds.readout = falseleaves the graph bare. -
Hovering picks out the sample under the pointer and puts its number in the corner.
focusable = truemakes the graph somewhere Tab and the pad can go as well, and then Left and Right — arrows, stick or D-pad — walk the cursor a sample at a time, Home and End jump to the ends, and Escape puts it away. -
A column a sample. A column is the width divided by the buffer's
capacity, so a buffer filling up grows from the left at a steady scale and a full one scrolls. On a right-to-left screen it runs the other way, newest on the left. - One draw call. The guides, the fill, every segment of the line and the cursor are all quads of the same kind a rectangle is, drawn one after another with nothing in between, so a graph of 240 samples is one batch rather than 240. It is also why nothing here clips: a clip flushes the batch, so the drawing holds itself inside its box by arithmetic.
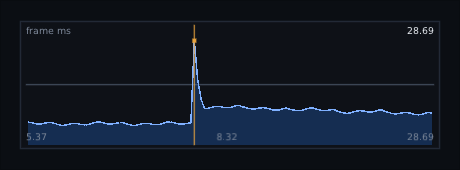
Pointing at the spike is how it gets a number put on it. The cursor is on the sample under the pointer, and the corner says what that sample was — 28.69 ms, which is also the largest of the window, written at the bottom right:
Histogram is the same thing drawn as bars, for how often rather than when — a count per
bucket, standing on zero:
Histogram(buckets, Modifier.size(240f, 60f), label = "hits per second")Both take a FloatArray as well as a buffer, for numbers something else is already keeping:
val frames = remember { FloatArray(budget.window) }
val count = budget.recentFrameMillis(frames)      // how many were written
Histogram(frames, Modifier.fillMaxWidth().height(40f), count = count)
FrameBudget.recentFrameMillis is in composegl-ui, and copies into an array the caller
already has, so asking every frame allocates nothing either.
An array is read as it stands each time the screen recomposes; a PlotBuffer counts its own
changes, so a plot of one is redrawn when a sample arrives and at no other time.
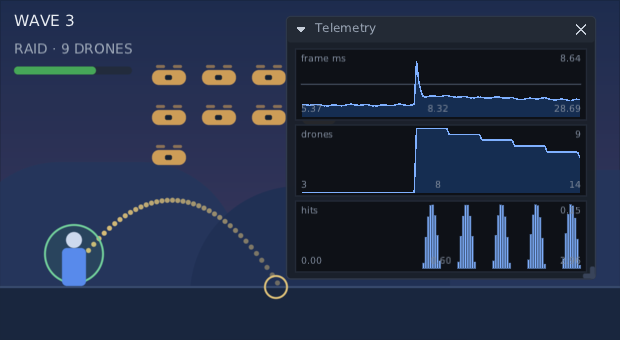
Stack as many as the question needs. These three are the same moment three ways: what the frame cost, how many drones are up, and what the guns landed. The step in the middle graph and the spike in the top one are the same wave arriving.
Everything comes from the skin, under style — "plot" by default:
| Style | What it is |
|---|---|
plot |
the box: its background, its border and the padding the readout is written in |
plot.line |
the trace, as its text colour |
plot.fill |
the wash under the trace. A skin that does not name it gets no fill |
plot.guide |
the horizontal rules |
plot.cursor |
the upright line and dot at the sample being read |
plot.bar |
a histogram's bars |
plot.label |
the label and the min, mean and max |
plot.value |
the value under the cursor |
For a graph that has to read the same over anything — one lying over the game — pass
colours = PlotColours(line = …, fill = …, guide = …, cursor = …, bar = …) and the skin is
not asked. That is what the frame budget overlay does with its own.
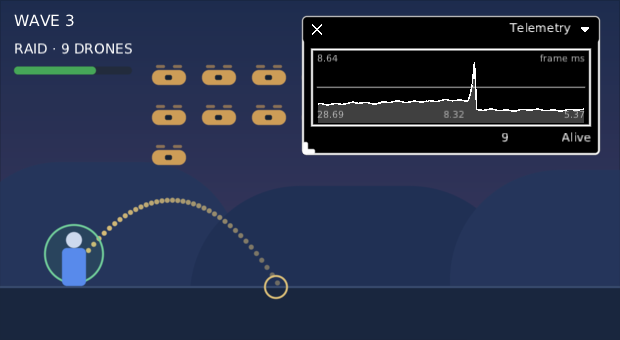
The same window in the high-contrast skin, on a right-to-left screen. Nothing was changed for it: the skin names its own colours, and the graph runs the other way because everything the toolkit lays out does, so the newest sample is on the left and the readout reads from the right.
FrameBudgetOverlay draws one under its numbers, from the budget's whole window, with a rule
across it at overMillis. An average says what a frame usually costs; the graph is where the
stutter nobody can average away is. It costs the screen no extra redraws — the overlay is
already refreshed four times a second, and each refresh draws the last hundred and twenty
frames at once. FrameBudgetOverlay(budget, graph = false) leaves it out.
The overlays use only composegl-ui's public API, so a game can write one the same way. An
overlay is a node with no size and a drawing that walks the tree. Make the drawing a
DebugOverlay, and the toolkit treats it as debug tooling: an overdraw count leaves it out, the
frame budget does not list it, and the overlays on this page leave it out of what they mark.
class Centres : DebugOverlay {
    var node: UiNode? = null

    override fun invoke(canvas: UiCanvas, content: Rect) {
        val self = node ?: return
        // Where this canvas's origin is: the root's, unless something drew the tree elsewhere.
        val dx = content.left - self.contentBoundsInRoot.left
        val dy = content.top - self.contentBoundsInRoot.top
        self.tree?.root?.forEach { node ->
            if (!node.everMeasured || isDebugOverlay(node)) return@forEach
            val centre = node.boundsInRoot.centre
            canvas.rect(Rect.of(centre.x + dx - 1f, centre.y + dy - 1f, 2f, 2f), Colour.Red)
        }
    }
}

@Composable
fun CentresOverlay(enabled: Boolean) {
    if (!enabled) return
    val centres = remember { Centres() }
    ComposeNode<UiNode, UiApplier>(
        factory = { UiNode("centres") },
        update = {
            set(Modifier.zIndex(Float.MAX_VALUE)) { this.modifier = it }   // on top of its siblings
            set(MeasurePolicy.Empty) { this.measurePolicy = it }            // no size, no clicks
            set(centres) {
                it.node = this
                this.content = it
            }
        },
    )
}
Compose it last on the screen, like the overlays above. DebugOverlay and isDebugOverlay are in
composegl-ui, so a tool like this needs no composegl-debug at all.
What a tool can read off the tree, besides the rectangles every node has:
| Read | What it is |
|---|---|
node.contentBoundsInRoot |
the content box, less padding: the rectangle its drawing is handed |
node.everMeasured |
whether layout has reached it yet |
node.drawnScale, drawnMirrorX, drawnMirrorY, isResizing
|
what the pointer search stops at |
node.changes, node.changedAtNanos, tree.clocks.frameNanos
|
what changed, and when |
tree.watchChanges(), tree.stopWatchingChanges()
|
change counting, while a tool needs it |
node.changes, node.composeChanges, node.redrawChanges
|
how many frames changed it, and which kind |
node.focusManager, focus.peek(direction), focus.reachable()
|
where focus goes, and why |
focus.addMovedListener, removeMovedListener
|
told when focus moves |
policy.linearOrientation |
a Row or Column's direction, or null |
policy as? TextGuideSource |
where a text node put its lines |
describe(element), describePolicy, describeConstraints, describePadding
|
what dump writes |