Component Stats
Component Stats reads your hardware sensors and shows live usage, temperature and power figures. It is the integration for anyone who gets asked what their specs are, or who wants their own numbers visible while in VR.
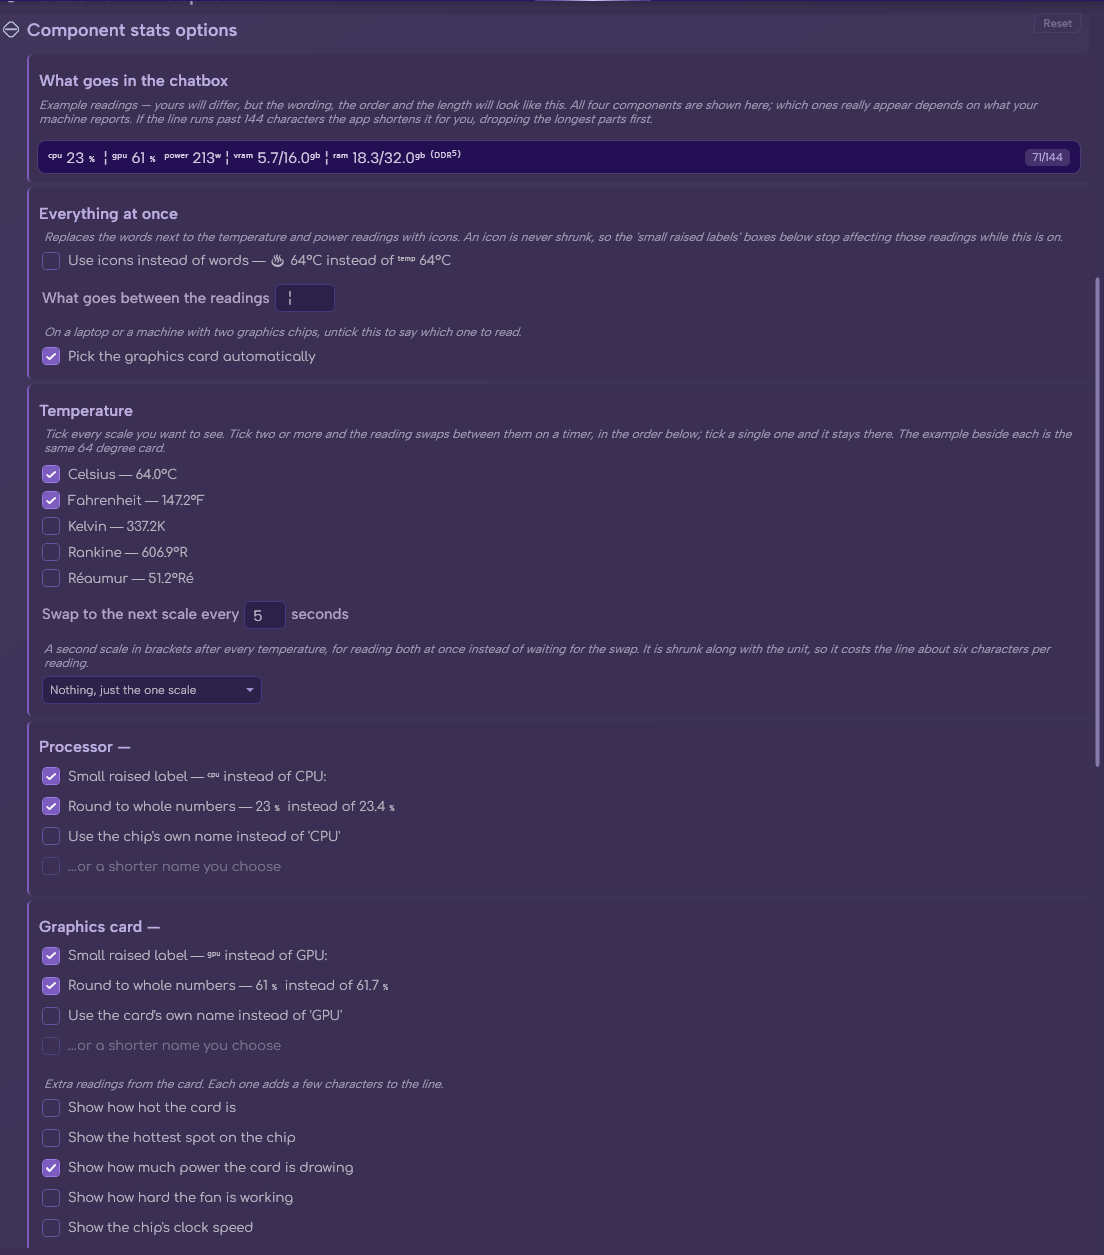
The Component stats section in Options.
See the rest of this section
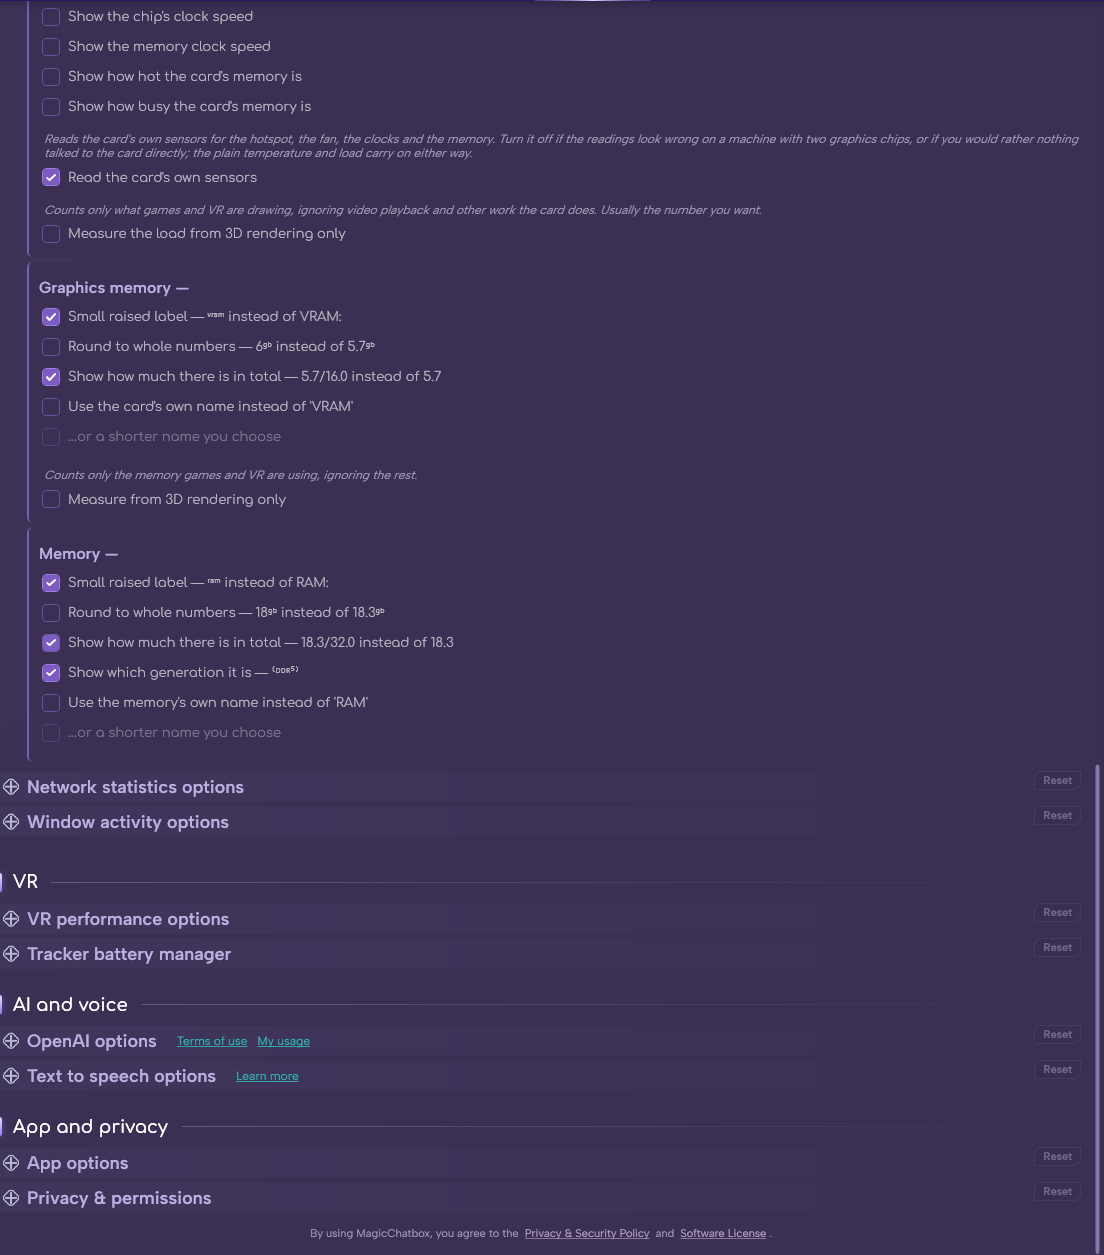
- The 🖥️ Hardware Monitor permission, which MagicChatbox asks for when you enable the integration.
- Nothing else — the sensors are read locally, with no network access.
Important
Component Stats needs the 🖥️ Hardware Monitor permission to read your sensors. Decline it and the integration switches itself back off. You can grant it later under Options → Privacy.
Note
Not every card exposes every sensor. Power draw, hotspot temperature, fan speed and memory temperature depend on what your specific GPU and its drivers report — if one stays blank, your hardware most likely does not publish it. MagicChatbox does not need administrator rights, and running it elevated will not reveal more.
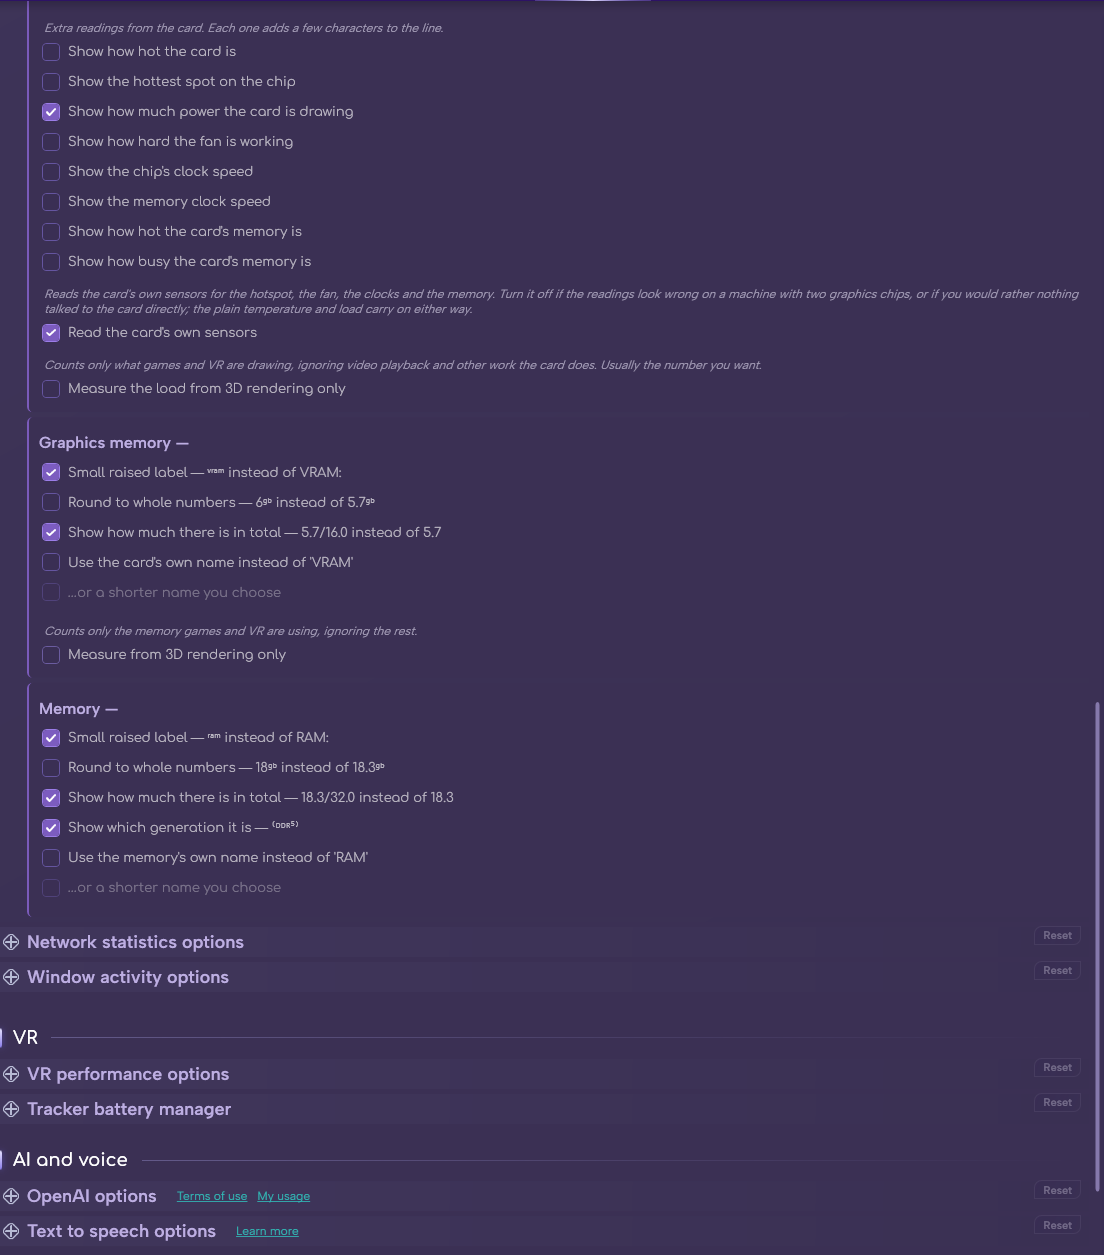
- The section has one card per component — Processor, Graphics card, Graphics memory and Memory — and each card names the hardware it found, so you always know which chip you are configuring.
-
All four share the same three wording controls:
-
Small raised label —
ᶜᵖᵘinstead ofCPU:. -
Round to whole numbers —
23﹪instead of23.4﹪. - Use the chip's own name instead of 'CPU', and …or a shorter name you choose with a Call it box for when the real name is too long.
-
Small raised label —
-
Memory adds Show how much there is in total and Show which generation it is —
⁽ᴰᴰᴿ⁵⁾. Graphics memory also has Show how much there is in total.
-
These are off by default because each one costs characters. Turn on only what you want.
- Show how hot the card is.
- Show the hottest spot on the chip — the hotspot reading.
- Show how much power the card is drawing.
- Show how hard the fan is working.
- Show the chip's clock speed and Show the memory clock speed.
- Show how hot the card's memory is — only reported by GDDR6X and some newer cards.
- Show how busy the card's memory is.
- Read the card's own sensors — uses the vendor's sensor interface for readings the generic path cannot reach.
- Measure the load from 3D rendering only — on the graphics card card.
- Measure from 3D rendering only — the same idea on graphics memory.
Note
These change which number is reported, not how it is displayed. With VRChat running, 3D-based figures are usually the ones people actually mean when they ask about GPU load.
- Five scales, each with its own checkbox, and you can tick as many as you like:
-
Celsius —
64.0°C -
Fahrenheit —
147.2°F -
Kelvin —
337.2K -
Rankine —
606.9°R -
Réaumur —
51.2°Ré
- Tick more than one and a Swap to the next scale every [N] seconds box appears — the reading rotates through your chosen scales instead of trying to show them all at once.
- Separately, a dropdown adds a companion scale in brackets, so you can print
64°C (147°F)permanently rather than rotating.
Tip
Rotating scales is the cheaper option when characters are tight — one reading, changing every few seconds. The bracketed companion costs more room but never makes anyone wait for the number they wanted.
-
Use icons instead of words —
♨️ 64°Cinstead ofᵗᵉᵐᵖ 64°C. -
What goes between the readings — default
¦. - Pick the graphics card automatically — on by default.
- Selected GPU — appears when the above is off, so you can choose the card yourself.
Tip
On a laptop with both an integrated and a discrete GPU, automatic selection prefers the discrete card. If you are seeing the wrong one — idle temperatures when you know the game is working hard — switch automatic off and pick the right card here.
-
Reading hardware sensors means opening a sensor library, which takes a moment the first time. The tile says where it is up to rather than sitting blank.
The tile shows It means starting… The sensors are coming up. No readings yet. A time, e.g. 23:05:13 When the readings were last refreshed. stopping… The sensors are shutting down after you switched it off. Nothing Switched off.
- The CPU / GPU / VRAM / RAM panel under the tile appears with the readings and goes away with them, so it is only there when there is something to show.
- You can find help in our Discord Server by creating a ticket.