Repository navigation
Tables
🌐 English · Русский
Install 0.5.1 and get the sample files.
Use tables=True to recover rows, columns and cell text from an invoice. Table recognition is off by default. Enable it when the grid matters; ordinary ocr() is enough when you only need the surrounding prose.
ocr(..., tables=True) formats detected tables as Markdown (a text table with | separators) in its returned text:
from occular import ocr

print(ocr("invoice.png", tables=True))
The input contains a bank-details table and an item table. Here we select the last returned table, the item table for this sample:
from occular import ocr_detailed

lines = ocr_detailed("invoice.png", tables=True, deskew=False)
print("Tables found:", len(lines.tables))
table = lines.tables[-1]  # the item table, after the bank-details table
print("Rows:", table["n_rows"], "Columns:", table["n_cols"])
for cell in table["cells"][:12]:
    print(cell["r"], cell["c"], cell["text"])
Actual output (header and first body row):
Tables found: 2
Rows: 5 Columns: 6
0 0 №
0 1 Товары (работы, услуги)
0 2 Кол- во
0 3 Ед.
0 4 Цена
0 5 Сумма
1 0 1
1 1 Транспортно-экспедиционные услуги по маршруту Нижний Новгород — Казань
1 2 4
1 3 рейс
1 4 18 500,00
1 5 74 000,00
Row 1, column 2 contains quantity 4; column 4 contains unit price 18 500,00; column 5 contains total 74 000,00. The row and column indices preserve their relationship. Compare them with this enlarged source crop: the header and first body row, from quantity through total.
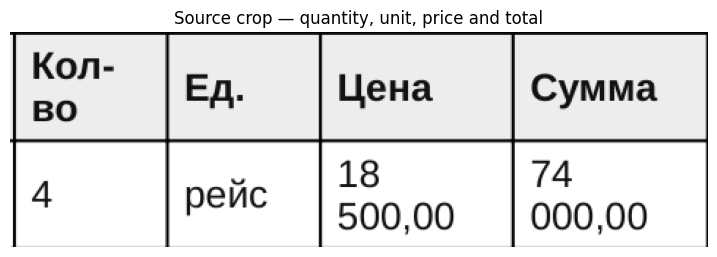
This is a 5-row × 6-column structure. Deskew is disabled to keep crop coordinates aligned with the original input. With another document, inspect the returned boxes rather than assuming the item table is last.
The text-only API formats that structure as Markdown. This selects the same header/body row from the real ocr() result:
from occular import ocr

text = ocr("invoice.png", tables=True, deskew=False)
print("MARKDOWN — item header and first body row")
for row in text.splitlines():
    if row.startswith("|") and ("Товары" in row or "Транспортно" in row):
        print(row)
MARKDOWN — item header and first body row
| № | Товары (работы, услуги) | Кол- во | Ед. | Цена | Сумма |
| 1 | Транспортно-экспедиционные услуги по маршруту Нижний Новгород — Казань | 4 | рейс | 18 500,00 | 74 000,00 |
Markdown keeps row/column positions but flattens cell spans. Use structured .tables when your app needs those spans.
Open the real Jupyter run (all code visible)
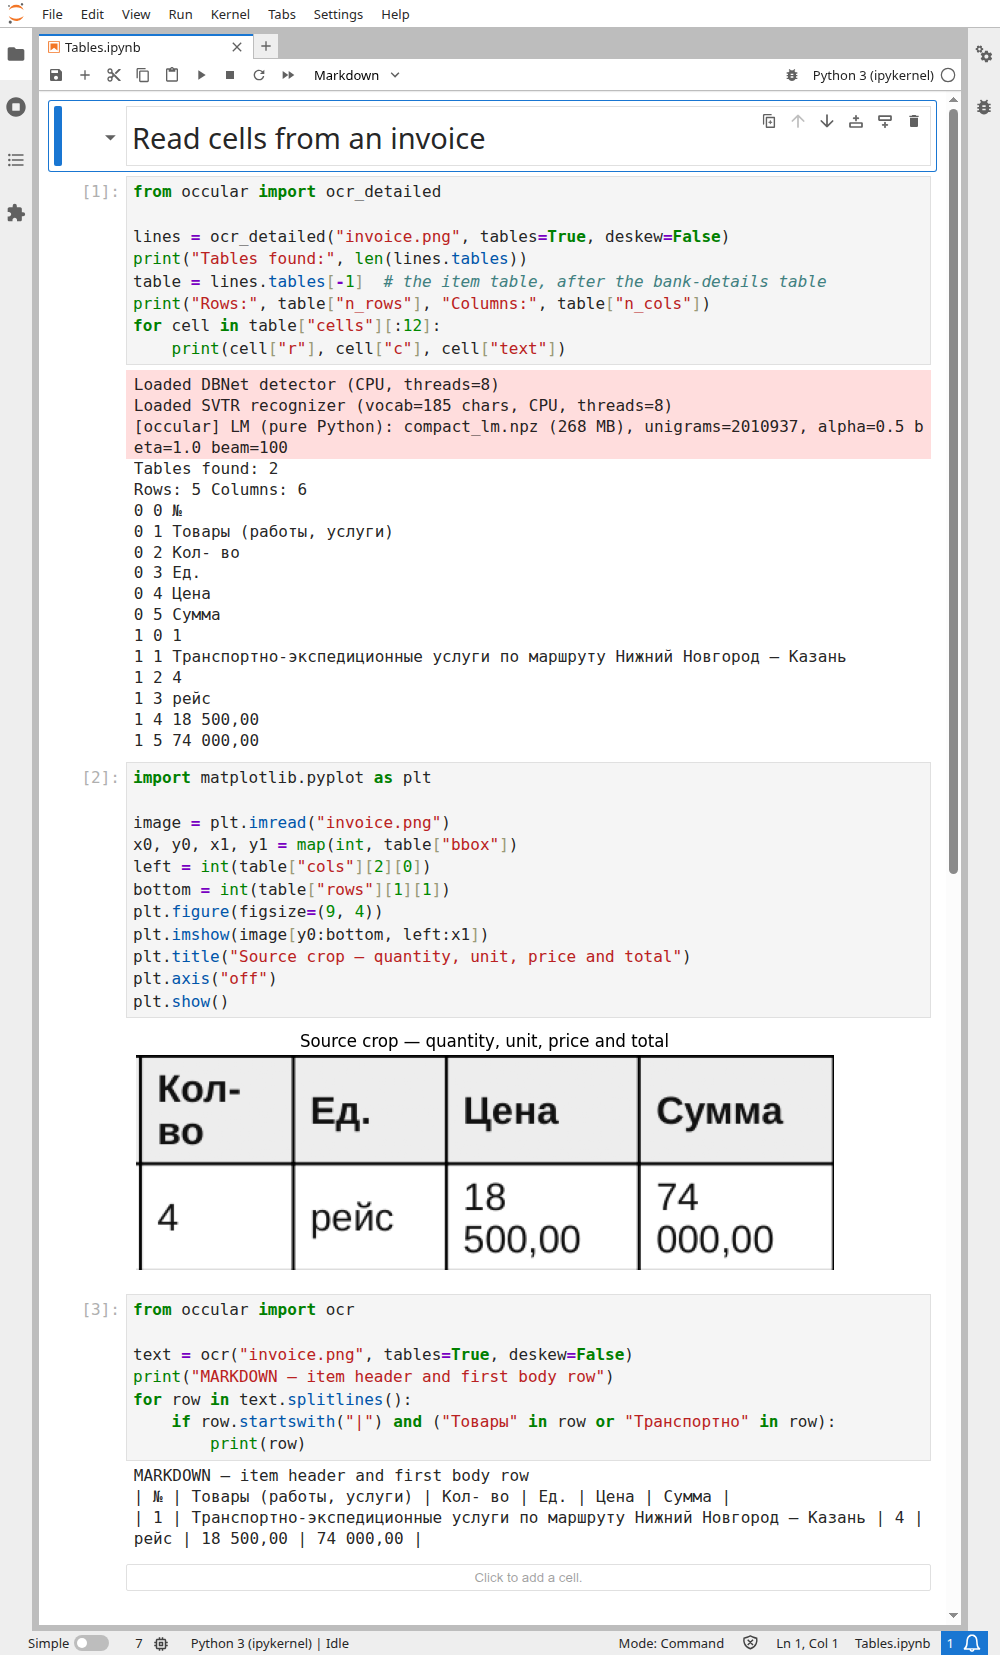
Download notebook · invoice.png
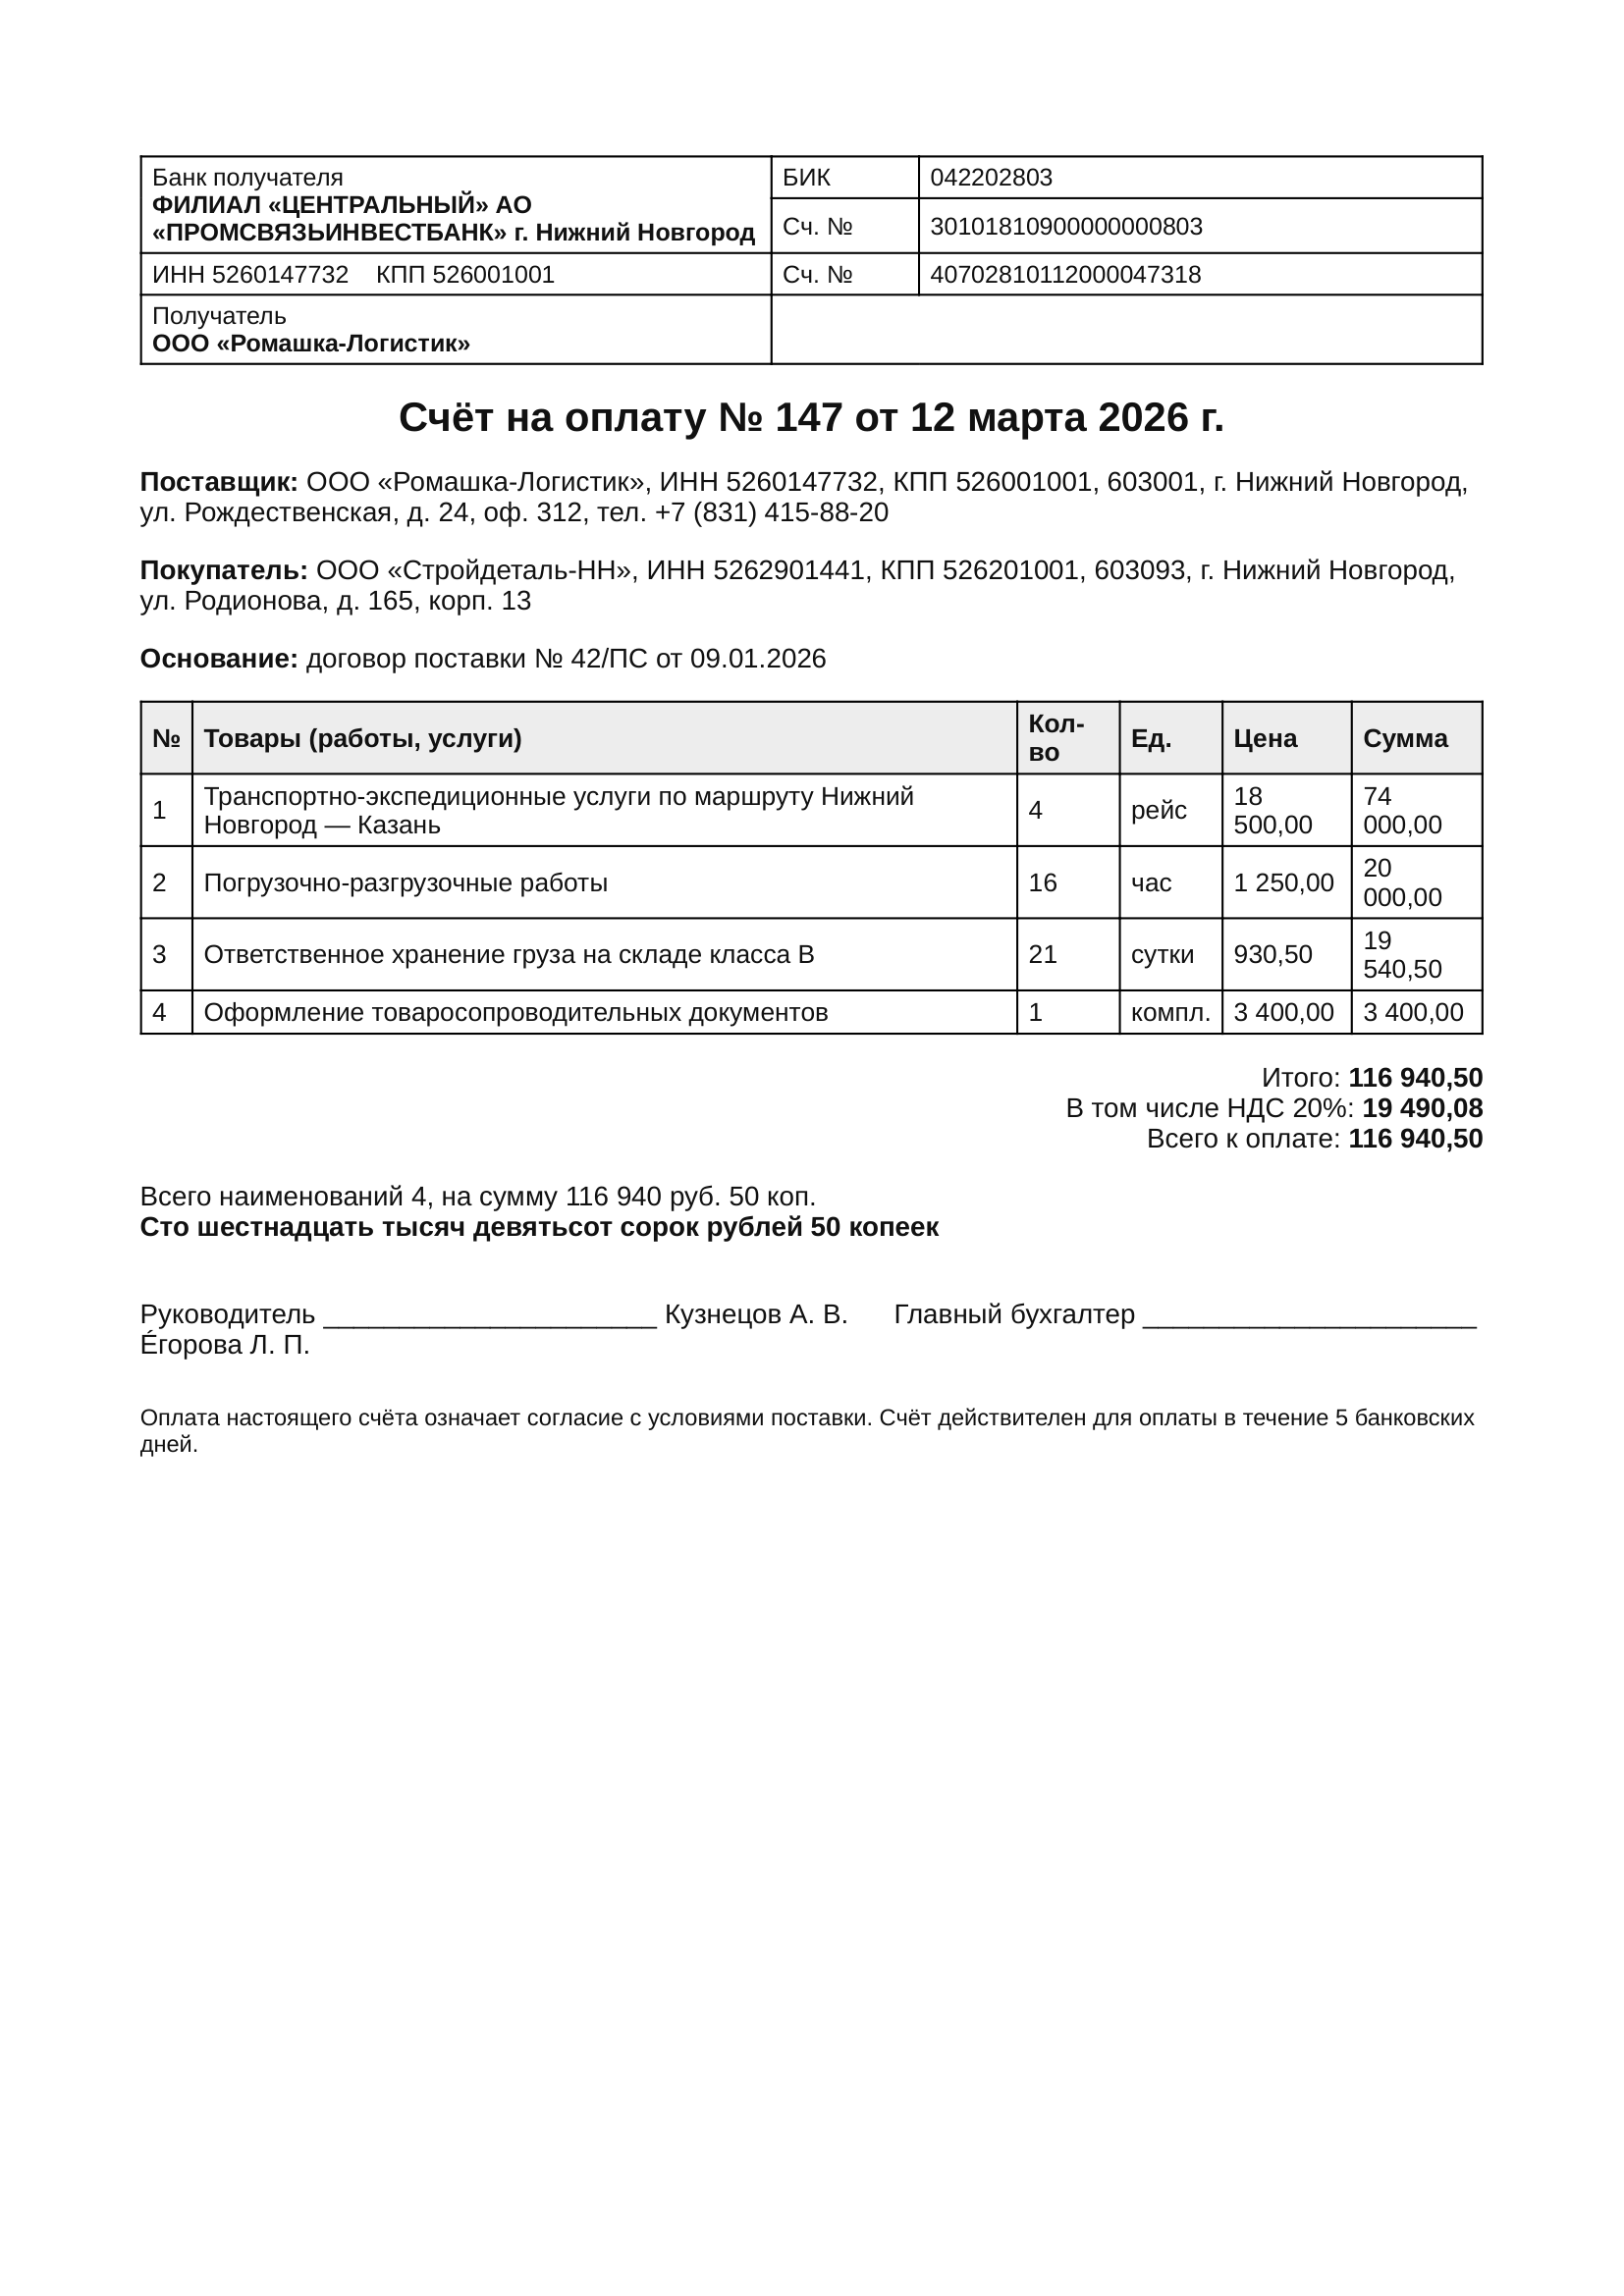
from occular import ocr_detailed

lines = ocr_detailed("invoice.png", tables=True)
for table in lines.tables:
    for cell in table["cells"]:
        print(cell["r"], cell["c"], cell["text"])
r is the row number and c is the column number. Both start at 0. A cell spanning several rows or columns also has rowspan and colspan.
Check merged headings and totals. A detected table can still have an incorrect grid or text assigned to the wrong cell.
PDFs, merged cells and JSON export
For images, lines.tables holds the tables. For PDFs, each page has its own page["tables"] list.
Markdown and CSV cannot preserve merged-cell structure. Keep JSON when the spans matter. Also, json.dumps(lines) drops the image result's .tables attribute: use this JSON recipe.