Training Build a Weather Lookup Screen V3 Watched Locations
Weather Lookup series · Part 3 of 3 · Level: Advanced. ← Part 1 — Build the Screen (beginner) · Part 2 — Store the Readings (intermediate). This is the capstone: a model relation, a scheduled loop, a conditional alert, input validation, and a chart.
Add-on to Training: Weather Lookup V2 — Store the Readings. Build V1 and V2 first — this picks up where V2 left off and assumes you have the working
Weather APIconnection, the deployedWeatherReadingmodel, and theWeather Lookupscreen with its history table.
What you'll learn: how to turn the manual, one-ZIP-at-a-time lookup into a hands-off monitoring system — define the places you care about in their own model, relate their readings back to them, and run a scheduled flow that loops every watched location, captures the weather, stores it, and raises an alert when a location is over its temperature threshold. You'll also add input validation so only real ZIPs get saved, and a trend chart so the stored history is something you can actually read.
You need: Administrator or Developer access type. V1 and V2 completed. Time: 60–75 minutes.
In V2 a user types a ZIP, the flow looks it up, upserts a WeatherReading (deduped by zip|date), and the screen shows the saved history in a table. It's persistent, but still manual — someone has to open the screen and type a ZIP for anything to get captured, and nothing happens with the numbers once they're stored.
ZIP ─▶ Source ─▶ Set Context ─▶ HTTP ─▶ reshape ─┬─▶ Response (weather → screen)
                                                  └─▶ Mutate (UPSERT WeatherReading, key = zip|date)
V3 adds four things:
- A
WatchedLocationmodel — the list of ZIPs you want monitored, each with its own alert threshold. - A relation so every
WeatherReadingpoints back to theWatchedLocationit came from. - A scheduled System flow that, with no one watching, queries the active watched locations, loops each one, fetches its weather, upserts the reading (linked to the location), and logs a heat alert when the temperature crosses the location's threshold.
- The supporting polish: ZIP validation on the watched-location form, and a temperature trend chart on the Weather screen.
(cron 6 AM)
  Source ─▶ Get Active Locations ─▶ Extract Locations ─▶ Broadcast ─┐
                                                                    │  (one message per location)
  ┌─────────────────────────────────────────────────────────────────┘
  └▶ Stash Location ─▶ Get Weather ─▶ Build Reading ─┬─▶ Upsert Reading (WeatherReading + FK)
                                                     └─▶ Over Threshold? ──true──▶ Heat Alert (log)
A watched location is setup data — a short list a user maintains, not a transactional stream — so model it as a Master type.
-
Create the model. App Designer → Data Model → New Model: Name
WatchedLocation, ModuleTraining Module, TypeMaster. Add these fields:Field Type Notes zipString!the ZIP to watch — Required labelStringa friendly name, e.g. "Beverly Hills" alertThresholdFIntraise an alert when the captured temp is at or above this activeBooleanonly active locations get captured — lets you pause one without deleting it Save the model before you do anything else. (Lesson from the build: if you start adding a model on the Schema Designer canvas and then open a different model before saving, the canvas is one-model-at-a-time and your unsaved model is discarded. Save first, navigate second.)
-
Relate the two models. With both
WatchedLocationandWeatherReadingon the canvas, drag fromWeatherReading's connector handle ontoWatchedLocationand choose Many-To-One (many readings belong to one location). Fuuz creates:- on
WeatherReading: a foreign-key fieldwatchedLocationIdplus awatchedLocationreference, - on
WatchedLocation: a reverse collectionweatherReadings.
This is the same Many-To-One pattern from Relate Two Data Models —
WeatherReadingis the "many" side that carries the FK. - on
-
Save and deploy both. Saving the relation bumps
WeatherReadingto a new version (v2). Click the deploy/upload icon — Fuuz prompts "Deploy 2 data models?" because the relation touches both. Confirm. Both deploy together so the FK is usable by the flow and the API.
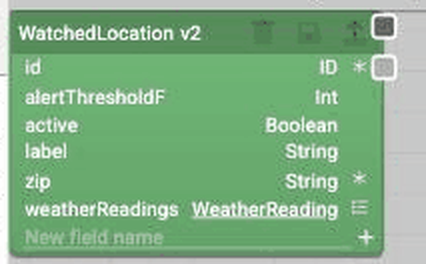
Why a separate model instead of just a list of ZIPs in the flow? Because the threshold travels with the location. Beverly Hills alerts at 80°F, Miami at 88°F — that's per-place configuration a non-developer can edit in a screen, not something hard-coded in a flow.
You need at least one active location for the flow to have something to do. The quickest way is the GraphQL API Explorer (Schema & GraphQL → API Explorer). Note the create payload wraps the fields under a create: key:
mutation SeedWatchedLocations {
  createWatchedLocation(payload: [
    { create: { zip: "90210", label: "Beverly Hills", alertThresholdF: 80, active: true } },
    { create: { zip: "33139", label: "Miami Beach",   alertThresholdF: 88, active: true } }
  ]) { id zip label alertThresholdF active }
}
(Once you build the form in Part 4, you'll add locations through the UI instead.)
This is a System flow (backend, no screen), built in App Designer → Data Flow → New Flow: Module Training Module, Environment Backend, Type System. Name it Weather Auto-Capture.
The whole flow is one chain with a fan-out at the end. Drag each node from the Toolbox and wire output-port → input-port. Save early (File → Save names the flow) so you don't lose work.
-
Source (Toolbox → Debugging → Source). The entry point. No config — it's just the trigger the schedule (or the manual ▶ button) fires.
-
Get Active Locations (Fuuz → Query). Fetches the locations to process:
{
  watchedLocation(where: {active: {_eq: true}}) {
    edges { node { id zip label alertThresholdF active } } }
}
API =
Application. -
Extract Locations (Scripts → JSONata). The query returns a connection; pull out the plain array of nodes so the next node can iterate it:
watchedLocation.edges.node -
Broadcast (Flow Control → Broadcast). This is the for-each. Given an array, it emits one message per element — so everything downstream runs once per location. No config; it iterates whatever array it receives.
-
Stash Location (Context → Set Context). The next node (the HTTP call) replaces the payload with the weather response, so the location's
id/zip/alertThresholdFwould be lost. Stash the whole location in context first:{ "loc": $ }Set Context writes
context.locand passes the payload through unchanged. -
Get Weather (Integration → HTTP). Connection =
Weather API(the wttr.in connection from V1), Method =Get. Toggle the Path to expression mode (</>) and read the ZIP back out of context:"/" & $state.context.loc.zip & "?format=j1" -
Build Reading (Scripts → JSONata). Reshape the wttr.in
j1response into a clean reading, pulling the location fields back from context and casting the API's string numbers:( $c := current_condition[0]; $a := nearest_area[0]; $loc := $state.context.loc; $date := $substringBefore($now(), "T"); { "key": $loc.zip & "|" & $date, "zip": $loc.zip, "date": $date, "watchedLocationId": $loc.id, "alertThresholdF": $loc.alertThresholdF, "tempF": $number($c.temp_F), "feelsLikeF": $number($c.FeelsLikeF), "humidity": $number($c.humidity), "windMph": $number($c.windspeedMiles), "windDir": $c.winddir16Point, "conditions": $c.weatherDesc[0].value, "location": $a.areaName[0].value, "region": $a.region[0].value } )Note it carries
watchedLocationId(so the reading links to its location) andalertThresholdF(so the threshold check downstream has it).alertThresholdFis not aWeatherReadingfield — it just rides along for the conditional and is dropped before the upsert.Build Reading fans out to two nodes — connect its output port to both Upsert Reading and Over Threshold?.
-
Upsert Reading (Fuuz → Mutate). Same dedup upsert as V2, now also writing the FK:
-
Mutation:
mutation ($payload:[WeatherReadingUpsertPayloadInput!]!){
  upsertWeatherReading(payload:$payload){ id key }
}
-
Variables Transform:
The
{ "payload": [{ "where": { "key": key }, "create": { "key": key, "zip": zip, "date": date, "watchedLocationId": watchedLocationId, "location": location, "region": region, "conditions": conditions, "windDir": windDir, "tempF": tempF, "feelsLikeF": feelsLikeF, "humidity": humidity, "windMph": windMph }, "update": { "watchedLocationId": watchedLocationId, "location": location, "region": region, "conditions": conditions, "windDir": windDir, "tempF": tempF, "feelsLikeF": feelsLikeF, "humidity": humidity, "windMph": windMph } }] }{where, create, update}shape is exactly whatWeatherReadingUpsertPayloadInputexpects (you can confirm the shape in the API Explorer's Documentation Explorer — the samecreate:-wrapped structure you saw when seeding locations).alertThresholdFis deliberately left out — it isn't a model field.
-
Mutation:
-
Over Threshold? (Conditionals → If Else). Condition:
(alertThresholdF != null) and (tempF >= alertThresholdF)The null guard means a location with no threshold set never alerts.
-
Heat Alert (Debugging → Log), wired off the True port. Level =
Warn, Message Transform:"HEAT ALERT: " & location & " (" & zip & ") is " & $string(tempF) & "F, over threshold of " & $string(alertThresholdF) & "F"This is intentionally a log, not a notification — it proves the branch fires without sending anything. Swapping the Log node for a System Email or Notification node is the natural next step (and is covered by Create a Notification Channel).
Save, then deploy (File → Deploy, or the upload icon). A System flow must be deployed before a schedule can run it.
Scroll to the Source node and click its orange trigger button to run the flow once. Watch the Console — it prints a per-node trace (input, output, context for every node). With two active locations you'll see the chain run twice past the Broadcast: Extract Locations outputs an array of 2, Broadcast emits each, Get Weather returns live current_condition/nearest_area, Build Reading produces { key: "90210|YYYY-MM-DD", … }, and Upsert Reading returns upsertWeatherReading records. If Get Weather errors, check the Path expression and the Weather API base URL; if Upsert Reading errors, re-check the variables shape against WeatherReadingUpsertPayloadInput.
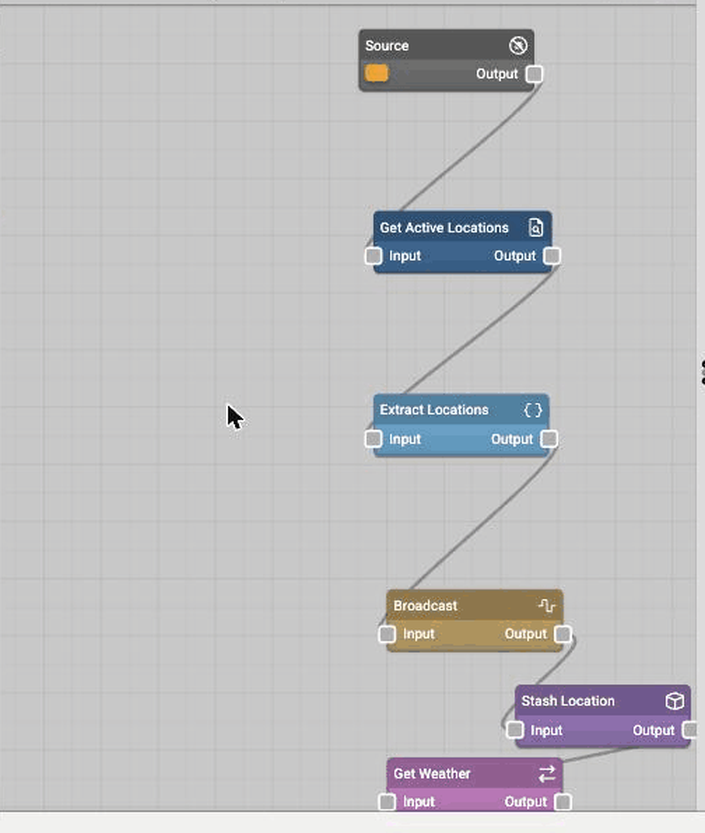
The full node chain (saved layout): Source → Get Active Locations → Extract Locations → Broadcast → Stash Location → Get Weather → Build Reading → Upsert Reading / Over Threshold? → Heat Alert.
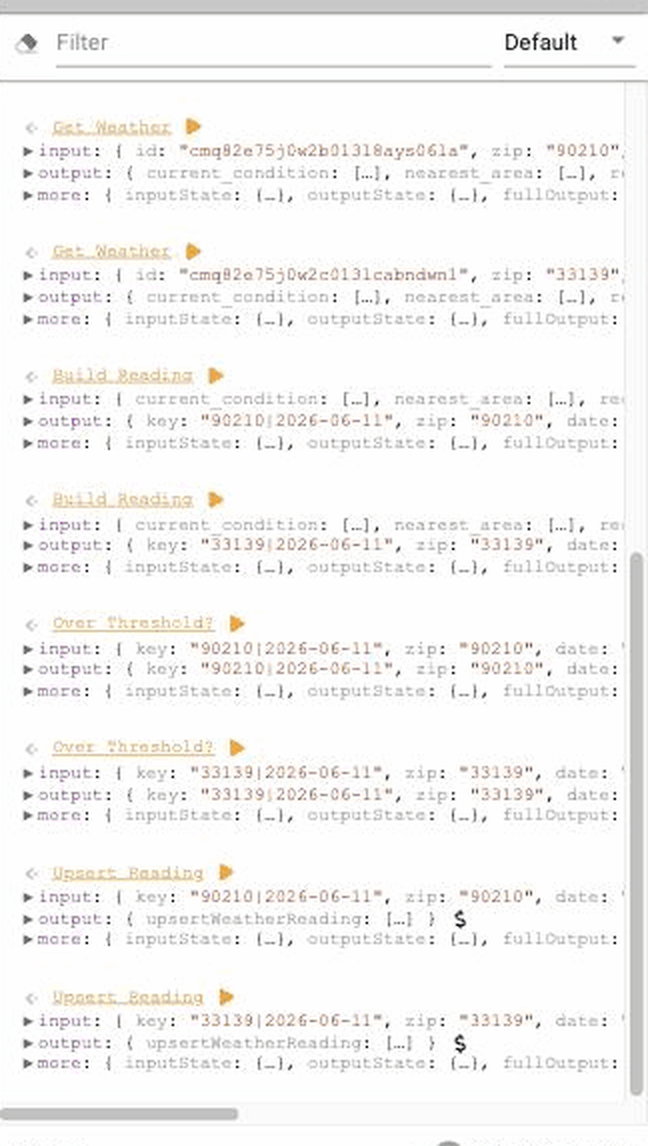
The Console after one run — each node logged twice (once per active ZIP): Get Weather, Build Reading, Over Threshold?, and Upsert Reading all fired for both 90210 and 33139.
The Console trace is your best debugging tool. Every node logs what it received and returned, so you can see exactly where
context.locis set, what the reshape produced, and whether the threshold branch went true or false.
A System flow doesn't run on its own — you attach a Flow Schedule.
- Open Orchestration → Data Flow Schedules Editor (or header Search "Flow Schedule").
- Click + to create a schedule: Name
Weather Auto-Capture Daily, Data Flow =Weather Auto-Capture, leave Active checked, Input SchemaAny. Save. - Select the new schedule (the magnifier in its row) to load Schedule Frequencies, then + to add one: Name
Every morning 6 AM, Schedule TypeCron, Schedule0 6 * * *. Save.
The frequency row shows a green Valid check and an Estimated Next Execution — that's your confirmation the cron parsed. From now on the flow runs every morning and builds history with nobody opening a screen. (Set the Timezone field on the frequency if you want 6 AM local rather than UTC.)
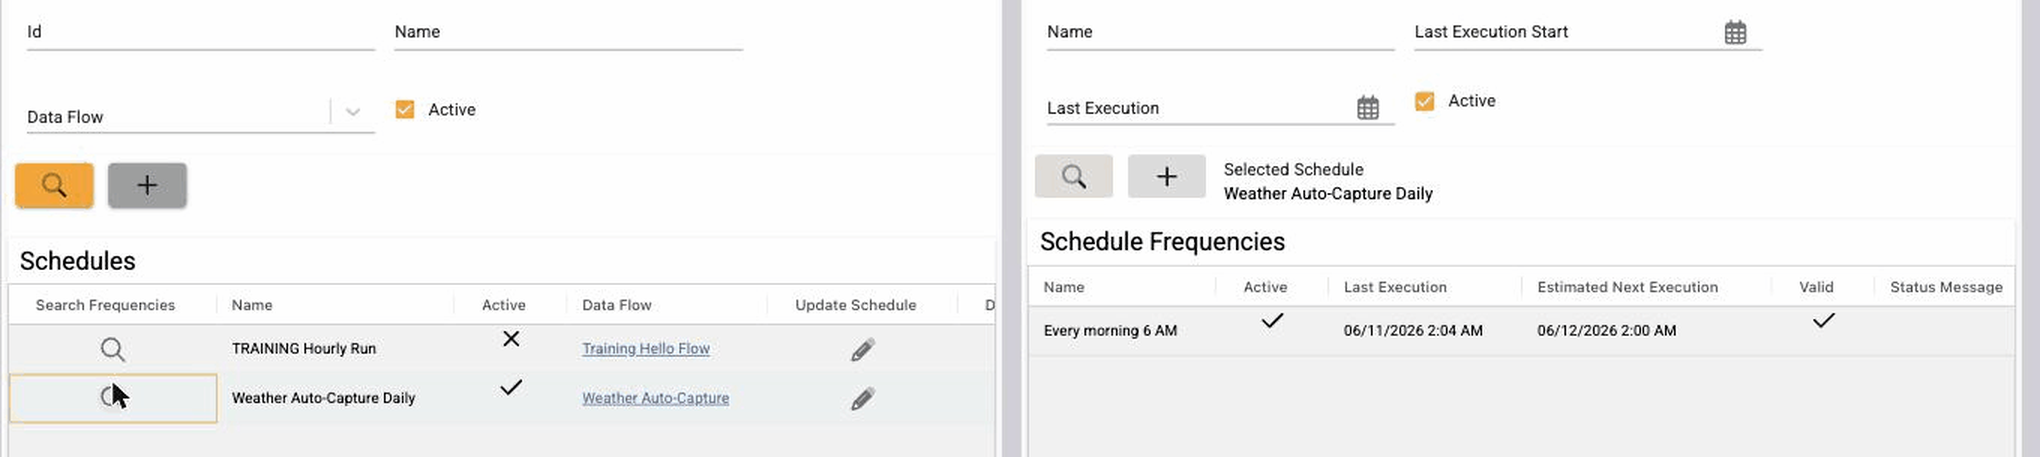
The schedule's frequency row — Every morning 6 AM, Active and Valid, with a Last Execution timestamp showing it has already fired.
See Schedule a Data Flow for the full tour of the schedules editor.
A watched location is worthless if someone fat-fingers the ZIP, so enforce a real 5-digit ZIP. The cleanest place is the model field itself — validation there protects every form bound to the model and the API, not just one screen.
- Open the
WatchedLocationmodel (App Designer → Workspace → Training Module → Data Models →WatchedLocation). - Click the
zipfield, then the Validation tab in the field properties. - In the JSON Schema editor, enter a pattern that requires exactly five digits:
(
{"type":"string","pattern":"^[0-9]{5}$"}Min Length/Max Lengthof 5 would also work, but the pattern is precise — digits only.) -
Save the model (this creates
WatchedLocationv2) and Deploy it. No data migration is needed — adding a validation pattern isn't a breaking change.
Verify it. In the API Explorer, try to create a bad one:
mutation { createWatchedLocation(payload: [
  { create: { zip: "abc", label: "Bad ZIP test", active: true } }
]) { id zip } }
It's rejected: "data must match pattern \"^[0-9]{5}$\"" (the error's extensions.fuuz.validation block points at schemaPath "#/pattern"). A valid "90210" saves fine.
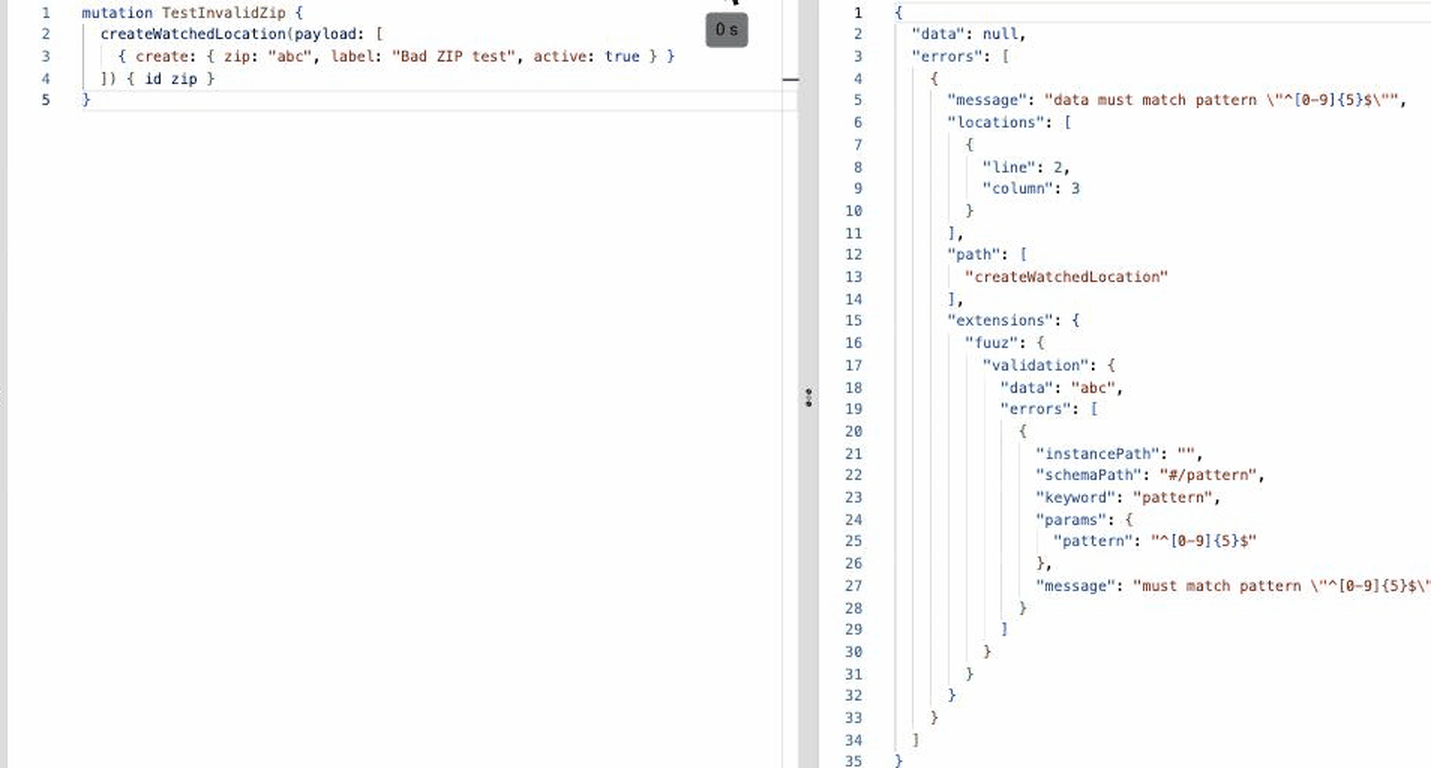
The mutation (center) and the rejection (right) — the pattern validation fires at the API, so it protects every form bound to the model.
Field-level vs element-level validation. Model-field validation (what we did) applies everywhere — the API, the flow's upserts, and any generated form. If you only want to validate one specific form, you can instead put the rule on that screen's
zipinput element. For a value users maintain in multiple places, the model is the right home.
To let users maintain the list through a UI, generate a form+table screen from the model and expose it with a route — see Generate a Screen from a Data Model and Expose a Screen with Routes and Menus. The model-level ZIP rule fires automatically on that form.
The V2 history table is accurate but hard to read at a glance. Add a chart to the Weather screen that plots tempF over date.
- Open the Weather Lookup screen in the screen designer (Workspace → Training Module → Screens →
Weather Lookup). - From the Elements palette, open Display and drag a Chart onto the canvas below the history table.
- With the chart selected, under Chart Configuration click "Click here to configure this Chart." A 5-step wizard opens:
- 1 · Chart Type — choose Line (under Single Series).
-
2 · Data Model — API
Application, Data ModelWeatherReading. -
3 · Configure Data — tick
datein the Label Field column (the X axis) andtempFin the Value Field column (the Y axis). The live preview renders as soon as both are set. -
4 · Filter & Sort — add a Sort By stage on
date, ASC, so the line reads left-to-right, and add the rolling-window filter below. (The chart shows all watched ZIPs as one trend; see "Why the chart can't filter to the ZIP you type" for why a per-entry filter doesn't work here.) -
5 · Configure Chart — Caption
Temperature Trend, X Axis LabelDate, Y Axis LabelTemp F. Save (the disk icon).
- Save the screen and Deploy it. (On deploy, Fuuz asks "create a route first?" — the Weather Lookup screen already has its V1 route, so cancel that prompt; the existing route still serves the updated screen.)
The chart renders the stored readings as a line — with the scheduled flow running daily, the trend fills in over time without anyone touching the screen.
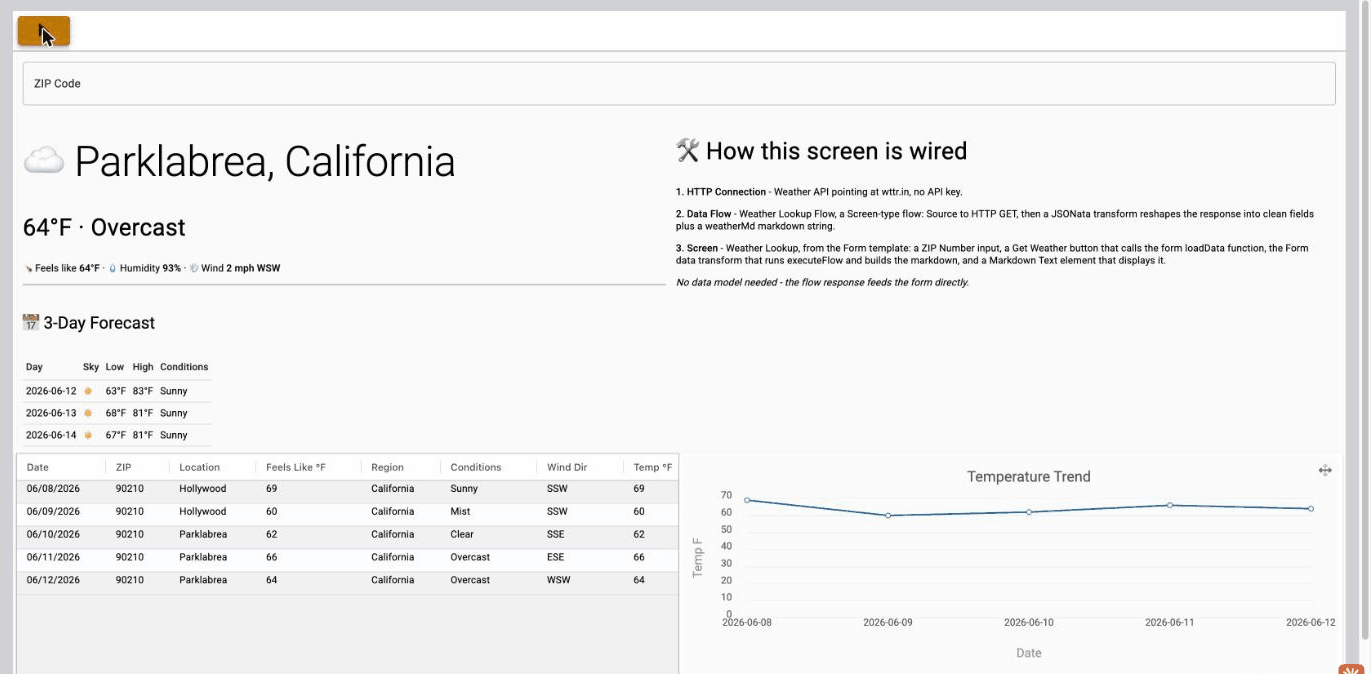
The deployed screen. The weather result (and the "How this screen is wired" panel) sit at the top, with the history table and the Temperature Trend line chart below — the chart plots tempF over date from the stored WeatherReading history and refreshes after each lookup.
Arrange the layout to taste. Where the result, table, and chart sit is up to you — drag the containers in the designer to reorder them. A common, friendly arrangement (shown above) puts the weather result at the top so it's the first thing the user sees, with the history table and chart below. The wiring is identical regardless of order; only the container layout changes.
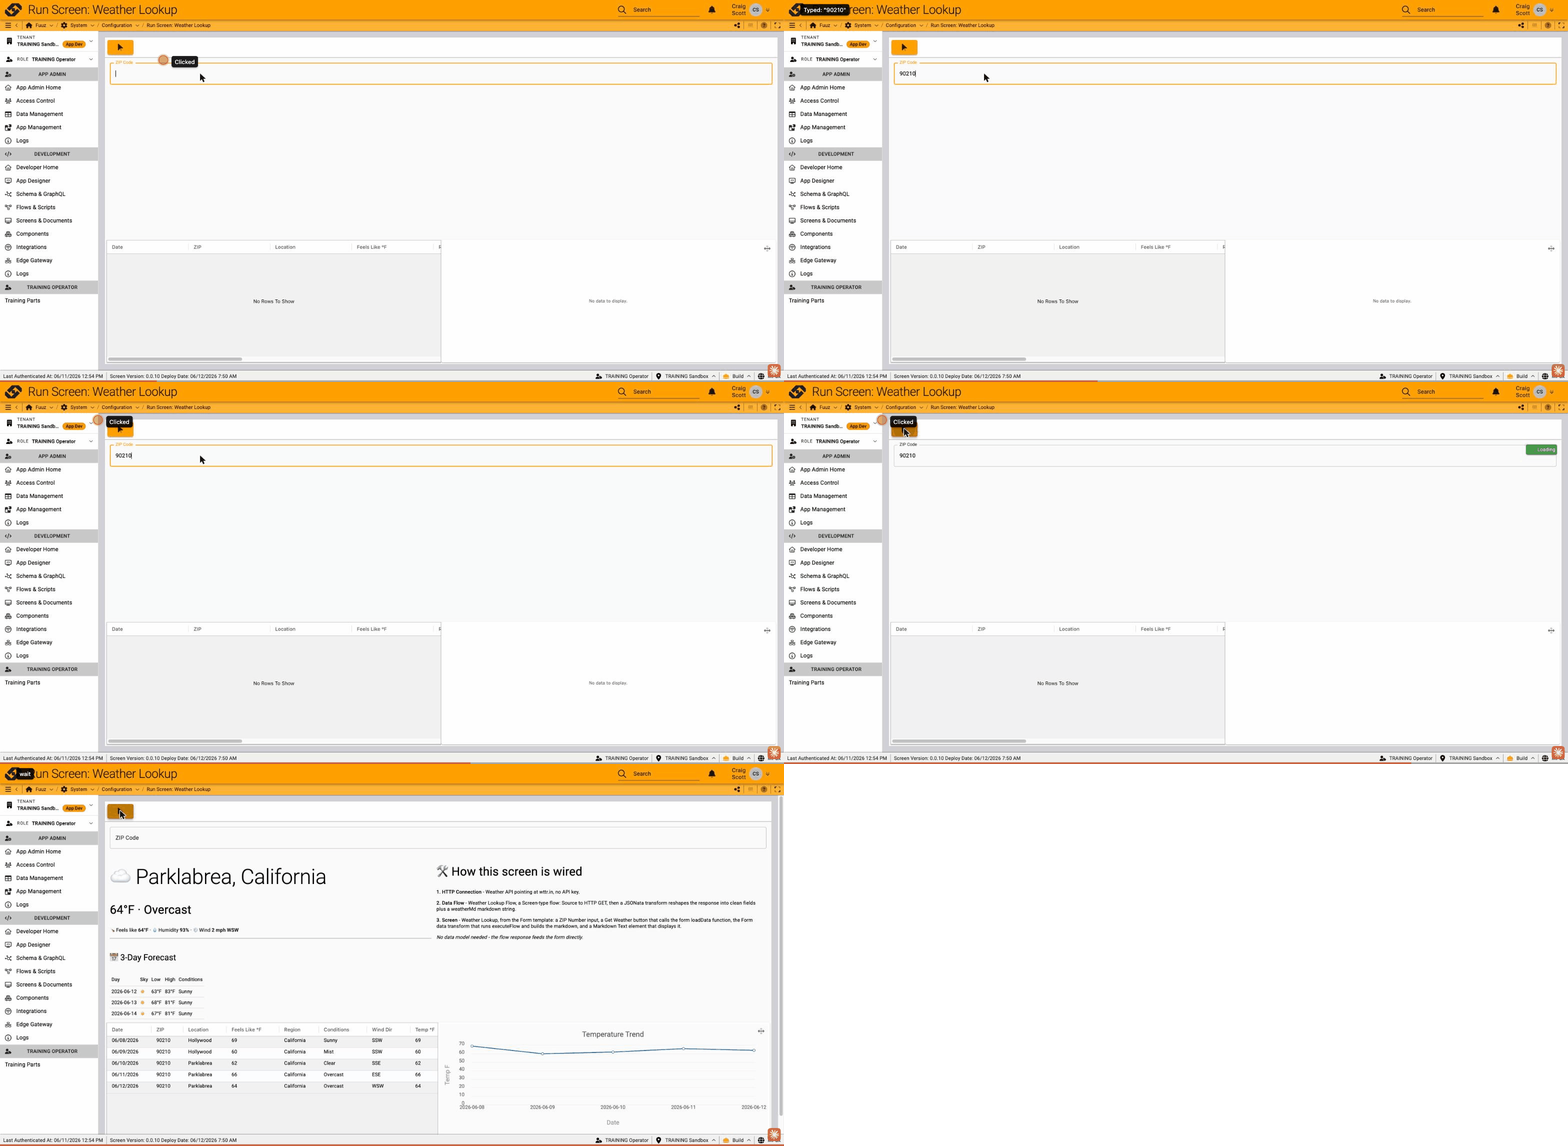
The finished screen in action: enter a ZIP, click Get Weather, and the weather result, the deduped history table, and the rolling Temperature Trend chart all refresh from the single lookup.
With the scheduled flow writing every day, an unfiltered chart grows forever and gets unreadable. Bound it to a rolling window so it always shows just the last 7 days, no matter when it's opened. In the wizard's Filter & Sort step:
- Click + RULE, set the field to
Dateand the operator toafter(this maps to adate >= …predicate). - On the value, click the
</>toggle to switch it from a date-picker to a JSONata expression, and enter:This is "now, minus 7 days, formatted as$substringBefore($fromMillis($toMillis($now()) - 7 * 86400000), "T")YYYY-MM-DD" — the same date format the flow stores.$toMillis($now())is the current epoch ms; subtract7 * 86400000(7 days);$fromMillis(...)turns it back into an ISO timestamp;$substringBefore(…, "T")keeps just the date. Because the value is an expression, it re-evaluates every time the screen loads — the window is always relative to today, never a hard-coded date. - For a 10-day window, change the
7to10. For a>=that includes exactly 7 days ago, theafteroperator (_gte) already does that.
Save the chart config (disk icon), then Save + Deploy the screen. The chart now self-trims to the last week as new readings arrive.
Two gotchas worth knowing. (1) The value must be an expression (
</>on) — a plain date-picker value can't be relative. If the expression field is left empty you'll see "Date cannot represent an invalid date-string" in the preview. (2) When you're done editing the expression, click the wizard's save icon — don't pressCtrl/Cmd+AthenDeletewhile focus is on the canvas instead of the editor, or you'll delete the selected chart element (recoverable with Undo).
Going further. For a richer, fully custom visualization (multiple locations on one chart, a threshold reference line, gauges), the fuuz-html-dashboards pattern — a backend flow that builds an HTML data-URI rendered in an embedded-webpage element — is the production approach.
A reasonable next thought: "the screen takes a ZIP — can the chart show only that ZIP's line?" You'd add a second Filter & Sort rule, Zip equals <the entered ZIP>, and wire Get Weather to reload the chart ($components.Chart1.fn.loadData()). It looks right, but the chart keeps showing every ZIP. Here's why, and it's worth understanding:
A chart's query filter runs server-side, where the screen's live form values don't exist. The chart fetches its data with a backend query, and the filter predicate is evaluated as part of that query. Server-side it can see server-evaluable things — a literal, $now(), $metadata.urlParameters — but not $components.Form1.formState.values.zip, which is client-side screen state. So the ZIP reference resolves to nothing, the predicate is dropped, and you get all rows. (You can prove the mechanism is fine by temporarily hard-coding the value to a literal like "90210" in the wizard — the preview filters perfectly. Swap it back to the $components expression and the filter silently does nothing.) This is the opposite of the V2 history table, whose markdown and rows do update on lookup — those are driven client-side by the flow response, not by a server-side chart query.
Contrast this with the rolling 7-day date filter above, which does work: $now() is evaluable on the server, so that predicate applies. The rule of thumb: a chart filter can only reference values the server can compute on its own.
To genuinely scope a chart to a value the user picks, you have two real options:
-
URL parameter. Filter on
$metadata.urlParameters.zip(server-readable) and have the screen carry the ZIP in the URL. The trade-off is the screen reloads to apply it, instead of the smooth in-place update. -
One line per ZIP (multi-series). Group the chart by
zipso every watched location gets its own colored line over the window — no entered value needed, and arguably more useful for a watched-locations screen.
For this training we keep the chart as the all-ZIPs, rolling-7-day overview (it still reloads after each lookup so today's new reading shows up), and use the history table for single-ZIP detail. The lesson — chart filters are server-side; screen-input values are client-side — is the takeaway.
| Concept | How V3 does it |
|---|---|
| One-to-many relation |
WatchedLocation 1—* WeatherReading via Many-To-One; FK watchedLocationId on the reading. |
| Iterate a list in a flow | Broadcast node = for-each; emits one message per array element. |
| Carry data across a node that replaces the payload |
Set Context ({ "loc": $ }) before the HTTP call, read back with $state.context.loc. |
| Per-item external call |
HTTP node with an expression Path ("/" & $state.context.loc.zip & "?format=j1"). |
| Write a linked record | Upsert with watchedLocationId in both create and update. |
| Conditional side-effect |
If Else on tempF >= alertThresholdF, True → Log (swap for a notification later). |
| Run with nobody watching |
Flow Schedule + Cron frequency (0 6 * * *) on the deployed System flow. |
| Keep bad data out | ZIP validation (^\d{5}$) on the field/form. |
| Make stored data readable | A trend chart of tempF over date. |
| Keep a growing chart bounded | A dynamic date filter — Date after a JSONata expression ($now() − 7 days), re-evaluated on every load. |
| Symptom | Fix |
|---|---|
| Your new model vanished | The Schema Designer canvas is one-model-at-a-time. Save before opening another model. |
| Location data gone after the HTTP node | HTTP replaces the payload — stash what you need in context first. |
createWatchedLocation rejects zip/label/… |
The create payload wraps fields under create: — { create: { zip: … } }, not { zip: … }. |
| Threshold alert never fires | Check the null guard and that alertThresholdF actually rode through from Build Reading; confirm via the Console trace. |
| Schedule created but never runs | The flow must be deployed (not just saved), and the schedule + its frequency must both be Active. |
| Chart won't filter to the entered ZIP | Chart query filters run server-side and can't read client $components form values. Use a literal, $now(), or $metadata.urlParameters — or scope via a URL parameter / one line per ZIP. See "Why the chart can't filter to the ZIP you type". |
You started with a one-shot lookup (Part 1), made it remember each result (Part 2), and turned it into a hands-off monitoring system here in Part 3. Along the way you used most of the platform's core building blocks: a connection, a screen, a data model, a relation, several flow node types (Query, Broadcast, Set Context, HTTP, JSONata, Mutate, If Else, Log), a flow schedule, field validation, and a chart. Point the same patterns at your own data and you can build a real operational app.
Part 1 — Build a Weather Lookup Screen · Part 2 — Store the Readings · Relate Two Data Models · Schedule a Data Flow · Create a Notification Channel