Repository navigation
Style Beeswarm
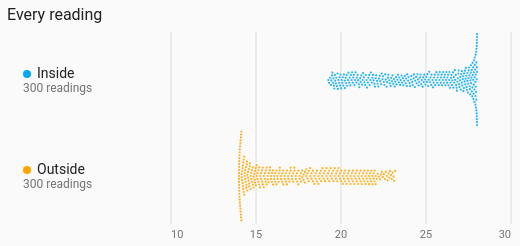
Every reading as a dot along a value axis, nudged sideways just enough that no two overlap, so the swarm's shape shows the spread and every dot is a real reading. Placed by time of day instead, an on/off entity's dots are the moments it turned on: when the doorbell rings, when the heating fires.
Seeing individual readings and their spread at once, or when in the day something tends to happen: motion, doors, the boiler.
type: custom:chartdeck-card
style: beeswarm
title: When the door opens
place_by: time_of_day
period:
  last: 7
  unit: day
entities:
  - entity: binary_sensor.front_door
    name: Front door
To use this style, set style: beeswarm (or pick Beeswarm under Distributions in the editor's Style section). The chart options are in the editor's Chart section.
-
One dot per reading taken in the period, placed by its value (
place_by: value). The value carried in from before the period, and the copy carried to its right edge, are not readings and get no dot. -
6 px dots (
dot_size: 6). A swarm too tall for its row is packed again with smaller dots; one still too tall is squeezed in, letting dots overlap rather than spill into the next row. - At most 400 dots per row: more are sampled evenly, and the row still says how many readings there were.
-
Period: the last 24 hours when
periodisn't set.
With place_by: time_of_day, entities in the binary_sensor, switch, input_boolean, light, fan, siren and automation domains draw a dot each time they turned on, placed at the time of day it happened (0 to 24 hours, in Home Assistant's time zone). The state carried in from before the period doesn't count as turning on, and neither does coming back on after being unavailable (a restart) when it was on before. The row says "12 times on" instead of a reading count.
place_by: value        # value (default) or time_of_day
dot_size: 6            # 2 to 16 px
size_by_value: false   # bigger dots for bigger values
orientation: horizontal  # horizontal (default) or vertical
value_axis: true
value_grid: true
value_min: 15          # fixed ends (when placed by value)
value_max: 25-
size_by_value: truegrows each dot's area from 12 % at the row's lowest value to all of it at the highest. - Per entity,
colorsets the dots' colour.
Hovering or touching a row shows how many readings it has (and how many dots are shown, when it was sampled), the median, the middle half, and the lowest and highest (the earliest and latest time of day when placed by time).
In the editor: Place each dot by, Dot size (px), Bigger dots for bigger values, Direction, Value labels, Lines at each value label, Lowest value shown and Highest value shown (only when placed by value), the hover switch and Compact. Each entity has a Colour.
The period, calendar spans, previous and next buttons and source are the same as on the line chart. See Line.
Layout: one chart for the whole card. Every shared option is described on the Options page.
Previous: Violin · Next: State timeline · All styles