Repository navigation
Style Funnel
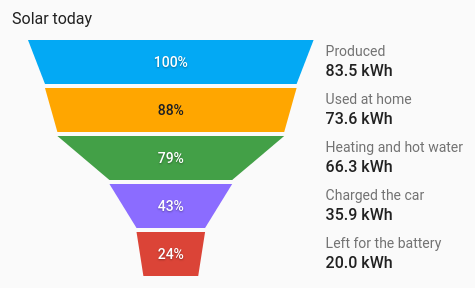
Stages that narrow down, each a share of the one before: solar produced, then used in the house, then exported. The card's entities become stages, each as wide as its value against the largest one, with their names and values in a column beside the shape. It draws from the entities' current values, so no history is involved.
A short chain of values where each is part of the last, and the drop from stage to stage is the story.
type: custom:chartdeck-card
style: funnel
title: Solar today
entities:
  - entity: sensor.solar_energy_today
    name: Produced
  - entity: sensor.solar_self_used_today
    name: Used at home
  - entity: sensor.solar_to_car_today
    name: Charged the car
  - entity: sensor.solar_export_today
    name: Exported
To use this style, set style: funnel (or pick Funnel under Parts of a total in the editor's Style section). The chart options are in the editor's Chart section.
- Shape: a funnel, first stage on top, each stage narrowing to the width of the next.
- Percentages: each stage's share of the first stage.
-
Colours: one per entity, in the same order as the history charts, unless an entity has its own
color.
shape: funnel          # funnel (default) or pyramid
percent_of: first      # first (default), previous or none
color_by: series # series (default) or bands-
shape: pyramidputs the first stage at the bottom, with the top one coming to a point. -
percent_of: previousshows each stage as a share of the stage before it;noneleaves the percentages out. A percentage that would divide by nothing is left out. -
color_by: bandscolours each stage by the colour band its value falls in. On light fills the percentage switches to dark text. - Names and values beside the shape follow the Show name and Show value switches (
show.name,show.value). - Per entity,
colorsets the stage colour.
In the editor: Shape, Percentages and Colour.
An unavailable, missing, zero or negative stage is drawn as an empty dashed outline, with its state beside it.
Every stage is the entity's own element, so tap_action, hold_action and double_tap_action work as on the other styles (more-info by default).
Stages grow in from the centre when the card appears. Animation is off when animate: false is set or the browser asks for reduced motion.
Layout: one chart for the whole card. Every shared option is described on the Options page.
Previous: Box plot · Next: Waterfall · All styles