Repository navigation
Style Treemap
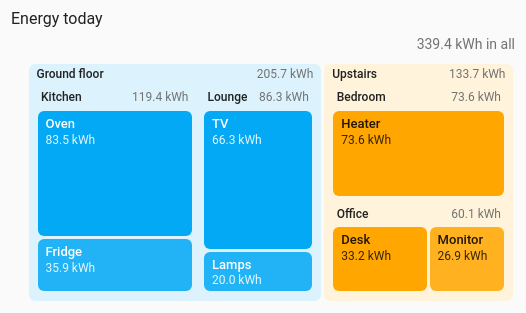
Many parts of one whole, grouped by floor, room or anything else. Each entity is a rectangle sized by its value, packed so the rectangles stay close to square. Groups get a tinted box in their own colour, with their name and total along the top. It draws from the entities' current values, so no history is involved.
Many parts at once (a whole house of power meters), where a pie would have too many slices.
type: custom:chartdeck-card
style: treemap
title: Power now
group_by: [floor, area]
entities:
  - sensor.oven_power
  - sensor.fridge_power
  - sensor.tv_power
  - sensor.lamps_power
  - sensor.heater_power
  - sensor.desk_power
Or with your own groups instead of Home Assistant's floors and areas:
type: custom:chartdeck-card
style: treemap
entities:
  - entity: sensor.oven_energy_today
    group: Ground floor / Kitchen
  - entity: sensor.tv_energy_today
    group: Ground floor / Lounge
  - entity: sensor.heater_energy_today
    group: Upstairs / Bedroom
To use this style, set style: treemap (or pick Treemap under Parts of a total in the editor's Style section). The chart options are in the editor's Chart section.
- No grouping: every entity is a tile of its own.
- Colours: each group takes the next series colour, and its tiles share it, the smaller ones a little fainter.
- Drilling in is on: tapping a group shows what makes it up.
group_by: [floor, area]  # any of floor, area, device, label (nested in that order)
color_by: group          # group (default) or bands
drill_down: true # tap a group to see what makes it up-
group_byreads each entity's floor, area, device or label from Home Assistant's registries, nested in that order, so[floor, area]gives a box per floor holding a box per room. A single level can be writtengroup_by: area. An entity with no area (or floor, and so on) goes under Other. - Per entity,
groupis its own group text, and it wins overgroup_by. A slash makes two levels:Ground floor / Kitchen. In the editor it is a text box for each listed entity in the Chart section. -
color_by: bandscolours every tile by its current colour band instead of its group. - A total sits above the map ("339.4 kWh in all"), and on each group, when the entities share a unit.
-
drill_down: falseturns off tapping into groups.
In the editor: Colour, Group by, Tap a group to show what makes it up, then Own group for each entity.
Tapping a group (its name strip or border) redraws the chart with that group as the whole, so a treemap of the house becomes a treemap of the kitchen. A row above the chart gives a back button named after the level above ("All", "Ground floor") and the group being shown with its total. Back goes up one level at a time. The parts of a group keep the colour that group has on the whole chart. Groups work from the keyboard too (Enter or Space).
Where a card has been drilled to is kept while its entities update. If that group disappears (its entities were removed, or the grouping changed), the card goes back to the deepest group that still exists.
Entities with no reading (unavailable or not found) are listed under the map, still tappable. Zero and negative values get no tile. With nothing above zero the card says so.
Tiles are the entities' own elements, so tap_action, hold_action and double_tap_action work as on the other styles (more-info by default). Groups drill in, as above.
The map is laid out for the card's real width, and again whenever the card is resized. Tiles fade in on first draw. Animation is off when animate: false is set or the browser asks for reduced motion.
Layout: one chart for the whole card. Every shared option is described on the Options page.
Previous: Waterfall · Next: Sunburst and icicle · All styles