Repository navigation
Style Grouped Bars
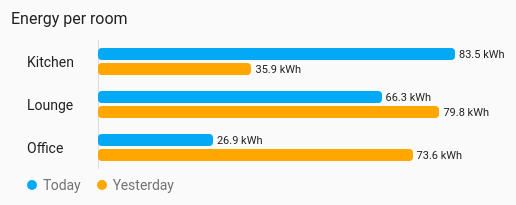
Categories with several values each, compared on one scale: energy per room split by device, or today against yesterday per sensor. Each entity is one horizontal bar; entities with the same row sit together, and entities with the same series share a colour. Bars can sit side by side, stack, or stack to 100 % of the row. It draws from the entities' current values, so no history is involved.
A few rows with two to four values each, where you compare both across rows and within them.
type: custom:chartdeck-card
style: grouped_bars
title: Energy per room
entities:
  - entity: sensor.kitchen_energy_today
    group: Kitchen
    series: Today
  - entity: sensor.kitchen_energy_yesterday
    group: Kitchen
    series: Yesterday
  - entity: sensor.lounge_energy_today
    group: Lounge
    series: Today
  - entity: sensor.lounge_energy_yesterday
    group: Lounge
    series: Yesterday
To use this style, set style: grouped_bars (or pick Grouped bars under Comparisons in the editor's Style section). The chart options are in the editor's Chart section.
- Bars: side by side within each row, each labelled with its value.
- Scale: one for all rows, taken from the data and always including zero.
- Colours: one per series, listed in a legend under the chart.
mode: grouped            # grouped (default), stacked or percent
color_by: series         # series (default) or bands
Per entity:
group: Kitchen           # the row it sits in; one without a row gets its own, under its name
series: Today            # what it is; series share a colour across rows
color: amber # overrides the series colour-
mode: stackedpiles each row's bars into one, with the row's total at the end.mode: percentstacks each row to 100 % and shows each segment's share inside it when there is room. - Negative values run left of a zero line. In a stack, positives run right and negatives left.
-
color_by: bandscolours each bar by its current colour band. - The card's
sortorders rows by their total, and rows slide to their new place as values change. Bars keep their colours and order within a row whatever the sort.
In the editor: Bars and Colour in the Chart section. Row, Series and Bar colour are in each entity's own options in the Entities section.
Unavailable and missing entities draw no bar but keep their row, and say why.
Every bar is the entity's own element, so tap_action, hold_action and double_tap_action work as on the other styles (more-info by default).
Bars grow in and rows slide when they re-sort. Animation is off when animate: false is set or the browser asks for reduced motion.
Layout: one chart for the whole card. Every shared option is described on the Options page.
Previous: Polar area · Next: Bullet · All styles