Repository navigation
Style Heatmap
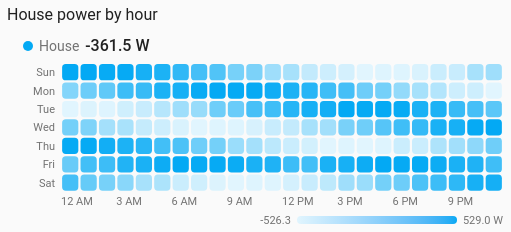
When something happens, as a grid of coloured cells: a house's power by hour of the day and day of the week shows the busy evenings at a glance, and a calendar of daily values shows a whole year. It is a history chart like Line, and shares its period, calendar spans, previous and next buttons and statistics.
Weekly routines (power, heating, a door opening), and long-run patterns day by day (energy, rain, steps).
type: custom:chartdeck-card
style: heatmap
title: House power by hour
entities:
  - entity: sensor.house_power
    name: House
To use this style, set style: heatmap (or pick Heatmap under Distributions in the editor's Style section). The chart options are in the editor's Chart section.
-
Layout (
grid: hours, the default): 7 rows of weekdays by 24 hours. Readings are grouped by hour in Home Assistant's time zone, then every Tuesday 14:00 is averaged into one cell. Rows start on the user's first weekday. -
Period: the last 4 weeks of history for the hours grid, and the last 12 months of long-term statistics for the calendar, when
periodandsourcearen't set. History rarely reaches back a year, so the calendar reads statistics. -
Combining (
aggregate: mean, the default) averages the readings in each cell. Change it for energy meters (changeorsum), as in grouping. - Colour is a smooth scale of the entity's colour, faint for the lowest value in view and full for the highest.
grid: hours         # hours (default) or calendar
aggregate: mean     # mean (default), sum, min, max, first, last or change
color_by: scale     # scale (default) or bands
color_min: 0        # the value the faintest colour stands for
color_max: 3000     # the value the fullest colour stands for
cell_shape: rounded # rounded (default), square or hexagon
legend: true        # the gradient or bands under each grid (default true)
tooltip: true # hover readout (default true)-
grid: calendardraws a cell per day, a column per week, with weekdays down the side and month names along the bottom, like a contribution graph. - The layout sets the grouping, so
group_byis ignored. -
color_by: bandscolours each cell by the entity's colour bands instead of the scale, and the legend shows the bands. -
color_min/color_maxfix the ends of the scale; the first must be below the second. - Cells keep their shape at any card width.
- Hours or days with no readings are drawn in the empty track colour, not as zero.
- Per entity,
colorsets the colour of its scale.
Each entity gets its own grid, scale and legend. Tapping its name runs its tap action. Hovering or touching a cell shows its time and value and, for the hours grid, how many days were averaged.
In the editor: Layout, the period and source, Combine with, Colour, Cells, Lowest colour at, Highest colour at, Legend and the hover readout. Each entity has its own colour.
Unavailable and missing entities draw an empty grid. The grid fades in, without motion when the browser asks for less.
The period, calendar spans and source are the same as on the line chart. See Line.
Layout: one chart for the whole card. Every shared option is described on the Options page.
Previous: Bubble · Next: Box plot · All styles