Repository navigation
Style Streamgraph
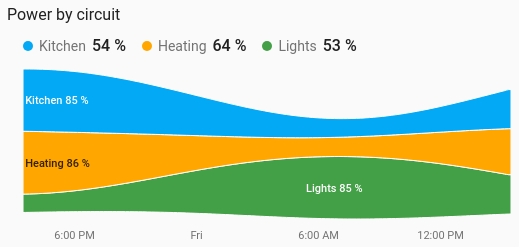
Several entities stacked into flowing layers over time, so you see how a total is shared out and how the shares shift: which circuits use the house's power through the day, where the solar went. It is a history chart like Line, and shares its period, calendar spans, previous and next buttons, source, axes, hover readout and compact layout.
A handful of parts of one total, over a day or a week: power by circuit, energy by source, water by tap.
type: custom:chartdeck-card
style: streamgraph
title: Power by circuit
entities:
  - entity: sensor.kitchen_power
    name: Kitchen
  - entity: sensor.heating_power
    name: Heating
  - entity: sensor.lights_power
    name: Lights
To use this style, set style: streamgraph (or pick Streamgraph under Parts of a total in the editor's Style section). The chart options are in the editor's Chart section.
-
Flowing shape (
baseline: wiggle): the stack floats so each layer stays as level as it can, then it is centred. -
Biggest in the middle (
stream_order: inside_out): layers that peak early go in first, each on the lighter side, so the big swells sit in the middle and the edges stay calm. -
Names on the streams (
labels: true) where a layer is thick enough, at its thickest point, moved apart so they don't overlap. - Readings are sampled about every 4 px across the plot: each sample is the time-weighted average of history (a short spike counts for as long as it lasted), or the average of the statistics rows in it.
-
Period: the last 24 hours when
periodisn't set.
baseline: wiggle        # wiggle (default), centre, share or zero
stream_order: inside_out  # inside_out (default) or listed (first at the bottom)
curve: smooth           # smooth (default), straight or step: the layers' edges
labels: true # names on the streams-
baseline: centrestacks the layers centred on zero, like a silhouette. -
baseline: sharescales every moment to 100 %, so each layer is that entity's share of the total. -
baseline: zerois an ordinary stacked area from zero up, with a value axis. - A floating stream (wiggle or centre) has no value scale to read, so the value labels, the lines across and the fixed value range are left out, and their editor fields are hidden.
- A gap or a negative reading counts as nothing: a stack of shares can't show power flowing back out.
- Per entity,
colorsets the layer colour. The name on a layer switches to dark text on a light colour.
Hovering or touching the chart shows a guide and a box with each stream's value at that moment, its share, and the Total.
In the editor: Shape, Order, Edges and Names on the streams. Each entity has a Colour.
The period, calendar spans, source, axes, gridlines, hover and compact layout are the same as on the line chart. See Line.
Layout: one chart for the whole card. Every shared option is described on the Options page.
Previous: Sparkline · Next: Candlestick · All styles