Repository navigation
Style Histogram
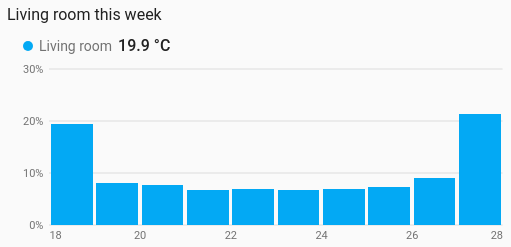
How often a sensor's readings fell in each range of values: how long the living room sat below 18 °C this week, or how a response time is spread. It is a history chart like Line, and shares its period, calendar spans, previous and next buttons, statistics, grouping, axes, hover readout and compact layout.
Seeing where a value spends its time, rather than when: comfort ranges, how often a tank is nearly empty, the spread of a measurement.
type: custom:chartdeck-card
style: histogram
title: Living room this week
period:
  last: 7
  unit: day
entities:
  - entity: sensor.living_room_temperature
    name: Living room
To use this style, set style: histogram (or pick Histogram under Distributions in the editor's Style section). The chart options are in the editor's Chart section.
-
Bins count time (
count: time). History records changes, not samples: a room at 20 °C all day that flickers to 21 °C ten times in a minute has ten rows at 21 and one at 20. Counting rows would say it was mostly 21; adding up how long each value held says 20, which is what the room was. Each value counts until the next reading (the last one until now, or the end of the period), and time spent unavailable counts nothing. - Bin width is a round number (1, 2 or 5 × 10ⁿ) that gives a number of bins to suit the card's width.
-
Bars show each entity's share of its whole (
show_as: percent). -
Period: the last 24 hours when
periodisn't set, as on the line chart.
count: time         # time (default) or readings
show_as: percent    # percent (default) or total
bin_width: 0.5      # bins of this width, edges on its multiples
bins: 10            # or: exactly this many bins, lowest to highest reading (1 to 100)
x_min: 15           # fixed range along the bottom; readings outside it are left out
x_max: 25
bars: side          # side (default) or overlap, for two or more entities
color_by: series # series (default) or bands-
count: readingscounts rows instead of time, for sensors where each reading is an event. The value carried in from before the period, and the copy carried to its right edge, are not counted. - From long-term statistics (
source: statistics) each row counts one period, so a missing row is missing data rather than a long-held value. Withgroup_byset, each group counts for its own length. -
show_as: totaldraws the hours (or the number of readings) in each bin instead of the share. -
bin_widthwins overbins. There are never more than 100 bins: a width that would give more is widened. -
bars: overlapdraws several entities over each other, see-through and outlined, instead of side by side in each bin. -
color_by: bandscolours each bin by the colour band its middle falls in. - Per entity,
colorsets the bar colour.
Hovering or touching a bin shades it and lists each entity's share and time (or readings) there.
In the editor: Count, Show as, Number of bins, Bin width, Lowest value across, Highest value across, Two or more entities, Colour and Value labels along the bottom. Each entity has a Bar colour.
The period, calendar spans, source, grouping, axes, gridlines, hover and compact layout are the same as on the line chart. See Line for each one.
Layout: one chart for the whole card. Every shared option is described on the Options page.
Previous: Waffle · Next: Scatter · All styles