Repository navigation
Style Sunburst
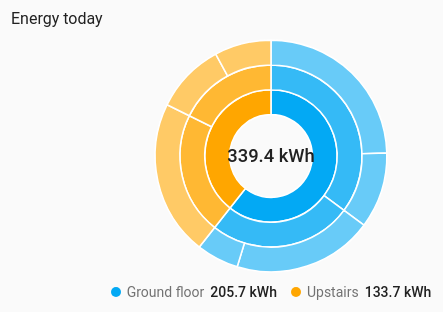
A hierarchy, such as house, floor, room and device power, drawn two ways. The sunburst draws a ring per level round the total: the first ring is the top-level groups, each sized by its share, and every ring out splits its parent into what makes it up, ending with the entities. The icicle draws the same hierarchy as columns: the total on the left, then each level to the right, stacked top to bottom by share.
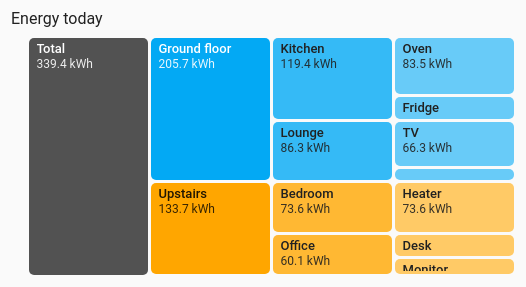
Both draw from the entities' current values, so no history is involved.
Totals with two or three levels inside them, where both the big split and the detail matter.
type: custom:chartdeck-card
style: sunburst
title: Energy today
entities:
  - entity: sensor.oven_energy_today
    group: Ground floor / Kitchen
  - entity: sensor.fridge_energy_today
    group: Ground floor / Kitchen
  - entity: sensor.tv_energy_today
    group: Ground floor / Lounge
  - entity: sensor.heater_energy_today
    group: Upstairs / Bedroom
  - entity: sensor.desk_energy_today
    group: Upstairs / Office
To use these styles, set style: sunburst or style: icicle (or pick Sunburst or Icicle under Parts of a total in the editor's Style section). The chart options are in the editor's Chart section.
- Sunburst shape: a full circle with the total in the middle.
- Colours: each top-level group takes the next series colour, and its children fade from it level by level.
- Drilling in is on: tapping a group shows what makes it up.
shape: full              # sunburst only: full (default) or half
group_by: [floor, area]  # any of floor, area, device, label (nested in that order)
color_by: group          # group (default) or bands
drill_down: true # tap a group to see what makes it up-
shape: halfdraws the top half of the sunburst only, with the total underneath, for a lower card. -
group_byreads each entity's floor, area, device or label from Home Assistant's registries, nested in that order. An entity with no area (or floor, and so on) goes under Other. - Per entity,
groupis its own group text, and it wins overgroup_by, with a slash for each level:Ground floor / Kitchen. In the editor it is a text box for each listed entity in the Chart section. -
color_by: bandscolours the entities by their current colour band instead. Shades are mixed with the card's background, so they work in light and dark themes. - The sunburst has a legend under it naming the top level with each total. The icicle writes names and values in its cells where there is room.
- Totals show only when the entities share a unit.
-
drill_down: falseturns off tapping into groups.
In the editor: Shape (sunburst), Colour, Group by, Tap a group to show what makes it up, then Own group for each entity.
Tapping a group redraws the chart with that group as the whole: a sunburst's "Ground floor" segment becomes a sunburst of its rooms. A sunburst's group segments and its legend items can be tapped, and so can an icicle's group cells. A row above the chart gives a back button named after the level above ("All", "Ground floor") and the group being shown with its total. Back goes up one level at a time. The parts of a group keep the colour that group has on the whole chart. Groups work from the keyboard too (Enter or Space), and screen readers hear "Kitchen, 1.8 kW. Show what makes it up".
Where a card has been drilled to is kept while its entities update. If that group disappears, the card goes back to the deepest group that still exists.
Entities with no reading are listed under the chart, still tappable. Zero and negative values take no space. With nothing above zero the card says so.
Every entity's arc or cell is its own element, so tap_action, hold_action and double_tap_action work as on the other styles (more-info by default). Groups drill in, as above.
The chart draws in on first show. Animation is off when animate: false is set or the browser asks for reduced motion.
Layout: one chart for the whole card. Every shared option is described on the Options page.
Previous: Treemap · Next: Radar · All styles