Repository navigation
Style Dumbbell
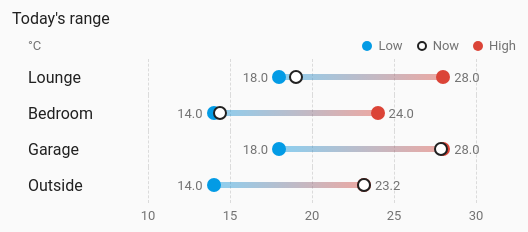
Two or three values per entity as dots on a shared axis, joined by a bar: the lowest and highest reading of the day, a week ago against now, or the set point against the actual temperature.
Ranges and gaps across several entities: how far each room swung today, or which rooms are furthest from their target.
type: custom:chartdeck-card
style: dumbbell
title: Today's range
period:
  last: 24
  unit: hour
entities:
  - sensor.lounge_temperature
  - sensor.bedroom_temperature
  - sensor.garage_temperature
  - sensor.outside_temperature
To use this style, set style: dumbbell (or pick Dumbbell under Comparisons in the editor's Style section). The chart options are in the editor's Chart section.
- Compare: the lowest and highest reading over the last 24 hours, from history, with the current value marked between them as a ring.
- Direction: rows across.
- Colours: low in the theme's info colour, high in its error colour.
ends: range              # range (default), then or target
show_now: true           # range only: mark the current value
orientation: horizontal  # horizontal (default) or vertical
period:
  last: 24               # how far back (default 24)
  unit: hour             # hour (default), day, week or month
source: history # history (default) or statistics-
ends: rangereads the lowest and highest reading over the period. From statistics their min and max count. The range is stretched to take in the current value, which can be newer than the last stored reading. -
ends: thencompares the reading at the start of the period with the current value, such as now against a week ago. With statistics, whose first row can start after the period does, the first reading stands in. The start of the period is drawn in grey. -
ends: targetcompares the entity'starget(a number or an entity) with its current value, for set point against actual. It loads no history and draws straight away. -
orientation: verticaldraws columns instead of rows. - The dumbbell reads a rolling span only: calendar periods, previous and next buttons and grouping don't apply.
- The axis has round tick values. The unit is shown once, beside the legend, when every entity shares it, and narrow cards show every other tick label.
In the editor: Compare, Direction, the period and source (hidden for a target) and Mark the current value (range only).
Unavailable and missing entities keep their row, with their status text. Loading and failed history use the same messages as the line chart.
Every row is the entity's tap target, with a spoken description of its values.
Layout: one chart for the whole card. Every shared option is described on the Options page.
Previous: Slope · Next: Range area · All styles