Repository navigation
Style Waffle
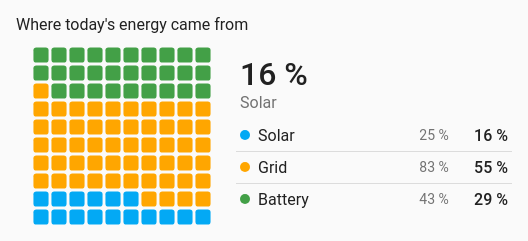
Shares as a grid of 100 squares, where each square is 1 %: how much of today's energy came from solar, how full the storage is. Squares fill from the bottom row up.
One percentage that should read at a glance, or a split of one total between a few parts.
type: custom:chartdeck-card
style: waffle
title: Where today's energy came from
entities:
  - entity: sensor.solar_energy_today
    name: Solar
  - entity: sensor.grid_energy_today
    name: Grid
To use this style, set style: waffle (or pick Waffle under Parts of a total in the editor's Style section). The chart options are in the editor's Chart section.
-
One entity fills the waffle to its value between its
minandmax. - Several entities split the 100 squares by their share of the total, always adding up to exactly 100.
- The first entity's share is shown in large type beside the grid ("64 %", "Solar"), above a legend of every entity's name, value and share.
waffles: one          # one (default): one waffle split between the entities; each: one per entity
color_by: series      # series (default) or bands
headline: true        # the first share in large type (default true)
show_percent: true # the shares (default true)-
waffles: eachdraws a row of small waffles side by side instead, one per entity, each filled to its own value betweenminandmax, with its name and percentage. The value is shown under the percentage unless they say the same thing (a 0–100 % sensor). -
show_percent: falsehides the share column in the legend; small waffles then show the value instead of the percentage. -
color_by: bandscolours each entity's squares by the colour band its value falls in. - Per entity,
colorsets the colour of its squares.
In the editor: Waffles, Colour, Show the first share in large type and Show each share as a percentage.
Only positive numbers take squares. Unavailable, missing and negative entities stay in the legend with a hollow swatch and no share, or show as an empty small waffle with their state. With nothing available, the grid is empty.
Tapping an entity's squares, its legend row or its small waffle runs its tap_action (more-info by default). Filled squares pop in one after another when the card appears and change colour smoothly when the split changes; animation is off when animate: false is set or the browser asks for reduced motion.
Layout: one chart for the whole card. Every shared option is described on the Options page.
Previous: Pictograph · Next: Histogram · All styles