Repository navigation
Style Violin
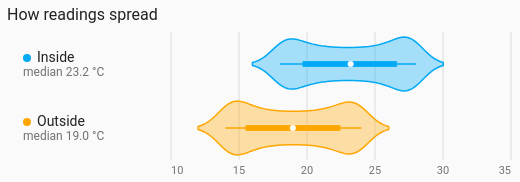
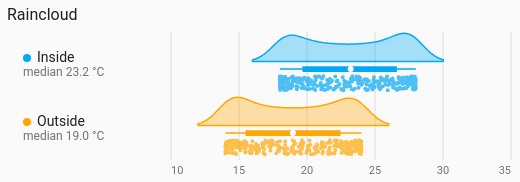
How a sensor's readings were spread, drawn as a smooth shape that is widest where the readings were most common, with a small box marking the median and the middle half. The raincloud shape draws half a violin with the box and every reading as a dot underneath it. Both are history charts and read the period, calendar spans, previous and next buttons and source like Line.
Comparing the shape of a few distributions: two rooms' temperatures, this week against last week, a response time with two humps.
type: custom:chartdeck-card
style: violin
title: How warm, this week
period:
  last: 7
  unit: day
entities:
  - entity: sensor.living_room_temperature
    name: Living room
  - entity: sensor.bedroom_temperature
    name: Bedroom
To use this style, set style: violin (or pick Violin under Distributions in the editor's Style section). The chart options are in the editor's Chart section.
- Each value counts for as long as it held. History is a sensor reporting when it changes, so a room that sat at 20 °C all night and flickered to 21 °C ten times in a minute was at 20, not mostly at 21. Grouped readings and statistics rows count once each.
- Smoothing is automatic (Silverman's rule of thumb), never finer than the sensor's own step, so a sensor that reports in 0.5 °C steps draws one smooth shape, not a comb of spikes.
-
One shape per entity, laid out across (
orientation: horizontal), with the box on. -
The raincloud shows every reading as a dot; the violin doesn't, unless
readings: true. -
Period: the last 24 hours when
periodisn't set.
shape: violin         # violin (default) or raincloud
box: true             # the box with the median and middle half
readings: false       # every reading as a dot (default true for raincloud)
bandwidth: 0.5        # smoothing in the entity's unit; leave it out for automatic
split_by: none        # none (default), day, week or month: one shape per entity and period
orientation: horizontal  # horizontal (default) or vertical
value_axis: true      # value labels along the axis
value_grid: true      # lines at each value label
value_min: 15         # fixed ends for the value axis
value_max: 25-
split_by: daydraws one shape per entity per day, labelled with the day, to compare days with each other. - A shape with no readings in the period says No readings.
- Per entity,
colorsets the shape's colour.
Hovering or touching a shape shows its Median, Middle half (the quartiles), Lowest – highest and the number of Readings.
In the editor: Shape, One shape per, Box with the median and middle half, Show each reading as a dot, Smoothing, Direction, Value labels, Lines at each value label, Lowest value shown, Highest value shown, the hover switch and Compact. Each entity has a Colour.
The period, calendar spans, previous and next buttons and source are the same as on the line chart. See Line.
Layout: one chart for the whole card. Every shared option is described on the Options page.
Previous: Candlestick · Next: Beeswarm · All styles