Repository navigation
Style Scatter
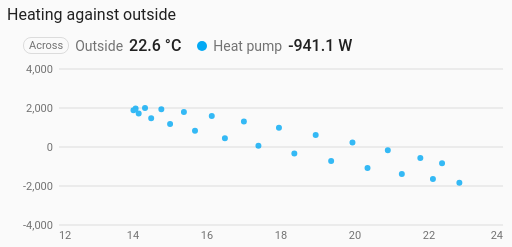
One sensor against another, as dots: outside temperature along the bottom and heating power up the side, say. It is a history chart like Line, and shares its period, calendar spans, previous and next buttons, statistics, grouping, axes and compact layout.
Seeing whether two things move together, and how: heating against outside temperature, solar output against cloud cover, humidity against temperature.
type: custom:chartdeck-card
style: scatter
title: Heating against outside
group_by: hour
entities:
  - entity: sensor.outside_temperature
    name: Outside
  - entity: sensor.heat_pump_power
    name: Heat pump
To use this style, set style: scatter (or pick Scatter under Distributions in the editor's Style section). The chart options are in the editor's Chart section.
- The first entity goes along the bottom, and every other entity is plotted up the side against it, one coloured series each. The first entity is marked Across in the header.
- Readings are paired in time. History records changes, not samples, so at every moment any of the sensors changed, each one's value is the last it reported. Moments when one of them was unavailable, or hadn't reported yet, are left out, and so is the reading the chart carries on to its right edge.
-
Period: the last 24 hours when
periodisn't set, as on the line chart.
against: entity   # entity (default): the first entity along the bottom; time: readings over time
dot_size: 6       # px, 2 to 30 (default 6)
jitter: 0         # px, 0 to 20: nudges each dot so ones on top of each other stay visible
x_min: 10         # fixed range along the bottom
x_max: 25-
With grouping set (
group_by: hour, say), each group is one dot: that hour's average outside temperature against that hour's heating. This is the better way to compare a fast sensor with a slow one.aggregatechooses how each group is combined, as on the line chart. -
against: timeplots each entity's readings over time as dots, on the usual time axis. Then one entity is enough. -
jittermoves each dot a steady random amount, worked out from the reading's own time, so a dot stays put as new readings arrive. - At most 800 dots are drawn per series; more are thinned evenly.
- Per entity,
colorsets the dot colour.
Hovering or touching the chart picks the nearest dot and shows its time and both readings.
In the editor: Along the bottom, Dot size (px), Jitter (px), Lowest value across, Highest value across and Labels along the bottom. Each entity has a Dot colour.
With fewer entities than the chart needs, it shows a message saying what to add. A missing or unavailable entity just has no dots.
The period, calendar spans, source, grouping, axes, gridlines and compact layout are the same as on the line chart. See Line for each one.
Layout: one chart for the whole card. Every shared option is described on the Options page.
Previous: Histogram · Next: Bubble · All styles