Repository navigation
Style Pictograph
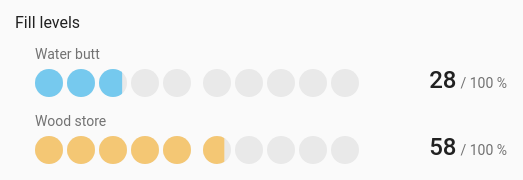
A quantity as a row of icons, so "7 of 10" reads at a glance: chores done today, glasses of water, people at home, bins out. Each entity is a row of repeated icons, filled up to its value, with the value and the most it can be beside them ("7 / 10").
Small counts, where you'd naturally count things rather than read a number.
type: custom:chartdeck-card
style: pictograph
title: Today
entities:
  - entity: counter.glasses_of_water
    name: Glasses of water
    icon: mdi:cup-water
    max: 8
  - entity: sensor.chores_done
    name: Chores done
    max: 10
To use this style, set style: pictograph (or pick Pictograph under Parts of a total in the editor's Style section). The chart options are in the editor's Chart section.
-
The row runs from the entity's
minto itsmax. When that range is 20 or less, each icon stands for one unit, so amaxof 10 gives ten icons. Wider ranges get ten icons. - Fractions part-fill the last icon: 5.5 of 8 glasses fills five and a half.
- Icons are clustered in fives so they can be counted, and clusters wrap as a whole on a narrow card.
- A row never has more than 100 icons; the scale stretches instead.
unit_icon: mdi:water-outline  # the icon for every row
per_icon: 2                   # what each icon stands for; leave out for automatic
group_size: 5                 # icons per cluster, 0 to 50; 0 = no clusters (default 5)
color_by: series              # series (default) or bands
partial: true # part-fill an icon for fractions (default true)-
The icon is the entity's own
iconif it has one, elseunit_icon, else the entity's usual state icon. So each row can use a different Material Design icon. -
per_iconmust be more than 0. Withper_icon: 2and a range of 0 to 10, there are five icons. -
partial: falsefills whole icons only. -
color_by: bandscolours each row by the colour band its value falls in. - Per entity,
colorsets the row's colour. -
show: { name: false }hides the names above the rows;show: { value: false }hides the numbers.
In the editor: Icon (each entity can have its own), Each icon stands for (empty: automatic), Icons per group (0: no groups), Colour and Part-fill an icon for fractions.
An unavailable or missing entity shows a row of empty icons and its state.
Tapping a row runs the entity's tap_action (more-info by default). Filled icons sweep in from the left one after another when the card appears, and grow or shrink when a value changes; animation is off when animate: false is set or the browser asks for reduced motion.
Layout: one chart for the whole card. Every shared option is described on the Options page.
Previous: Rings · Next: Waffle · All styles