Repository navigation
Style Slope
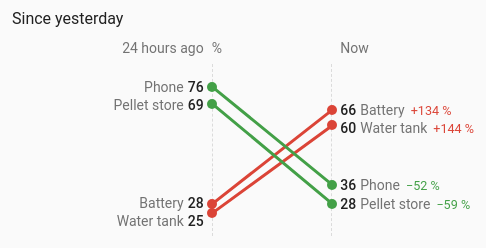
Each entity then and now, as one line from its value at the start of the period to its value now, so it is easy to see which went up and which went down. With measure: change it compares meters instead: how much each rose over the previous period against the latest one, such as this month against last month.
A handful of values where the direction of change matters more than the path between.
type: custom:chartdeck-card
style: slope
title: This month against last
measure: change
period:
  last: 1
  unit: month
source: statistics
entities:
  - entity: sensor.house_energy
    name: House
  - entity: sensor.heat_pump_energy
    name: Heat pump
  - entity: sensor.car_charger_energy
    name: Car
To use this style, set style: slope (or pick Slope under Comparisons in the editor's Style section). The chart options are in the editor's Chart section.
- Then and now: the reading 24 hours ago against the reading now, from history.
- Colours: a rise in red and a fall in green.
-
Headings say "24 hours ago | Now" (or "Previous month | Last month" for
measure: change), with the shared unit between them.
period:
  last: 24               # how far back (default 24)
  unit: hour             # hour (default), day, week or month
source: history          # history (default) or statistics
measure: value           # value (default) or change
color_by: direction      # direction (default) or group
increase: bad # bad (default: a rise is red) or good-
measure: changeis made for meters such as energy totals. The left end is how much the reading rose over the previous period and the right end how much over the latest one. The card loads twice the period for this, and months step back by calendar month. A meter that resets inside a period gives a wrong rise, which is not corrected. -
increase: goodcolours a rise green and a fall red. -
color_by: groupcolours lines by group instead of direction. Per entity,groupnames its group; entities in a group share a colour (an entity's owncolorwins), and a legend lists the groups. - The slope chart reads a rolling span only: calendar periods, previous and next buttons and grouping don't apply.
- When the entities' units differ, each value carries its own unit. The change in per cent on the right is hidden on narrow cards.
- Labels are pushed apart so they never overlap; the dots stay at the true values.
In the editor: the period and source, Compare, Colour and A rise is. Group is in each entity's own options in the Entities section.
An entity with no reading at one end gets a lone dot; one with neither is left out. With nothing at all the chart says there are no readings.
Every line, dot and label belongs to its entity's element, so tap_action, hold_action and double_tap_action work on any of them (more-info by default).
Layout: one chart for the whole card. Every shared option is described on the Options page.
Previous: Lollipop · Next: Dumbbell · All styles