Repository navigation
Style Polar Area
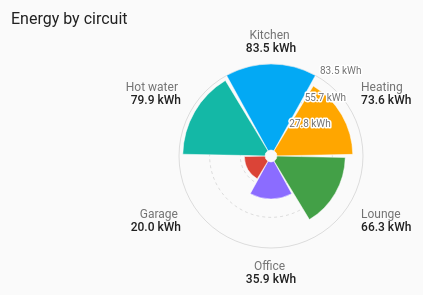
Like a pie where every slice gets the same angle and its length shows the value. It suits comparing like things: power by circuit, or how often the wind blows from each direction. Slices go round from straight up, so a wind rose's north sits at the top. It draws from the entities' current values, so no history is involved.
Five to twelve values of the same kind, especially ones with a natural order round a circle (directions, hours, months).
type: custom:chartdeck-card
style: polar_area
title: Energy by circuit
entities:
  - sensor.kitchen_energy_today
  - sensor.heating_energy_today
  - sensor.lounge_energy_today
  - sensor.office_energy_today
  - sensor.garage_energy_today
To use this style, set style: polar_area (or pick Polar area under Comparisons in the editor's Style section). The chart options are in the editor's Chart section.
- Scale: each slice's length is its share of the largest value, with three dashed rings labelled in the first entity's unit.
-
Colours: one per entity, in the same order as the history charts, unless an entity has its own
color.
scale: shared            # shared (default) or limits
color_by: series         # series (default), shades or bands
color: primary # for shades: a palette name or CSS colour-
scale: limitsmeasures each slice between its own entity'sminandmax, and leaves the ring values off, since they would differ from slice to slice. -
color_by: shadesgives every slice a shade ofcolorthat gets stronger as the slice gets longer. Shades are mixed with the card's background, so they work in light and dark themes. -
color_by: bandscolours each slice by the colour band its value falls in. - Names and values are written round the outside and follow the Show name and Show value switches (
show.name,show.value).
In the editor: Scale, Colour and Colour for shades.
An unavailable or missing entity gets no slice, and its label is greyed.
Slices are the entities' own elements, so tap_action, hold_action and double_tap_action work as on the other styles (more-info by default).
Slices grow out from the centre on first draw. Animation is off when animate: false is set or the browser asks for reduced motion.
Layout: one chart for the whole card. Every shared option is described on the Options page.
Previous: Radar · Next: Grouped bars · All styles