Repository navigation
Style Waterfall
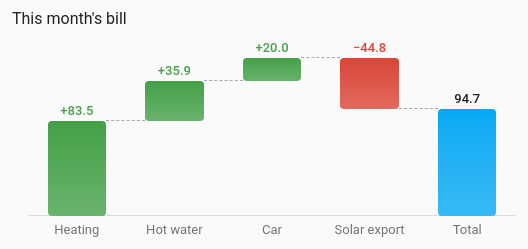
How a total is built up or worn down. Each entity is a step that lifts or lowers a running total, joined by dashed lines at the running level, with an end bar showing where the steps finished: what made up this month's bill, or where the battery's charge went through the day.
A handful of parts that add to or take from one total, where the order of the steps matters.
type: custom:chartdeck-card
style: waterfall
title: This month's bill
steps: current
entities:
  - entity: sensor.heating_cost_month
    name: Heating
  - entity: sensor.hot_water_cost_month
    name: Hot water
  - entity: sensor.car_charging_cost_month
    name: Car
  - entity: sensor.solar_export_credit_month
    name: Solar export
    invert: true
To use this style, set style: waterfall (or pick Waterfall under Parts of a total in the editor's Style section). The chart options are in the editor's Chart section.
- Each step is how much the entity changed over the chart's period (its last reading less its first), over the last 24 hours, from history.
- Direction: upright columns.
- Total: an end bar with the running total.
- Colours: rises in the theme's green, falls in its red, start and end bars in the primary colour.
period:
  last: 24             # how far back (default 24)
  unit: hour           # hour (default), day, week or month
source: history        # history (default) or statistics
steps: change          # change (default) or current
orientation: vertical  # vertical (default) or horizontal
start_from_first: false
total: true-
steps: currentuses each entity's current value instead of its change, for sensors that already hold a part (this month's cost of heating). No history is loaded then, and the period does nothing. -
source: statisticsreads long-term statistics instead of history, as on the Line chart. The waterfall reads a rolling span only: calendar periods, previous and next buttons and grouping don't apply. -
start_from_first: trueturns the first entity into a Start bar from its reading at the start of the period, for "battery charge through the day". -
total: falseleaves the end bar out. -
orientation: horizontaldraws rows instead of columns. - Per entity,
invert: truemakes it count down: a rise in that entity is a drop in the total, for meters that count energy used. It is the Counts down switch for each listed entity, at the bottom of the Chart section.
In the editor: the period and source, Each step is, Direction, Start from the first entity's reading at the start of the period and Show the total at the end, then Counts down for each entity.
A step with no number (unavailable, missing, or no readings in the period) adds nothing and is drawn as a dashed outline with its state.
Bars and names open the entity like any other card part. The end total is not an entity, so it does nothing when tapped.
Bars grow in when the card appears. Animation is off when animate: false is set or the browser asks for reduced motion.
Layout: one chart for the whole card. Every shared option is described on the Options page.
Previous: Funnel · Next: Treemap · All styles