Repository navigation
Style Range Area
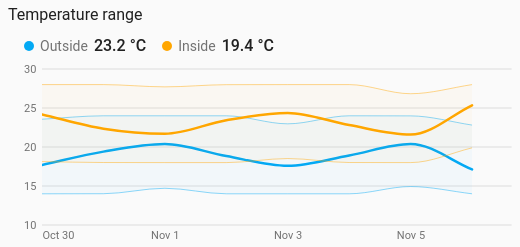
Each period's lowest to highest reading as a shaded band, with the average drawn through it: a day's temperature spread, how far the battery swung each hour. It is a history chart like Line, and shares its period, calendar spans, previous and next buttons, grouping, axes, hover readout and compact layout.
Seeing how much a value moved, not just where it was: daily temperature ranges, power that spikes and drops within the hour, a tank's level through each day.
type: custom:chartdeck-card
style: range_area
title: Outside this week
period:
  last: 7
  unit: day
entities:
  - entity: sensor.outside_temperature
    name: Outside
To use this style, set style: range_area (or pick Range area under History charts in the editor's Style section). The chart options are in the editor's Chart section.
-
Reads long-term statistics (
source: statistics), which keep each period's lowest, average and highest reading, so a range reaches back months. -
From history (
source: history), a band needs readings to spread: with nogroup_bythe readings are grouped by hour when the period is two days or less, otherwise by day. -
The average is drawn as a line through the band (
mean: true). -
Period: the last 24 hours when
periodisn't set, as on the line chart.
mean: true          # draw the average as a line through the band (default true)
curve: smooth       # smooth (default), straight or step, for the band edges and the line
line_width: 2.5 # the average line, in px- The band is see-through in the series colour, outlined along its top and bottom edges. Where a sensor was unavailable the band breaks, as a line does.
-
mean: falsedraws the band only; the hover readout then gives the lowest and highest without a dot. - Per entity:
colorsets the band colour,curveits own curve, anddash: truedashes its average line.
Hovering or touching the chart shows each entity's lowest – highest for the period under the pointer, then its average.
In the editor: Curve, Draw the average as a line and Line width. Each entity has a Colour, a Curve and a dashed-line switch.
The period, calendar spans, source, grouping, axes, gridlines, hover and compact layout are the same as on the line chart. See Line for each one.
Layout: one chart for the whole card. Every shared option is described on the Options page.
Previous: Dumbbell · Next: Sparkline · All styles