Repository navigation
Style Candlestick
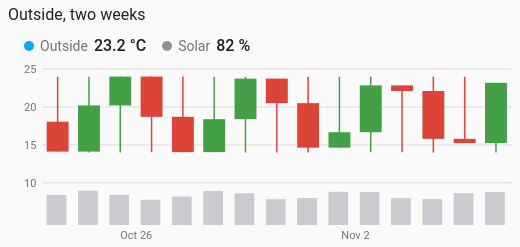
One candle per day (or hour, week or month): where a value opened, how high and low it went, and where it closed. A rise is green, a fall red. Made for energy prices, and just as useful for a tank, a battery or a temperature that should end the day where it began.
Values whose movement within each period matters: electricity prices, battery state of charge, a water tank's level, a greenhouse temperature.
type: custom:chartdeck-card
style: candlestick
title: Electricity price, two weeks
entities:
  - entity: sensor.electricity_price
    name: Price
  - entity: sensor.house_energy
    name: Used
To use this style, set style: candlestick (or pick Candlestick under History charts in the editor's Style section). The chart options are in the editor's Chart section.
-
The last 14 days, one candle per day (
period: {last: 14, unit: day},group_by: day). -
Reads long-term statistics (
source: statistics), so months of candles load quickly. -
Green when it rose, red when it fell (
up_color: green,down_color: red). A period that closed where it opened gets a thin flat body. - The first entity is the candles. Every other entity is drawn in a strip along the bottom, each scaled to its own largest value, as columns.
- From history, open is the value held as the period began (carried in from before it), close the last value in it, and high and low every value that held in it.
- From statistics, open is the first row's value, close the last row's, and high and low the highest max and lowest min.
- A period with nothing recorded, or one that hasn't started yet, has no candle.
group_by: day         # one candle per hour, day (default), week or month
up_color: green       # palette name or CSS colour
down_color: red
underneath: columns   # columns (default) or line, for the entities after the first
aggregate: mean # how the entities underneath combine each period's readings-
underneath: linedraws the other entities as lines instead of columns. -
aggregate(shown as Entities underneath: combine readings with) works as on the line chart. A meter's sum or change is how far its reading rose in the period, resets handled. - Per entity,
colorsets its colour in the strip underneath.
Hovering or touching a candle shows its period ("Week of 3 Nov" for weeks) with Open, High, Low and Close, and the values of the entities underneath.
In the editor: One candle per, Entities underneath: combine readings with, Colour when it rose, Colour when it fell and Draw the other entities underneath as. Each entity has a Colour.
The period, calendar spans, previous and next buttons, source, axes, gridlines and compact layout are the same as on the line chart. See Line.
Layout: one chart for the whole card. Every shared option is described on the Options page.
Previous: Streamgraph · Next: Violin · All styles