Repository navigation
Style Pie
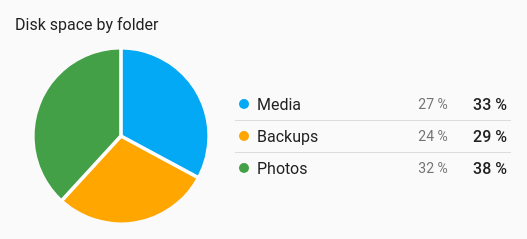
How a total splits into parts: where today's energy came from, disk space by folder, power use by room. The card's entities become slices of one circle, sized by their current values, with a legend beside it giving each entity's colour, name, value and share. It draws from the entities' current values, so no history is involved.
A handful of parts of one total, where the shares matter more than the exact numbers.
type: custom:chartdeck-card
style: pie
title: Energy today
center_label: kWh today
entities:
  - entity: sensor.solar_energy_today
    name: Solar
  - entity: sensor.grid_energy_today
    name: Grid
  - entity: sensor.battery_energy_today
    name: Battery
To use this style, set style: pie (or pick Pie / donut under Parts of a total in the editor's Style section). The chart options are in the editor's Chart section.
- Shape: a donut, with the total of its slices in the middle.
- Shares are whole percentages that always add up to 100.
-
Colours: one per entity, in the same order as the history charts, unless an entity has its own
color.
shape: donut           # donut (default) or pie
center: total          # total (default) or none; donut only
center_label: kWh today  # the line under the total; default the shared unit
color_by: series       # series (default), bands or shades
shade_color: green     # for shades: a palette name or CSS colour; default primary
gap: 2                 # space between slices, 0 to 10 (default 2)
rounded: false         # round ends on donut slices
gradient: false        # each slice fades lighter towards the middle
show_percent: true # the share column in the legend-
The middle of a donut shows the total of its slices. The line under it is
center_label, or the unit when every entity shares one.center: noneleaves the middle empty. A pie has no middle, socenterandcenter_labeldo nothing there. -
color_by: bandscolours each slice by the colour band its value falls in.color_by: shadesgives every slice a shade ofshade_color, darkest first. -
gapon a pie draws lines in the card's background colour between slices, so the gap is the same width all the way to the centre. On a donut each slice is shortened instead. -
rounded: truegives donut slices round ends. It has no effect on a pie. -
show_percent: falsehides the share column; the legend still shows each value. - Per entity,
colorsets the slice colour.
In the editor: Shape, Colour, In the middle, Line under the total, Space between slices, Shade colour, Rounded ends, Gradient fills and Show each share as a percentage.
Only positive numbers become slices. Unavailable, missing, zero and negative entities stay in the legend with a hollow swatch and no share, so nothing silently disappears. With nothing to draw, the card shows an empty ring.
Tapping a slice or a legend row runs the entity's tap_action (more-info by default). Drilling into a slice's own parts isn't built yet; a navigate tap action to a view of the parts does the job meanwhile.
Slices grow in when the card appears and glide to their new size when a value changes. Animation is off when animate: false is set or the browser asks for reduced motion.
Layout: one chart for the whole card. Every shared option is described on the Options page.
Previous: Combined · Next: Rings · All styles