Repository navigation
Style Climate
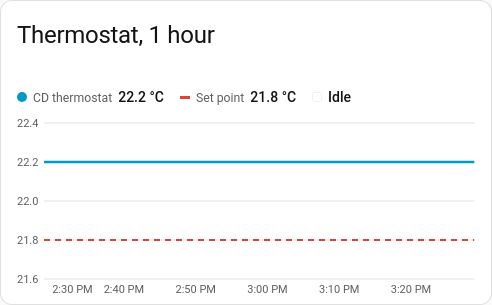
A thermostat's history on one chart: the room temperature as a line, its set point as a dashed line (or a shaded band for a heat/cool range), and shading wherever it was heating or cooling. You see at a glance whether the room kept up and how long the heating ran.
Thermostats, TRVs, heat pumps and air conditioners: any climate entity that reports current_temperature.
type: custom:chartdeck-card
style: climate
title: Lounge
period:
  last: 24
  unit: hour
entities:
  - climate.lounge
To use this style, set style: climate (or pick Climate under History charts in the editor's Style section). The chart options are in the editor's Chart section.
It reads five attributes of the first entity, in one history call:
-
current_temperature: the line. -
temperature: the set point, as a dashed line held until it changes. Where the set point went away (the thermostat off), the line stops. -
target_temp_lowandtarget_temp_high: a heat/cool range, drawn as a shaded band between them while both are set. -
hvac_action: the shading. Heating and preheating shade in the heating colour; cooling and defrosting in the cooling colour (a heat pump defrosting is taking heat out of the room); drying and fan only have their own shades. Idle and off aren't shaded.
The legend shows the room temperature, the set point (or range) and what the thermostat is doing now (Heating, Idle, Off…).
- One thermostat per chart: the first entity. For several rooms, use one card each in a stack.
-
Set point on (
set_point: true) and shading on (shading: true). Fan-only shading is off (shade_fan: false). -
Colours follow the theme: the primary colour for the temperature, red for the set point, and Home Assistant's heat, cool, dry and fan colours (
--state-climate-heat-colorand so on) for the shading. -
Period: the last 24 hours when
periodisn't set.
set_point: true        # the set point line or range
shading: true          # shade while heating or cooling
shade_fan: false       # also shade while only the fan runs
curve: smooth          # smooth (default), straight or step: the temperature line
line_width: 2.5
current_color: primary # palette name or CSS colour; empty follows the theme
set_point_color: red   # default red
heating_color: "#ff8100"   # empty: the theme's heat colour
cooling_color: "#2b9af9" # empty: the theme's cool colour- Statistics don't keep a thermostat's set point or action, so
sourcemust behistory, and readings can't be grouped (group_by). - An entity that isn't a thermostat shows "… is not a thermostat. Pick a climate entity." instead of a chart.
Hovering or touching the chart shows the temperature, the set point (or range) and the action at that moment.
In the editor: Show the set point, Shade while heating or cooling, Shade while only the fan runs, Curve, Line width, Temperature colour, Set point colour, Heating colour and Cooling colour, then the axes and layout. Source and grouping are left out.
The period, calendar spans, previous and next buttons, axes, gridlines and compact layout are the same as on the line chart. See Line.
Layout: one chart for the whole card. Every shared option is described on the Options page.
Previous: State timeline · Next: Sankey · All styles