Repository navigation
Style Timeline
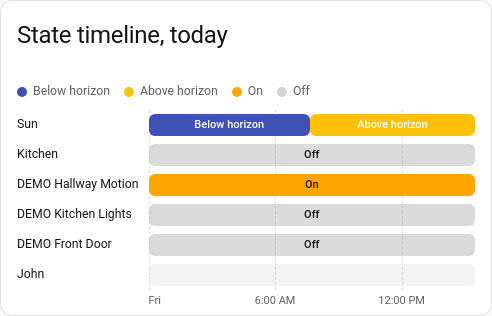
When each entity was on, off, home, heating or anything else, as one row of coloured bars per entity: the lights, the doors, the heating's modes and who was home, all on one time axis. It reads states as Home Assistant words them ("Heat", "Away"), and shares the line chart's period, calendar spans and previous and next buttons.
Things with a handful of states: lights and switches, doors and windows, presence, a thermostat's mode or action, a washing machine's programme, an alarm.
type: custom:chartdeck-card
style: timeline
title: Today
period:
  calendar: day
entities:
  - entity: sun.sun
  - entity: binary_sensor.hallway_motion
    group: Hall
  - entity: binary_sensor.front_door
    group: Hall
  - entity: light.kitchen
    group: Kitchen
  - entity: climate.lounge
    attribute: hvac_action
To use this style, set style: timeline (or pick State timeline under History charts in the editor's Style section). The chart options are in the editor's Chart section.
- Each state has a colour: Home Assistant's theme colour for that domain and state where the theme has one, else a built-in one (on and open amber, home green, heating orange, cooling blue, detected and unlocked red, locked green, and so on). A state with no colour of its own gets one picked from the word itself, so it is the same colour on every row.
- Quiet states are faint (off, closed, away, not_home, idle, standby, docked, clear, disarmed), so the active ones stand out.
- Unavailable and unknown are gaps, not bars.
-
Each bar is labelled with its state where it is wide enough (
bar_labels: state). - A legend of the states sits above the chart.
-
Period: the last 24 hours when
periodisn't set.
bar_labels: state     # state (default), duration, both or none
state_colors:         # your own colour for any state: palette name or CSS colour
  on: amber
  heat: "#ff5722"
x_axis: true          # time labels
gridlines:
  vertical: true      # lines down at each time label
header: above         # above (default) or hidden: the legend of states
tooltip: true
compact: false-
bar_labels: durationlabels each bar with how long it lasted ("45 s", "12 min", "3 h 30", "2 d 4 h");bothgives the state and its duration. -
state_colorswins over every other colour. - Per entity,
groupputs rows with the same group together under a heading, where the group is first listed. Entities without a group stay where they are. - Per entity,
attributedraws an attribute's values instead of the state, such as a thermostat'shvac_action. - A row whose states are all numbers, with more than 8 different ones, is a measurement rather than states. It shows "Readings, not states: a line chart suits this one" instead of a bar per reading.
- A timeline reads states, which long-term statistics don't keep, so
sourcemust behistoryandgroup_bydoesn't apply.
Hovering or touching the chart shows the time under the pointer and every row's state then, with how long that state lasted ("Heat for 2 h 10"). On a period that runs past now, a line marks now.
In the editor: Text on the bars, the time labels and lines down, the hover switch, Compact, Legend of states, and a State colours list where you add a state and its colour. Each entity has a Group.
The period, calendar spans and previous and next buttons are the same as on the line chart. See Line.
Layout: one chart for the whole card. Every shared option is described on the Options page.
Previous: Beeswarm · Next: Climate · All styles