Repository navigation
Style Box Plot
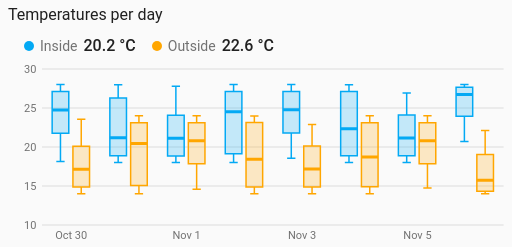
How a sensor's readings spread: each box shows the median, the middle half of the readings (the quartiles) and the whiskers. One box per entity, or one per hour, day, week or month. It is a history chart like Line, and shares its period, calendar spans, previous and next buttons, statistics, axes, hover readout and compact layout.
Comparing spread rather than a single average: how steady each room's temperature is, how a day's readings vary over a week, which sensor swings the most.
type: custom:chartdeck-card
style: box
title: Temperatures per day
group_by: day
period:
  last: 7
  unit: day
entities:
  - entity: sensor.inside_temperature
    name: Inside
  - entity: sensor.outside_temperature
    name: Outside
To use this style, set style: box (or pick Box plot under Distributions in the editor's Style section). The chart options are in the editor's Chart section.
-
One box per entity over the period. With
group_by(hour,day,weekormonth) there is one box per group instead, and several entities sit side by side in their colours. - Each value counts for as long as it held. History records changes, so a room that sat at 20 °C all day and flickered to 30 °C for a few minutes has a median of 20. The value carried in from before a group counts from its start, unavailable time doesn't count, and the current group stops at now.
-
From long-term statistics (
source: statistics) hourly rows are read (five-minute rows for hourly boxes). Each row counts once, and its own min and max widen the box's lowest and highest. - Whiskers reach 1.5 times the box's height, with readings beyond them drawn as outlier dots.
-
Period: the last 24 hours when
periodisn't set, as on the line chart.
whiskers: tukey         # tukey (default): 1.5 × box height, outliers as dots; range: lowest to highest
orientation: vertical   # vertical (default) or horizontal, with the names up the side
readings: false # true draws each reading as a dot over its box-
readings: truedraws each reading as a dot, nudged sideways the same way every time, over its box. At most 120 are drawn per box. - Quantiles are weighted (Hazen): four readings 1, 2, 3 and 4 have a median of 2.5.
- Grouping only sets the boxes' boundaries here, so there is no Combine with choice.
- Per entity,
colorsets the box colour.
Hovering or touching a box shows its highest, quartiles, median, lowest, average and number of readings, and how many outliers there are.
In the editor: the period and source, Group readings by, Boxes, Whiskers reach, Show each reading, the axes and layout. Each entity has a Box colour.
The period, calendar spans, source, axes, gridlines, hover and compact layout are the same as on the line chart. See Line for each one.
Layout: one chart for the whole card. Every shared option is described on the Options page.
Previous: Heatmap · Next: Funnel · All styles