Repository navigation
Style Sparkline
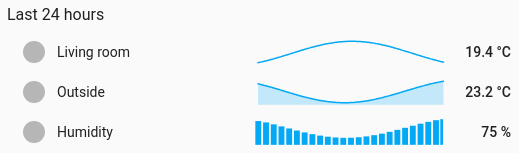
A tiny trend beside each entity's name and current value, one row per entity: a list of rooms that shows which way each is heading. Each row is a line, a filled area or columns.
Lists where the value matters most and the trend is a hint: room temperatures, battery levels, tank levels, prices.
type: custom:chartdeck-card
style: sparkline
title: Rooms
entities:
  - entity: sensor.living_room_temperature
    name: Living room
  - entity: sensor.outside_temperature
    name: Outside
    spark: area
  - entity: sensor.humidity
    spark: column
To use this style, set style: sparkline (or pick Sparklines under History charts in the editor's Style section). The chart options are in the editor's Chart section.
-
Each row is a line (
spark: line), 1.5 px wide, thinner than a line chart's. -
Each row takes its value's colour band, like the bar styles, unless the entity sets its own
color. - Each sparkline is scaled to its own readings, so a small change still shows. Columns keep zero in view.
- Columns of raw readings would be hairlines, so an ungrouped column row is averaged by hour (a period of two days or less) or by day.
-
Period: the last 24 hours when
periodisn't set.
spark: line         # line (default), area or column; per entity too
curve: smooth       # smooth (default), straight or step
line_width: 1.5     # px
bar: false # true: the 1.0 thin bar under each name and value, with the sparkline beside it-
sparkon an entity overrides the card's, so one card can mix lines, areas and columns. - When every row is a column row and nothing is grouped, the whole card is grouped (by hour or day as above), so statistics can be asked for at the right size.
-
bar: trueputs a thin bar under the name and value, filled from min to max in the band's colour, with the target marked when Show target is on. - The usual Show switches (icon, name, value) apply to every row. An unavailable entity keeps its row with its state as the value and an empty sparkline.
- Per entity:
sparkandcolor.
In the editor: Sparkline, Curve, Line width and Bar under the name and value. Each entity has a Sparkline kind and a Colour.
The period, calendar spans, previous and next buttons, source and grouping are the same as on the line chart. See Line.
Layout: one row per entity, like the bar styles. Every shared option is described on the Options page.
Previous: Range area · Next: Streamgraph · All styles